It’s Not Easy Being Green: Access to Sustainable Urban Infrastructure and Distributive Justice in Low-Income and Minority-Concentrated Communities
By Jules Carter
Senior Honors Thesis Department of Sociology
University of North Carolina at Chapel Hill
April 8, 2016
Approved:
Advisor
Abstract
In urban environments, low-income and minority-concentrated neighborhoods are more likely to
be exposed to risk and vulnerability associated with environmental exposure, depending on the
unique riskscape of a geographic region. Often, the positive externalities of sustainable urban
infrastructure are disproportionately consumed by predominately non-Hispanic white
neighborhoods with moderate to high median incomes. This project is an analysis of the access
that residents in The Research Triangle region have to public sustainable urban infrastructure and
amenities across various measures of race and class, including proportion of Black residents,
proportion of Hispanic residents, median household income, educational attainment, and the
proportion of households receiving public assistance income. Quantitative analyses were
conducted at the census block group level, and it was hypothesized that block groups with a
higher proportion of Black residents, a higher proportion of Hispanic residents, lower median
household income, a lower proportion of residents that have received post-secondary education,
and a higher proportion of residents receiving public assistance income are likely to have a
greater average distance from the block group centroid to the 10 closest amenities. A multiple
regression analysis revealed that in a given block group a higher proportion of Black residents, a
higher proportion of Hispanic residents, and a lower proportion of residents having received a
post-secondary education were predictive of a higher average distance to sustainable amenities at
a statistically significant level.
Keywords: sustainable urban amenities, riskscape, median household income, educational
Literature Review
A.!Introduction
As a new era of applied science and cultural change known as the Environmental Revolution
continues to unfold, technologies and infrastructure that reduce pollution, conserve natural
resources, minimize greenhouse gas emissions, and promote sustainability have increased in
demand throughout the world. And, as with the Industrial Revolution, Agricultural Revolution,
and Digital Revolution, access to these technological advances has not been evenly distributed.
The legacy of racial and economic marginalization and discrimination continues to prevent racial
and ethnic minorities, as well as individuals with little income form accessing the built
environmental amenities that are evolving as a result of the Environmental Revolution.
In North Carolina, extraterritorial jurisdiction (ETJ) is a legal phrase that is used to describe the right of municipalities to apply zoning, planning, land use regulations, and community
development ordinances to nearby properties that are neither within the municipality, nor
incorporated into another community (Wilson, Heaney, Cooper, & Wilson, 2008). This means
that municipalities are able to use their discretion to decide which neighborhoods they will and
will not annex into their corporate limits. Incorporation allows neighborhoods to receive basic
health-promoting municipal services, as well as the right to vote and influence land-use
decisions. It is common for municipalities to choose to annex businesses or commercial parks
that fall outside of their corporate limits, while bypassing certain neighborhoods and
communities.
In Mebane, NC, officials have been able to use ETJ to discriminate against historically
African American communities under the protection of law. The West End Revitalization
environmental issues that are impacting several of the historic African American communities in
Mebane. Many WERA neighborhoods, which have high ownership rates, contain residents that
are descendants of slaves living on land that has been passed down through generations. Rather
than annexing these neighborhoods to maintain the logical growth pattern of the city and foster
diversity, Mebane officials’ abuse of ETJ statutes to maintain residential segregation
disenfranchises Black neighborhoods, depressing property values, and creating negative built
environmental conditions (Wilson et al., 2008). Not only are West End residents denied local
voting rights and access basic municipal services, like sewage and water, but they are also
disproportionately burdened by undesirable land uses. Although these residents have no political
representation, they are still subject to the authority of Mebane officials. The West End
community contains a wastewater treatment facility, a hazardous waste site, and an eight-acre
landfill, as well as many brownfields and abandoned sewage tanks that are leaking carcinogenic
waste materials (Wilson et al., 2008).
This Mebane case study is an example of environmental injustice that is representative of
many of the issues that are critically examined in this study. What is happening in this
community exemplifies the intersection of discriminatory urban development policy, inequitable
distribution of both amenities and undesirable land uses, and the role of infrastructure disparities
in creating negative health outcomes in North Carolina. Sustainable urban development is
becoming an increasingly significant issue in North Carolina as metropolitan areas are expanding
rapidly, and addressing inequality is also an important part of urban expansion.
Preliminary studies of expanding urban areas around the globe have revealed a pattern of
inequality in which minority-concentrated and impoverished communities have less access to
more likely to be exposed to environmental risks and hazards, and experience negative health
outcomes. However, these results are not necessarily consistent across time and space. Many
researchers have revealed paradoxical patterns of increased access to sustainable amenities
among the urban poor.
The Research Triangle is another area in North Carolina—contained within the boundaries of
Orange, Durham, and Wake counties—that is experiencing rapid metropolitan growth. As with
any booming metropolitan area, infrastructure development, mass transportation,
suburbanization, urban sprawl, and sustainability initiatives are critically important issues. The
purpose of this investigation is to discover whether the patterns of decreased access and
increased vulnerability within minority-concentrated and impoverished communities that persists
in Mebane, and in developing urban areas across the world, accurately captures what is occurring
in the Research Triangle region.
Research Questions
This study will continue to build on the existing literature associated with sustainable amenities
and distributive justice in urban settings. More specifically, this research will aim to answer the
following questions:
•! Are the patterns of environmental inequality that are present in The Research Triangle
(Orange, Durham, and Wake counties) consistent with the pattern of decreased access to
sustainable urban amenities in low-income and minority-concentrated neighborhoods that
persists in many metropolitan areas throughout the globe?
•! Is there a paradoxical relationship between socio-economic disadvantage and access to
•! To what degree is the accessibility of sustainable urban amenities associated with the
racial and ethnic makeup, or the class structure of a particular geographic area?
•! Are measures of race and ethnicity, or measures of class and socio-economic status more
predictive of patterns of access?
When municipalities work together to define themselves as a region, they deal with many
unique challenges. The Research Triangle is one of the fastest growing in the country,
requiring dense development to effectively utilize the remaining space and prevent urban
sprawl (VanderJeudt, 2014). This area is also a unique riskscape. In this sub-region of the
North Carolina Piedmont, flooding due to insufficient stormwater retention infrastructure is
one of the biggest environmental risks that urban residents face. Sustainable urban amenities
not only yield positive externalities in relation to residential quality of life, but they also help
remediate the consequences of natural environmental risk. The level of rapid development, as
well as the specific riskscape that is comprised of Orange, Durham, and Wake counties,
make it an ideal study area to understand sustainable urban development and the processes
that may create or perpetuate inequality.
B.!Green Infrastructure
Green Infrastructure in the Urban Environment
Green infrastructure refers to natural, designed, or engineered systems that enhance public
health and environmental quality. This includes, but is not limited to: rain gardens, stormwater
retention structures, vegetation, wetlands, open green space, and penetrable surfaces through
which stormwater can easily infiltrate (Dunn, 2010). In urban environments, designed and
soil drainage, improve food security, reduce air and water pollution, and provide other cultural
and recreational benefits (Jenerette, Harlan, Stefanov, & Martin, 2011). It is also important to
note that green infrastructure is not limited to publicly-accessible amenities like parks, reserves,
riparian areas, urban forests, greenways, and trails. Private green infrastructure that is a part of
yards, communal grounds, and corporate campuses also facilitate access to sustainable urban
infrastructure (Wolch, Byrne, & Newell, 2014).
Access to sustainable urban infrastructure and amenities has been recognized as an important
factor in enhancing health and well-being on a large scale. Urban trees alone help conserve
energy and water, reduce ambient carbon dioxide, reduce noise pollution, enhance safety and
aesthetics, and moderate urban climate (Heynen, Perkins, & Roy, 2006). Increased canopy cover
also correlates with increased residential property values, social cohesion, increased elderly
longevity, and decreased childhood asthma (Landry & Chakraborty, 2009). Considerable
attention has also been paid to the association between green cover and obesity trends. In a study
of built environmental conditions, Wolch et al. (2014) controlled for several environmental
factors like pollution exposure and urban foodscape, as well as social factors like crime, poverty,
and unemployment, and found that there is still a statistically significant association between
proximity to parks and recreational programs, and the development of obesity. In areas where
ambient heat poses a significant threat to residents, the availability of ecosystem services during
the summer significantly mitigates surface temperatures. Vegetation provides a potential human
safety service in areas where extreme climate and chronic conditions routinely exceed dangerous
levels (Jenerette et al., 2011).
These positive externalities are counterbalanced by an elevated level of risk and vulnerability
Urban residents who do not have access to these features are also exposed to airborne pollution,
degraded water quality, and high utility costs. Urban development increases the area of
impervious paved surfaces, which contributes to both stormwater risks as well as the urban heat
island effect (Dunn, 2010). A lack of adequate hydrologic ecosystem services dramatically
increases storm severity and flood risks, negatively impacts water resources, and over-burdens
sewer and stormwater systems (Dunn, 2010). Climate change also poses a significant threat to
urban residents, especially because it increases the amount of energy that buildings require to
maintain their internal temperature, which further degrades air quality (Thompson, 2009).
Buildings, along with transportation and industrial operations, are the largest contributors to
greenhouse emissions in urban environments.
Environmental Risk and Vulnerability on the Urban Landscape
According to Jenerette et al. (2011), vulnerability is a joint consequence of an individual’s
socio-spatial orientation within a particular riskscape, as well as the coping mechanisms that are
available to them. In that context, the term ‘riskscape’ was used to refer to spatial variations in
risk and vulnerability to the human consequences of heat exposure. However, in the context of
this investigation, this term can be broadened to include all of the risks that accompany the lack
of access to sustainable infrastructure in the urban landscape. Often, large metropolitan areas
have significantly warmer ambient temperatures than surrounding areas. Poor urban residents are
particularly vulnerable to heat hazards, and urban heat islands have negative consequences for
the health of residents who do not have the capacity to cope with them (Jenerette et al., 2011).
Previous research suggests that the vulnerability of the urban poor may be partially associated
temperatures and increases susceptibility to negative health outcomes (Jenerette et al., 2011). In
the case of vegetative cover, poor urban residents’ lack of resources to purchase and maintain
vegetation results in a dependence on public investments (Heynen et al., 2006). This trend
persists with other public ecological amenities. In a study of the social value of accessible green
space, Wen, Zhang, Harris, & Holt (2013) found that persistent residential segregation by
race/ethnicity and income was associated with disparities in the ability of urban residents to meet
physical activity recommendations. This suggests that low income and minority-concentrated
neighborhoods are underexposed to the positive externalities of parks and green spaces. The
availability of excess or unnecessary ecosystem services to empowered groups may also
exacerbate the vulnerability of the entire urban ecosystem (Jenerette et al., 2011)
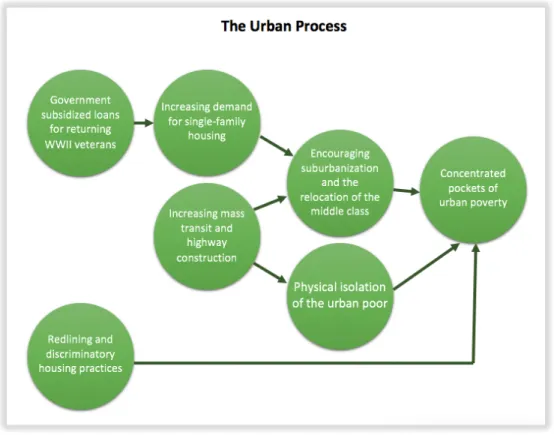
C.!The Urban Process
In 1934, in the wake of the Great Depression, the Federal Housing Administration (FHA)
was formed in order to cope with the massive amount of foreclosures that had occurred. The
primary function of the organization was to underwrite mortgages, enabling citizens to own
homes (Wilson W. J., 2008). The FHA was able to selectively administer mortgages by enacting
policies that allowed them to exclude certain neighborhoods based on data that suggested a
probable loss of investment in those areas (Wilson W. J., 2008). This process, known as
“redlining”, was typically based on the racial composition of a particular area and prevented any
prospective homebuyers form obtaining a mortgage to purchase property in these areas. While
many of the neighborhoods included in these redlined districts were concentrated with European
setting the stage for the degraded, minority-concentrated inner-city environments that persist
today.
Although this formalized redlining process ceased in the 1960’s, subsequent public policy
was crafted specifically to contain the African Americans that already lived in the blighted urban
environments (Wilson W. J., 2008). Also, beginning in the 1950’s, large numbers of government
subsidized loans provided to military veterans encouraged the suburbanization of the middle
class. Further highway construction intended to connect these suburban areas to central business
districts continued to encourage the relocation of middle-class urban residents while physically
isolating poor, minority-concentrated areas, permanently altering the political economic
landscape of urban environments. As suburban sprawl rapidly advanced, policies that allowed
suburban areas, which had formerly been annexed by cities that provided municipal services,
began to separate their financial resources from those of larger cities (Wilson W. J., 2008). This
separation created separate political jurisdictions, allowing suburban communities to have more
control over covenants and deed restrictions. This created yet another structural barrier that kept
poor minorities concentrated in dilapidated, under-resourced, and economically and socially
isolated urban environments overwhelmed by poverty.
Susan Handy (2005) defines urban sprawl as the low-density, auto-oriented spread of
metropolitan regions pervasive throughout the United States. It is neither a form of development,
nor an efficient use of land. It is the effect of the excessive spatial growth of cities, when the
spread of development outpaces population growth (Brueckner, 2000). According to Ann Dale
and Lenore Newman (2009) sustainable urban development involves the intersection of an
ecological imperative to live within the carrying capacity of a particular environment, the
promote democratic development. Understanding the social formation of urban environments,
processes of urban sprawl, and the social production of nature is an important part of
understanding the social processes that create and maintain inequality (Heynen et al., 2006).
It is critical to distinguish between inequalities in the current patterns of the locations of
amenities and disamenities, and the processes that cause this inequality (Landry & Chakraborty).
Political economic factors play a critical role in producing urban environments. With the
emergence of neoliberal capitalism as a mode of production, cities have become centers for
production, consumption, and exchange. Through this process, their ecological environments
have also become a part of this commodified exchange and embody the structural inequalities
that characterize the urban political economy (Heynen et al., 2006).
D.!Environmental Justice
The environmental justice movement emerged as a means of addressing inequalities in the
distribution of environmental amenities, as well as exposure to undesirable land uses. The
primary assertion is that economically disadvantaged and minority-concentrated residential areas
are disproportionately exposed to environmental risks and hazards (Landry et al., 2009). Also,
that health disparities across race, class, and income groups are inextricably linked to the
availability of resources that promote health and hazards that harm health (Wen at al., 2013).
Promoting urban sustainability will involve a paradigm shift in the way that the relationship
between development and social equity are conceptualized (Thompson, 2009). This uneven
access that is at the center of the grievances for the environmental justice movement is the result
of histories of class and racial inequality, histories of land development, philosophies of design,
evolving ideas about leisure and recreation, and state oppression (Wolch et al., 2014).
Much of the literature on the distribution of sustainable infrastructure has focused on inequity
along the lines of race, ethnicity, class, and income. In the United States, minorities and people
with little income usually occupy the urban core, where green spaces are often sparse and poorly
maintained. Wealthier households on the suburban periphery are more likely to have access to
green spaces that are abundant and well-maintained (Wolch et al., 2014). According to Jenerette
et al. (2011), economic capital is the principle gradient along which social stratification
manifests through environmental conditions. During a study of surface temperature and heat
riskscapes in Phoenix, Arizona, they found strong relationships between neighborhood economic
status and the availability of cooling-related ecosystem services and water uses. These findings
were also consistent with previous studies relating median household income to surface
Los Angeles, California, and many other studies relating environmental inequalities to residential
segregation (Jenerette et al., 2011). In another study on the distribution of public right-of-way
trees in Florida, Shawn Landry and Jayajit Chakraborty (2011) found evidence to support their
inequity hypothesis that these trees are disproportionately distributed along economic strata,
housing tenure, and race/ethnicity. Also, in areas annexed prior to 1961, right-of-way tree cover
declines in areas containing a higher proportion of renters, and in block groups containing a
higher proportion of African Americans. This study is yet another indicator that exposure to
environmental hazards correlates with income, housing tenure, rentership status, class, and
race/ethnicity.
In North Carolina specifically, research conducted on the role of built environmental
infrastructure disparities in producing and perpetuating public health disparities has revealed
several key patterns. In semi-urban areas, African Americans are typically concentrated in the
periphery, while whites are concentrated at the core. This pattern is antithetical to the residential
patterns that usually persist in metropolitan areas, where people of color are concentrated in the
eroded urban core, and whites occupy the periphery (Wilson, Heaney, Cooper, & Wilson, 2008).
It is due, in part, to the racial residential segregation, metropolitan fragmentation, and urban
decay that persist in the legacy of slavery and Jim Crow policies. Wilson et al. (2008) also
concluded that the current disease-exposure paradigm, which focuses on external exposure,
exposure pathway mechanisms, biologically effective dose, and dose-response relationships, is
inadequate when attempting to explain the connection between infrastructure and health
outcomes. They contend that the infrastructure disparities that exist in underserved
The history of environmental justice activism in North Carolina is robust, beginning with the
1982 unrest over the construction of a landfill sited in the predominantly African American
impoverished community of Warren County. The subsequent protests and demonstrations set the
stage for the environmental justice movement on a national scale. As rapid metropolitan growth
continues to progress in North Carolina, it is important to understand the dynamic processes that
contribute to inequality and shape the environmental justice narrative.
E.!The Policy Response
There are many critical factors that contribute to unequal access to environmental amenities,
and public policy is one of the most important. Wilson et al. (2008) explore what they call “legal
epidemiology,” which is a research method that involves the examination of environmental laws,
public health statutes, building codes, and exposure-disease dynamics to understand how public
policy may contribute to poor health outcomes. This method stresses the importance of legal
non-compliance by municipalities, industries, and other entities that may lead to infrastructure
disparities and expose marginalized communities to increased environmental risks (Wilson et al.,
2008). They found that the dependence of poor African Americans on inadequate sewer and
water infrastructure may be caused by local public water treatment centers’ refusal to comply
with the Clean Water Act and the Safe Drinking Water Act Regulations. This non-compliance
may compromise sewer and water systems, increase levels of harmful substances in drinking and
surface water, increase exposure to GI illnesses, elevate risk exposure, reduce quality of life, and
place higher stress on minority communities (Wilson et al., 2008). In smaller municipalities that
are struggling to meet federal sewer and drinking water regulations, non-compliance may also
In Mebane, NC, local officials were able to use extraterritorial jurisdiction statutes to
disenfranchise entire neighborhoods and prevent them from accessing the most basic amenities
(Wilson et al., 2008). This case illustrates the fact that it is not only non-compliance and
inadequate public policies that indirectly contribute to inequality. There are also legal
mechanisms that are intentionally abused for the purpose of creating negative built
environmental conditions that disproportionately impact marginalized groups.
In order to adequately address the social aspect of sustainable community development,
policy solutions must include strategies for keeping communities accessible to a diverse range of
people (Dale et al., 2009). Alexandra Dapolito Dunn (2010) advocates for investments in green
infrastructure in areas where the urban poor are concentrated, maintaining that this type of
investment will allow the urban poor to consume the most direct improvements in quality of life
while improving the overall health of the ecosystem for all urban residents. The positive
outcomes of these enacted policies have been documented to alleviate the burden of
environmental degradation on urban residents in many different contexts.
There are also policy solutions that address very specific infrastructural concerns, livability
elements, and environmental risks. In their study of heat riskscapes in the American Southwest,
Jenerette et al. (2011) found that there are multiple structural and individual risk factors for the
heat-related consequences of urban living. The efficacy of landscape management practices is
significantly increased when combined with policies that improve social support services,
housing quality, heat warning systems, and emergency response plans. Some of these policies
include economic subsidies for households to purchase climate control, public air-conditioned
buildings, periodic welfare checks for the elderly, and social network support to provide
Policies that promote the energy efficiency of green buildings can reduce energy costs for the
urban poor, yielding more affordable utility bills (Dunn, 2010). Positive Results at the Robert
Taylor Housing Project in Chicago, Illinois illustrate the societal value of green infrastructure
concentrated in urban, poverty-stricken areas (Kuo, Sullivan, Coley, & Brunson, 1998). In one of
the earliest analyses of the impact that sustainable infrastructure has on the lives of poor urban
residents, Kuo et al. (1998) found that in 145 urban public housing residents randomly assigned
to 18 architecturally identical buildings, the use of common spaces and the formation of
neighborhood social ties was positively correlated with the level of vegetation in those common
spaces.
Public policy decisions are also instrumental in the formation of community-based
organizations that can promote access to sustainable infrastructure in poor,
minority-concentrated urban areas. The New York Restoration Project (NYRP), and organization that
funds sustainable improvements in environmentally and economically burdened areas of New
York, was able to fuse community gardening in East Harlem with the installation of solar panels,
wind turbines, and other sustainable improvements (Dunn, 2010).
F.! Sustainable Development and the Economy
Aside from the health and safety benefits that sustainable policy solutions confer, there are
also several positive economic outcomes. According to Dunn (2010) incorporating sustainable
infrastructure into the urban landscape can help combat poverty, enhance food security and
nutrition, as well as promoting local economic development. The renewable energy industry is
also expanding in light of the Environmental Revolution and the concomitant technological
communities, and many communities have programs that allow energy producers to sell power
back to the grid (Thompson, 2009).
The Leadership in Energy and Environmental Design (LEED) sustainable compliance rating
system has increased the demand for sustainable development, which has prompted many cities
to appropriate additional funds for retrofitting public facilities in order to comply with new
regulations (Thompson, 2009). The implementation of green infrastructure will require urban
municipalities to enter the burgeoning green economy, hiring architects, engineers, and
construction maintenance workers, as well as creating many other “green collar jobs” (Dunn,
2010).
Programs that are currently being piloted in Los Angeles, California have revealed that this
increased demand presents the opportunity for cities to implement hiring policies that mandate
that a certain proportion of new hires be sourced from neighborhoods with high unemployment
rates. Preliminary assessments of these hiring policies, as well as policies that allow these
individuals to be protected under collective bargaining agreements have thus far yielded positive
results for minority inclusion in publicly-funded projects (Thompson, 2009). Furthermore, green
infrastructure projects that create farmable urban green space may also provide healthy,
affordable produce to urban residents who may be required to pay more for nutritious food than
suburban residents (Dunn, 2010). Overall, the policy response to the inequitable distribution of
green infrastructure has the potential to greatly influence the urban environment.
G.!The Urban Paradox
It is important to note that several studies suggest variation in the spatial distribution of
previously proposed. Some previous studies have found that non-white residents with lower
socio-economic status have less access to parks and other public amenities, following along
conventional patterns of lower availability in census tracts with higher poverty and a greater
proportion of minorities. However, some studies have found that marginalized groups are not
necessarily deprived of access (Wen et al., 2013). Wen et al. (2013) found that non-rural census
tracts with lower median household income and higher minority concentration were in closer
spatial proximity to local parks. This clearly demonstrates that the hypothesis that neighborhoods
with greater proportions of poverty, and Black and Hispanic/Latino residents are less exposed to
parks does not necessarily describe what is happening on a national level. They concede that this
pattern of spatial access may not account for social barriers to accessing these parks, such as
traffic, walkability, and safety (Wolch et al., 2013). Boone, Buckley, Grove, & Sister (2009)
found that in Baltimore, Maryland, although African Americans were more likely to live within
walking distance of a park, white residents had access to more park acreage, which reduced
congestion and made these parks more useable. Although not all of these findings are consistent
across time and space, they do reveal some of the nuance in the distributive justice narrative.
Addressing these environmental justice concerns with infrastructural changes introduces a
social process known as gentrification. This term was first used by Ruth Glass in the 1960’s to
describe the increased property values, upgraded infrastructure, decreased urban sprawl, and
improved safety and aesthetic appeal that exemplify urban regeneration (Dale & Newman,
2009). There are several perceived consequences of this process, including decreased social
diversity, resentment among residents, and unaffordable housing costs. Infrastructural changes
can also lead to the urban green space paradox, a process through which installation of
residents. Ironically, if urban sustainability approaches are successful in improving conditions
for urban residents and businesses, without proper policy safeguards, they may eventually
exclude those who are most in need of access to these improvements. Urban infrastructural
regeneration that brings about gentrification can dramatically alter the commercial retail
infrastructure that sustains low-income residents (Wolch et al., 2014). This paradox has negative
consequences, as it continues to force low-income and minority residents into areas with high
crime and inadequate infrastructure services (Dale et al., 2009).
In light of the discrepancy among researchers about the nature of the association between
access to sustainable urban infrastructure and the demographics of a community, this
investigation will provide an additional case study with which we can understand this
phenomenon. The goal is to determine whether marginalized populations do, in fact, have less
access to sustainable urban amenities. Or, whether the nature of that relationship contradict
conventional assumptions surrounding social and economic marginalization and access to
health-promoting services, a several recent studies have suggested. Also, whether measures of race and
ethnicity, or class and socio-economic status are more predictive of patters of access. Ultimately,
this study will provide a greater understanding of environmental inequality in urban settings.
Data and Methods
A.!The Research Triangle
The “Research Triangle” is label that is used to refer to the metropolitan geographic area
that is defined by Duke University, the University of North Carolina at Chapel Hill, and North
Carolina State University (shown below in Figure 2). This area includes Raleigh, Durham, and
(VanderJeudt, 2014). These metropolitan areas fall primarily within Orange, Durham, and Wake
counties, which define this study.
After WWII, North Carolina’s economy, which had been primarily based on tobacco,
textiles, and furniture manufacturing, began to decline (Link & Scott, 2003). Tobacco
manufacturers began employing less as automation increased and demand decreased, textile
manufacturers began to face competition from Asian manufacturers, and furniture manufacturing
began to disperse throughout the northeastern United States. Influential members of the
academic community proposed a plan that would use the three triangle universities to attract new
industries (Link & Scott, 2003). When Research Triangle Park was established in 1951, North
Carolina was experiencing an out migration of many of its college graduates. As the park
continued to grow, the population of the Raleigh-Durham-Chapel Hill area also experienced
massive and diverse growth. According to the US Census Bureau, the population of Raleigh
increased by 47%, from 276,093 to 403,892, between 2000 and 2010 (US Census Bureau, 2015).
This rate of population growth is almost unprecedented.
B.!Data
The population data that was analyzed in this study was produced by the United States
Census Bureau during the 2010 nationally representative decennial census. The socio-economic
data was retrieved through Social Explorer, a data service that allows users to filter and
download information from the annual American Community Survey (ACS) that is administered
by the U.S. Census Bureau (Social Explorer, 2014). The full data set was then limited to a subset
that included only the the three counties of interest (Orange, Durham, and Wake counties). The
population that resides within the geographic areas of interest. Racial data is only available down
to the census block group for anonymity reasons, so this unit was the highest resolution to which
observations could be made during this study. Block groups are statistical units defined by the
U.S. Census Bureau that are located within a census tract and typically contain between 600 and
3,000 people. Within the three counties of interest in this study, there are 682 census block
groups in the 2010 census. However, there were several block groups for which no data was
available for certain measures. There were also slight changes in census block group divisions
between 2010, which was the year that the population data was pulled from, and 2014, which is
the year that the socio-economic data was pulled from. Overall, there were 640 census block
groups represented in the study that had complete data profiles across all measures.
The data was organized into visual spatial representations using geographic information
systems (GIS). Urban amenity data was made available in downloadable GIS data layers by
Durham, Wake, and Orange County GIS Services. These layers are programmed automatically
populate a map when loaded into a GIS program. The information from these data sources is
typically updated annually. However, careful steps were made to ensure that all amenity data was
current and updated during the year 2010. The sustainable urban amenities that were included as
data points in this study included parks, athletic fields, public boating centers, campgrounds, disc
golf courses, dog parks, public fishing sites, greenways, outdoor picnic areas, walking sites, and
large areas of public green space with penetrable surfaces. Large public areas with impenetrable
surfaces like concrete, pavement, and tarmac were not included. Overall, there were 501 amenity
Independent Variables
The independent variables in the quantitative analyses are divided into two major
categories: racial and ethnic data, and socio-economic data. For racial and ethnic data, the
proportion of each block group that a racial or ethnic group included in the study accounts for
was used as the primary measure. Due to the priority that these groups were given in previous
studies, this investigation will include an analysis of the access that Black, white, and Hispanic
residents have to sustainable urban amenities. Also, to ensure that the analyses only measure the
association between access and the groups of interest, an analysis of the association between
access and total population density is also an important part of understanding patterns of access
to sustainable urban infrastructure in various communities.
The socio-economic measures were more diverse than the racial and ethnic measures.
These variables were intended to determine class, and the major indicators of class in a
sociological context are income and educational attainment. Therefore, the measures that were
extracted from the ACS were educational attainment for the population over 25, median
household income, and the proportion of households the receive public assistance income. For
educational attainment, the proportion of residents that completed any post-secondary education
past high school or a high school equivalency was used to quantify this measure. Median
household income was measured in dollars and adjusted for inflation to 2014 currency standards.
Dependent Variable
The objective of this investigation is to understand the relationship between the
demographic composition of a community and the access that residents have to sustainable urban
accessibility of amenities for each block group. Average distance to the ten closest sustainable
amenities is used as a measure of access.
C.!Methods
In order to quantify access, a procedure was devised that allowed the determination of the
average distance between the center of a given block group and the amenities in close proximity.
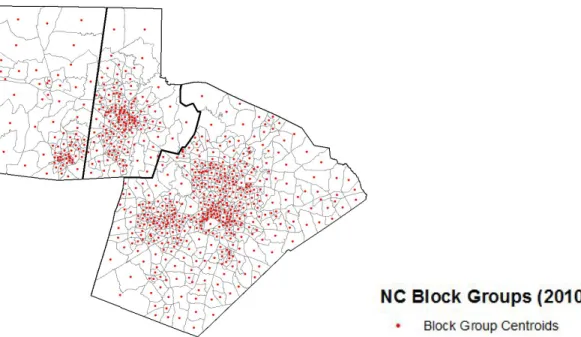
First, a centroid was generated for each block group using a GIS program called ArcMap. This is
a point that the program determines is the center of a defined geographic area. Figure 2 is a map
depicting the three counties that comprise the study area divided into census block groups and
populated with the centroid of each block group.
After the centroid was determined for each block group, a population density map was
created for the total population per square mile in each block group, and the proportion of Black,
white, and Hispanic residents within each block group. Each density map is divided into five
classes and represented using graduated colors. In the total population density map, the classes
have been divided using a quintile scale, which is reflected in the legend. All of the ethnic
density maps have been classified using what ArcMap determines are natural breaks in the
distribution using an algorithm. Also, the points representing the 501 sustainable urban amenities
included in the study have been added as a layer on top of each density map. These
representations are shown in Figures 3, 4, 5, and 6.
Figure 4. White Population Density. This map illustrates the proportion of the population that identifies as white in each block group, as well as the location of each sustainable urban amenity included in the study.
Figure 6. Hispanic Population Density. This map illustrates the proportion of the population that identifies as Hispanic or Latino in each block group, as well as the location of each sustainable urban amenity included in the study.
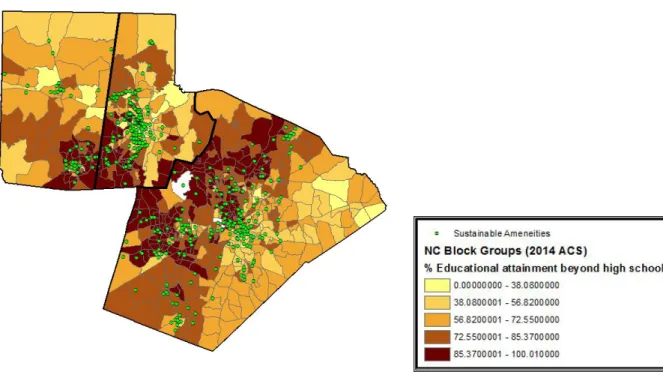
Similar density maps were rendered for the socio-economic data. This data was also
divided into fived classes, and classified using natural breaks. Figures 7, 8, and 9 illustrate the
educational attainment, median household income, and households receiving public assistance
for each block group, relative to one another. Again, the sustainable amenities that have been
included in the study have been plotted on top of each of these maps in order to provide a visual
representation of these points and the relationship between their distribution and the spatial
Figure 7. Educational Attainment. This map illustrates the proportion of the population that has reached any level of post-secondary educational attainment.
Figure 9. Households Receiving Public Assistance. This map illustrates the proportion of households in each block group that receive public assistance income.
GIS software was used to determine the ten closest amenities to each block group
centroid (measured in miles). Therefore, in each analysis, each block group will have two values:
the x-value is the population proportion for each ethnic group, and the y-value is the average of
the distances to the ten closest amenities. Using these values, it was then possible to run several
regression models to determine the strength and direction of the association, as well as various
tests of significance.
The statistics software Stata/SE was used to complete all statistical procedures. Several
graphs were made to plot the relationship between the proposed explanatory variables and the
response variable. The most critical regression model that was used during the data analysis was
a multiple regression model that made it possible to determine the amount of variation in the
Hypothesis
There will be a statistically significant correlation between proportion of the population that
that fits within a particular racial or ethnic group and access to sustainable amenities in a given
block group. Block groups with a higher proportion of white residents will have greater access,
whereas block groups with a higher proportion of Black and Hispanic residents will have less
access.
Block groups with a greater proportion of post-secondary education and block groups with a
higher median household income will have greater access to sustainable amenities. Alternatively,
block groups with a higher proportion of households receiving public assistance income with
have less access to sustainable amenities. However, race and ethnicity will be more predictive of
access to sustainable urban infrastructure than any measures of class, with Black residents having
the least access.
Results
A.!Two-way Scatter Plots
The effects of each explanatory variable is graphed against the average distance to the 10
closest sustainable amenities from each block group centroid. Figures 10, 11, 12, 13, 14, 15, and
16 display these relationships in scatter plots. After graphing the relationship between population
density and the average distance to amenities (shown below in Figure 10), it became immanently
clear that this was not a linear relationship. Therefore, rather than plotting a linear regression
line, a two-way fractional-polynomial prediction plot was created to display the relationship. The
natural cluster that forms in the graph (highlighted using a red circle) indicate that, although
points fall into the region indicating relatively low population density and a lower average
distance to amenities.
Figure 10. Population Density vs. Average Distance to Amenities. This plot illustrates the relationship between population per square mile and the average distance to the 10 closest amenities from the block group centroid.
After graphing the relationship between the proportion of Black or African American
residents in a block group and the average distance to amenities (shown below in Figure 11), a
negative correlation appears form. This would seem to indicate that the higher the proportion of
Black residents in a given block group, the lower the average distance to amenities in that block
group. However, the natural cluster (highlighted using a red circle) appears to form in a region of the graph that suggests that, for most block groups in the study area, there is a low proportion of
Figure 11. Black Population vs. Average Distance to Amenities. This plot illustrates the relationship between the proportion of residents identifying as Black or African American in each block group and the average distance to the 10 closest amenities from the block group centroid.
After graphing the relationship between the proportion of Hispanic or Latino residents in a
given block group and the average distance to amenities (shown below in Figure 12), a pattern
emerged that was similar to the pattern that appeared in the graph plotting the relationship
between the proportion of Black or African American residents and the average distance to
amenities. The linear correlation would seem to indicate that the higher the proportion of
Hispanic residents in a given block group, the lower the average distance to amenities in that
block group. However, the natural cluster (highlighted using a red circle) appears to form in a
region of the graph that suggests that, for most block groups in the study area, there is a low
Figure 12. Hispanic Population vs. Average Distance to Amenities. This plot illustrates the relationship between the proportion of residents identifying as Hispanic or Latino in each block group and the average distance to the 10 closest amenities from the block group centroid.
Interestingly, after graphing the relationship between the proportion of white residents in
each block group and the average distance to amenities (shown below in Figure 13), a pattern
emerges that is similar to those in Figures 11 and 12. However, it appears to be a reciprocal
pattern. The linear correlation would seem to indicate that the higher the proportion of white
residents in a given block group, the higher the average distance to amenities in that block group.
However, natural clusters (highlighted using a red circle) appear to form in a region of the graph
that suggests that, for most block groups in the study area, there is a high proportion of white
Figure 13. White Population vs. Average Distance to Amenities. This plot illustrates the
relationship between the proportion of residents identifying as White or Caucasian in each block group and the average distance to the 10 closest amenities from the block group centroid.
Overall, the patterns among the measures of class were more straightforward. For the
relationship between educational attainment and the average distance to amenities (shown below
in Figure 14), a negative correlation indicates that the higher the proportion of the population that
has completed some level of post-secondary education, the lower the average distance to
sustainable amenities. In addition, the natural cluster that forms on the graph (highlighted using a
red circle), indicates that in most of the block groups in the study area, a large proportion of
residents over the age of 25 have a achieved some level of educational attainment beyond high
Figure 14. Educational Attainment vs. Average Distance to Amenities. This plot illustrates the relationship between the proportion of residents that have competed any level of post-secondary education in each block group and the average distance to the 10 closest amenities from the block group centroid.
For the relationship between median household income and average distance to amenities
(shown below in Figure 15), the correlation suggests that the higher the median household
income in a given block group, the higher the distance to sustainable amenities. The natural
cluster (highlighted using a red circle) that forms in the graph appears to reinforce this
conclusion. The majority of the residents in the study area have a median household income that
is around $50,000, which is on the lower end of the spectrum as is relates that the range of
median household incomes in block groups contained within the study area. Most block groups
Figure 15. Median Household Income vs. Average Distance to Amenities. This plot illustrates the relationship between the median household income (in 2014 inflation adjusted dollars) in each block group and the average distance to the 10 closest amenities from the block group centroid.
Figure 16 (shown below), illustrates the relationship between the proportion of
households receiving public assistance income and the average distance to amenities. The
correlation seems to indicate that the higher the proportion of the population receiving public
assistance income, the higher the average distance to sustainable amenities. However, the natural
cluster (highlighted using a red circle) indicates that for most block groups included in the study
area, there is a relatively low proportion of residents receiving public assistance income, as well
as a relatively low average distance to sustainable amenities. There is a disproportionately large
Figure 16. Public Assistance vs. Average Distance to Amenities. This plot illustrates the
relationship between the proportion of residents receiving public assistance income in each block group and the average distance to the 10 closest amenities from the block group centroid.
B.!Multivariate Regression Analysis
The purpose of this multivariate regression analysis was to understand the relationship
between each of the explanatory variables (population density, proportion of Black residents,
proportion of Hispanic residents, median household income, educational attainment, and the
proportion of households receiving income from public assistance programs) and the response
variable (average distance to 10 closest sustainable amenities). There were 640 observations
included in this analysis, because these were all of the block groups for which there was a
complete data profile for all measures. This analysis was testing the following hypotheses:
!! Ha1: Block groups with a higher total population density will have a lower average
!! Ha2: Block groups with a higher proportion of Black or African American residents will
have a higher average distance to from the block group centroid to the 10 closest
sustainable amenities.
!! Ha3: Block groups with a higher proportion of Hispanic or Latino residents will have a
higher average distance to from the block group centroid to the 10 closest sustainable
amenities.
!! Ha4: Block groups with a higher median household income will have a lower average
distance to from the block group centroid to the 10 closest sustainable amenities.
!! Ha5: Block groups with a higher proportion of residents that have reached a level of
educational attainment beyond high school or a high school equivalency will have a
lower average distance to from the block group centroid to the 10 closest sustainable
amenities.
!! Ha6: Block groups with a higher proportion of residents receiving public assistance
income will have a higher average distance to from the block group centroid to the 10
closest sustainable amenities.
!! Ha7: Average distance to from the block group centroid to the 10 closest sustainable
amenities will be more affected by measures of race and ethnicity.
Tables 1a and 1b (below) report the output from the multiple comparison regression model that was run in Stata/SE. According to the table, if all other variables are held constant:
!! When population per square mile increases by one person, the average distance to the 10
closest sustainable amenities decreases by 0.0003352 miles, and this effect is significant
!! When the proportion of Black residents in each block group increases by one percent, the
average distance to the 10 closest sustainable amenities decreases by 0.0202495 miles,
and this effect is significant at the 0.05 significance level.
!! When the proportion of Hispanic residents in each block group increases by one percent,
the average distance to the 10 closest sustainable amenities decreases by 0.0149miles,
and this effect is significant at the 0.05 significance level.
!! When the median household income increases by one 2014 inflation adjusted dollar, the
average distance to the 10 closest sustainable amenities increases by 0.00000180 miles,
and this effect is significant at the 0.05 significance level.
!! When the proportion of the population the has achieved any educational attainment
beyond high school or high school equivalency increases by one percent, the average
distance to the 10 closest sustainable amenities decreases by 0.040671 miles, and this
effect is significant at the 0.05 significance level.
!! When the proportion of the population that receives public assistance income increases
by one percent, the average distance to the 10 closest sustainable amenities increases by
Predictor Variables Coef. Std. Err. z P>|z| [95% Conf. Interval]
Population Per Square
Mile -0.0003352 0.0000335 -10 0.000 -0.000401 -0.0002695
Measures of
Race/Ethnicity
Proportion of Black
Residents -0.0202495 0.0039295 -5.15 0.000 -0.0279513 -0.0125477 Proportion of Hispanic
Residents -0.0149 0.0075011 -1.99 0.047 -296217 -0.0002179
Measures of Class Median Household
Income 0.00000180 0.00000261 0.69 0.490 -0.00000331 0.00000692
Educational Attainment -0.040671 0.0063255 -6.43 0.000 -0.0530687 -0.0282733
Proportion of Residents Receiving Public
Assistance Income 0.0020036 0.0040256 0.50 0.619 -0.0058864 0.0098935
Constant 6.52268 0.5280357 12.35 0.000 5.487749 7.447611
Note: N=640, Wald chi2(6)=215.01, Prob>chi2=0.0000
Table 1a. Fixed Effects Multiple Regression Analysis. This table shows the fixed effects output from the multiple regression model that was run in Stata/SE to compare the effects of measures of
race/ethnicity and class on access to sustainable amenities
Random Effects
Parameters Estimate St. Err. [95% Conf. Interval] var(Residual) 2.727493 0.1524715 2.444444 3.043318
Table 1b. Random Effects Multiple Regression Analysis. This table shows the random effects output from the multiple regression model that run in Stata/SE, and displays the estimated variance of the overall error term.
Discussion
A.!Results in Context
The multiple regression analysis shows that the hypotheses concerned with the direction of
the linear relationships between educational attainment the proportion of residents receiving
public assistance income, and average distance to amenities were supported. The hypothesis
the proportion of residents receiving public assistance income, as it was not statistically
significant. For total population density, the proportion on Black residents in each block group,
the proportion of Hispanic residents in each block group, and median household income, the
regression analysis revealed that the relationship was the opposite of that which was proposed in
the hypothesis. However, it is important to note, that the formation of natural clusters in the
two-way scatter plots for the proportion of Black residents in a block group and the proportion of
Hispanic residents in a black group seem to indicate that, for the vast majority of the block
groups included in the study area, the relationship between the ethnic makeup and the access to
sustainable amenities was largely consistent with conventional expectation. In most of the study
area each block groups had both a relatively low proportion of Black and Hispanic residents, as
well as a low average distance to the 10 closest amenities (approximately 0 to 5 miles). Overall,
the analyses show that the greater the population per square mile, the higher the proportion of
Black and Hispanic residents, the higher the proportion of the population with any
post-secondary education, and the higher the proportion of the population receiving public assistance
income, the less access residents within a particular block group are likely to have to sustainable
amenities.
The fact that, for many of the measures, the linear correlation data was less informative than
information about the natural cluster formation in the two-way plots, may help address that
discrepancy in the literature about the nature and direction of the relationship between race,
ethnicity, class, and access to sustainable amenities. It is conceivable that, depending on how the
measures of race, ethnicity, and class are operationalized, the correlation data may be less
It is also important to note that these quantitative analyses do not account for the social
barriers that may exist for members of marginalized communities who are attempting to access
sustainable amenities. Residents living in minority concentrated and economically disadvantaged
communities are more likely to face difficulties in regards to the safety of the area surrounding
an amenity, as well as concerns regarding transportation, traffic, and walkability. In communities
where most residents have access to safe and reliable transportation, amenities that may be
further away geographically could also be easier for those residents to access. This was the the
case in the study on access to sustainable amenities conducted by Boone et al. (2009).
Researchers found that although African American residents in Baltimore, Maryland were more
likely to live within walking distance of a park, white residents had access to larger park areas,
which reduced congestion and made the parks more feasible to use. This issue of congestion may also play a role in this study, because even though certain urban residents may live in closer
spatial proximity to amenities, they are also more likely to live in densely populated areas. This
means that there may be less amenities per capita, making it more difficult for these residents to
use these areas regularly.
In addition, the broader interpretation of the results of this study may not only be limited to
processes that create and maintain environmental inequality, but they may also be descriptive of
the processes of suburbanization that have shaped the features of many metropolitan areas.
Rather than a simple feedback loop between the location of amenities and the location of
low-income and minority-concentrated communities, these results may also be indicative of a process
whereby amenities were sited in locations that had historically dense populations. Then, as
areas, amenities remained stationary and shaped the spatial relationships that were observed in
this study.
B.!Future Work
Another important part of the environmental inequality and distributive injustice narrative
is the fact that marginalized communities not only have less access to sustainable
health-promoting amenities, but they are also more likely to be exposed to undesirable land uses and
hazardous conditions. Therefore, an important part of continuing this research would be to not
only understand the relationships between race and ethnicity, class, and access to sustainable
amenities, but also to understand the relationship between race and ethnicity, class, and exposure
to disamenities. This would involve a similar procedure of mapping these disamenities and
performing calculations that would quantify the relationship between different measures of race,
ethnicity, and class and spatial proximity to undesirable land uses.
Also, to help understand the nuanced story of environmental inequality and distributive
injustice, it would be helpful to augment the quantitative analyses with qualitative information on
the amenities (and potentially the disamenities) that are included in the study. As discussed
earlier, simple calculations of spatial proximity may not always account for all of the factors that
shape residents’ decisions about accessing amenities, or exposing themselves to disamenities.
One critical reason why it is important for urban residents to have access to sustainable
amenities is the beneficial effect that they have on health and wellbeing. As a part of future
work, it may also be enlightening to map various health outcomes that account for rates chronic
to understand not only the extent to which different groups residents have access to or are
exposed to various amenities and disamenities, but also the public health implications.
C.!Conclusion
Overall, with the exception of median household income, the relationships between measures
race, ethnicity, and class, and measures of access to sustainable amenities in the Research
Triangle are largely consistent with the patterns of environmental inequality that are present in
Orange, Durham, and Wake counties consistent with the patterns of decreased access to
sustainable urban amenities in minority-concentrated neighborhoods that persists in many
metropolitan areas throughout the globe. Although there were several measures of class that were
predictive of access to sustainable amenities, by and large the measures of race and ethnicity
were more predictive. This finding speaks directly to the discrepancy in the literature over
whether race and ethnicity or class and socio-economic status are more useful measures for
understanding patterns of environmental inequality. However, it also demonstrates that the
conventional assumptions about the processes that shape inequality in almost every other area of
the social sciences may not necessarily sufficient for explaining the environmental justice
References
Alkon, A. H. (2008). Black, White and green: A Study of Urban Farmers Markets. University of
California at Davis, Sociology. Ann Arbor: ProQuestLLC.
Brueckner, J. K. (2000). Urban Sprawl: Diagnosis and Remedies. International Regional Science
Review, 23 (2), 160-171.
Dale, A., & Newman, L. L. (2009). Sustainable development for some: green urban development
and affordability. Local Environment: The International Journal of Justice and
Sustainability, 14 (7).
Dunn, A. D. (2010, January 1). Siting Green Infrastructure: Legal and Policy Solutions to
Alleviate Urban Poverty and Promote Healthy Communities. Pace Law Faculty Publications.
Handy, S. (2005). Smart Growth and the Transportation-Land Use Connection: What Does the
Research Tell Us? International Regional Science Review, 28 (2), 146-167.
Heynen, N., Perkins, H. A., & Roy, P. (2006, August 4). The Political Ecology of Uneven Urban
Green Space: The Impact of Political Economy on Race and Ethnicity in Producing
Environmental Inequality in Milwaukee. Urban Affairs Review.
Jenerette, G. D., Harlan, S. L., Stefanov, W. L., & Martin, C. A. (2011). Ecosystem Services and
Urban Heat Riskscape Moderation: Water, Green Spaces, and Social Inequality in
Phoenix, USA. Ecological Applications, 21 (7).
Kuo, F. E., Sullivan, W. C., Coley, R. L., & Brunson, L. (1998). Fertile Ground For Community:
Inner-City Neighborhood Common Spaces. American Journal of Community Psychology , 26
(6), 823-851.
Landry, S. M., & Chakraborty, J. (2009). Street trees and equity: evaluating the spatial
Link, A. N., & Scott, J. T. (2003). The Growth of Research Triangle Park. Small Business
Economics, 20 (2), 167-175.
Social Explorer Tables: ACS 2014 (5-Year Estimates) (SE), ACS 2014 (5-Year Estimates),
Social Explorer; U.S. Census Bureau
Thompson, P. J. (2009). The Coming Green Economy. The State of BlackAmerica, 135.
U.S. Census Bureau. (2015). Annual Estimates of the Residential Population. Raleigh NC Metro
Area. Retrieved from
http://factfinder.census.gov/faces/tableservices/jsf/pages/productview.xhtml?pid=PEP_2015
PEPANNRES&src=pt
VanderJeugdt, B. (2014). Transportation aspects of smart growth in the Research Triangle
Region (NC): Current conditions and future prospects. East Carolina University, Department
of Geography, Planning, and Environment. ProQuest Dissertations Publishing.
Wen, M., Zhang, X., Harris, C. D., Holt, J. B., & Croft, J. B. (2013, January). Spatial Disparities
in the Distribution of Parks and Green Spaces in the USA. Journal of Behavioral Medicine,
S18-S27.
Wilson, S. M., Heaney, C. D., Cooper, J., & Wilson, O. (2008). Built Environment Issues in
Unserved and Underserved African-American Neighborhoods in North Carolina.
Wilson, W. J. (2008). The Political and Economic Forces Shaping Concentrated Poverty.
Political Science Quarterly,123 (4), 555-571.
Wolch, J. R., Byrne, J., & Newll, J. P. (2014). Urban green space, public health, and
environmental justice: The challenge of making cities 'just green enough'. Landscape and