Introduction
Colorectal cancer (CRC) is one of the most common cancers in both men and women, and remains one of
the leading causes of cancer- related death worldwide [1]. Declining incidence rates and improvements in early detec-tion and treatment have led to reduced overall mortality rates, but outcomes in patients with metastatic disease ORIGINAL RESEARCH
Blood-basedmarkersofefficacyandresistanceto
cetuximabtreatmentinmetastaticcolorectalcancer:results
fromCALGB80203(Alliance)
Ace J. Hatch1, Alexander B. Sibley2, Mark D. Starr1, J. Chris Brady1, Chen Jiang3, Jingquan Jia4,
Daniel L. Bowers1, Herbert Pang5,6, Kouros Owzar2,3,5, Donna Niedzwiecki3,5, Federico Innocenti7,
Alan P. Venook8, Herbert I. Hurwitz1 & Andrew B. Nixon1 for the Alliance for Clinical Trials in Oncology 1Duke University Medical Center, Durham, North Carolina
2Duke Cancer Institute Bioinformatics Shared Resource, Duke University, Durham, North Carolina 3Alliance Statistical and Data Center, Durham, North Carolina
4East Carolina University, Greenville, North Carolina
5Department of Biostatistics and Bioinformatics, Duke University, Durham, North Carolina
6School of Public Health, Li Ka Shing Faculty of Medicine, The University of Hong Kong, Pok Fu Lam, Hong Kong SAR, China 7University of North Carolina, Chapel Hill, North Carolina
8University of California, San Francisco - Helen Diller Family Comprehensive Cancer Center, San Francisco, California
Keywords
Biomarker, cetuximab, colorectal cancer, plasma
Correspondence
Andrew Nixon, Department of Medicine, Division of Medical Oncology, Duke University Medical Center, 395 MSRB1, 203 Research Drive, Box 2631, Durham, NC 27710. Tel: 919 613 7883; Fax: 919 668 3925; E-mail: [email protected]
Funding Information
Research reported in this publication was supported by the National Cancer Institute of the National Institutes of Health under Award Numbers; U10CA180821, U10CA180882, CA31946, U10CA180857, and CA60138. The content of this manuscript is solely the responsibility of the authors and does not necessarily represent the official views of the National Cancer Institute.
Received: 27 January 2016; Revised: 18 May 2016; Accepted: 26 May 2016
Cancer Medicine 2016; 5(9):2249–2260
doi: 10.1002/cam4.806
Abstract
Circulating protein markers were assessed in patients with colorectal cancer (CRC) treated with cetuximab in CALGB 80203 to identify prognostic and predictive biomarkers. Patients with locally advanced or metastatic CRC received FOLFOX or FOLFIRI chemotherapy (chemo) or chemo in combination with cetuximab. Baseline plasma samples from 152 patients were analyzed for six candidate markers [epidermal growth factor (EGF), heparin- binding EGF (HBE-GF), epidermal growth factor receptor (EGFR), HER2, HER3, and CD73]. Analyte levels were associated with survival endpoints using univariate Cox proportional hazards models. Predictive markers were identified using a treatment- by- marker interaction term in the Cox model. Plasma levels of EGF, HBEGF, HER3, and CD73 were prognostic for overall survival (OS) across all patients (KRAS mutant and wild- type). High levels of EGF predicted for lack of OS benefit from ce-tuximab in KRAS wild- type (WT) patients (chemo HR = 0.98, 95% CI = 0.74– 1.29; chemo+cetuximab HR = 1.54, 95% CI = 1.05–2.25; interaction P = 0.045) and benefit from cetuximab in KRAS mutant patients (chemo HR = 1.72, 95% CI = 1.02–2.92; chemo+cetuximab HR = 0.90, 95% CI = 0.67–1.21; interaction P = 0.026). Across all patients, higher HER3 levels were associated with signifi-cant OS benefit from cetuximab treatment (chemo HR = 4.82, 95% CI = 1.68– 13.84; chemo+cetuximab HR = 0.95, 95% CI = 0.31–2.95; interaction P = 0.046). CD73 was also identified as predictive of OS benefit in KRAS WT patients (chemo HR = 1.28, 95% CI = 0.88–1.84; chemo+cetuximab HR = 0.60, 95% CI = 0.32–1.13; interaction P = 0.049). Although these results are preliminary, and confirmatory studies are necessary before clinical application, the data sug-gest that HER3 and CD73 may play important roles in the biological response to cetuximab.
Cancer Medicine
remain poor with an estimated 5- year relative survival rate of approximately 12% [1, 2]. Therapies targeting the activation and signaling of epidermal growth factor recep-tor (EGFR/HER1/ERBB1) have improved outcomes, but essentially all patients will develop treatment resistance and progress [3, 4]. Improving outcomes in these patients is predicated on refining our understanding of the rela-tionship between receptor expression and downstream signaling pathways.
EGFR is a member of the HER/ERBB family of recep-tor tyrosine kinases (RTKs) that also includes HER2/ ERBB2, HER3/ERBB3, and HER4/ERBB4. Ligand binding to the extracellular domains of these receptors results in their homo- and hetero- dimerization, leading to acti-vation of their intracellular kinase domains [5]. HER- family RTKs are activated by several ligands, including epidermal growth factor (EGF) and heparin- binding EGF (HBEGF), leading to differential activation of multiple downstream signaling pathways [6]. Hetero- dimerization between members of this RTK family provides specificity to the downstream signaling initiated by the ligands that bind these receptors, but also provides potential avenues for resistance to cetuximab, as well as other agents, that target the activity of a single member of this receptor family [7, 8].
Cetuximab is a monoclonal antibody that binds EGFR and competitively inhibits its interaction with EGF [9]. Cetuximab is associated with improved clinical outcomes in metastatic CRC (mCRC) and advanced head and neck cancer [10, 11]. The Cancer and Leukemia Group B (CALGB, now The Alliance for Clinical Trials in Oncology) 80203 trial was initiated to evaluate the efficacy of cetuxi-mab as first- line treatment of mCRC in combination with FOLFOX or FOLFIRI chemotherapy, but it was closed upon the approval of bevacizumab as first- line treatment for mCRC in 2004 and its analysis plan was redesigned as a randomized phase II trial. CALGB 80405 was sub-sequently initiated as a head- to- head comparison of beva-cizumab versus cetuximab in combination with FOLFOX or FOLFIRI chemotherapy. The clinical data of both trials have been previously reported [12, 13].
The search for predictive biomarkers for EGFR- targeting therapies has included analyses of amplifications of the EGFR gene [14], amplifications of the hepatocyte growth factor receptor (cMET) [15], genome- wide DNA methyla-tion status [16], and both candidate- based and unbiased surveys of gene transcription [17–19]. Currently, activating mutations in the RAS genes (codons 12, 13, 61, 117, and 146 of KRAS and NRAS) or BRAF codon 600 (exon 15) are the only validated biomarkers of resistance to cetuximab and other EGFR- targeting therapies in mCRC in widespread clinical use [20–23]. It is important to note that CALGB 80203 was initiated before the routine
incorporation of KRAS mutational testing. These patients were retrospectively screened for mutations in codons 12 and 13, but they have not been analyzed using the more comprehensive RAS mutation screening that is now considered standard of care [24]. Because patients with KRAS mutant (Mut) tumors are no longer treated with cetuximab this study provides access to a distinctive patient population. Recognizing the need to develop additional biomarkers that may predict for sensitivity and resistance to cetuximab, as well as prognostic markers that could guide the management of patients with mCRC, plasma and serum were collected at baseline during CALGB 80203.
Previously, we identified several prognostic and predic-tive biomarkers of benefit from cetuximab in patients enrolled in CALGB 80203 using mRNA isolated from formalin- fixed paraffin- embedded (FFPE) tumor tissue [17]. That analysis indicated that HER3 and NT5E (CD73) mRNA expression were predictive of benefit from cetuxi-mab. In this report, we have continued our analysis of CALGB 80203 and assessed the levels of EGFR- related proteins in plasma. Plasma levels of EGF, HBEGF, soluble EGFR, soluble HER2/ERBB2, soluble HER3/ERBB3, and soluble CD73 were quantified using multiplex ELISA- based methods. Blood- based biomarkers hold several advantages over fresh tumor biopsies, including reduced risks and costs, broader availability, and the ability to be monitored throughout the course of treatment. This is one of the first reports to identify prognostic and predictive blood- based biomarkers from a randomized trial using cetuximab in the first- line treatment of mCRC.
MaterialsandMethods
Samplecollection
Peripheral venous blood was collected at baseline from consenting patients into vacutainers containing EDTA anticoagulant. Samples were centrifuged at 2500g for 15 min within 30 min of collection. Plasma was aliquoted, frozen in liquid nitrogen, and shipped to the CALGB (now part of the Alliance for Clinical Trials in Oncology) Pathology Coordinating Office for centralized storage. For these analyses, samples were shipped to our laboratory (Duke/Alliance Molecular Reference Lab) thawed on ice, realiquoted, and stored at −80°C prior to use.
Studydesignandpatients
cetuximab, FOLFOX, or FOLFOX plus cetuximab treat-ment groups. This was a multicenter trial approved by the institutional review boards at each participating insti-tution, and all the patients included in the analyses reported here provided consent. Of the patients who consented but were found to be ineligible, one patient did not have colorectal cancer and the other patient had no evaluable disease. This retrospective analysis conforms to the report-ing guidelines established by the REMARK criteria.
Plasmaproteinanalysis
EGF, HBEGF, EGFR, and HER2 were analyzed using the Searchlight platform (Aushon Biosystems, Inc., Billerica, MA) following the manufacturer’s protocol. Plasma sam-ples were thawed on ice, centrifuged at 20,000g for 5 min, loaded onto SearchLight plates with standards, and incu-bated at room temperature for 1 h while shaking at 950 rpm (Lab- Line Titer Plate Shaker, Model 4625, Barnstead, Dubuque, WI). All washing steps were per-formed using a plate washer (model ELx405; Biotek Instruments, Inc., Winooski, VT). After washing, bioti-nylated secondary antibody was added, and plates were incubated for 30 min, washed, streptavidin- HRP was added, incubated for 30 min, and plates were washed again. SuperSignal substrate reagent was added after the final wash, images were collected within 10 min, and images were analyzed using SearchLight array analyst software.
HER3 and CD73 were analyzed using assays developed in our laboratory using the Meso Scale Discovery ELISA platform (Meso Scale Discovery, Rockville, MD). For HER3, ELISA plates were coated overnight with 4 μg/mL HER3 capture antibody (MAB3481; R&D Systems, Minneapolis, MN). After sample incubation, HER3 was detected using 1 μg/mL biotinylated HER3 antibody (MN BAF234; R&D Systems) and 5 μg/mL streptavidin- conjugated SulfoTag (R32AD- 5; Meso Scale Discovery). For CD73, ELISA plates were coated overnight with 3.3 μg/mL CD73 capture anti-body (550256; BD Biosciences, San Jose, CA). After sample incubation, CD73 was detected using 1 μg/mL antibody (41- 0200; Invitrogen/Life Technologies, Grand Island, NY) conjugated to MSD Sulfo- Tag according to the manufac-turer’s instructions (R91AN- 1, Meso Scale Discovery). Samples were quantified using MSD Discovery Workbench software version 3.0.18 (Meso Scale Discovery). All assays were performed in duplicate and laboratory personnel were blinded to clinical outcome.
KRASmutationalanalysis
KRAS mutation analysis was performed in the CALGB/ Alliance molecular reference laboratory of Dr. Greg
Tsongalis at Dartmouth Medical School using the TheraScreen KRAS Mutation Test Kit (870021; Qiagen, Manchester, UK).
RNAIsolation
The isolation and quantification of mRNA transcripts using real- time PCR was previously reported [17].
Statisticalanalysis
Prognostic analyses were performed using baseline data from all available patients independent of treatment arm, with continuous values for the protein analytes. All marker levels were log- transformed before analysis. Markers prog-nostic of clinical outcome (overall survival [OS] or progression- free survival [PFS]) were determined using univariate Cox [29] proportional hazards models, and the resulting hazard ratios (HR), 95% confidence intervals (CI), and P- values are reported. For each clinical outcome (OS or PFS) multivariate Cox regression models were used to test for interaction between marker level and treatment (chemo vs. chemo+cetuximab), to identify mark-ers predictive of benefit from cetuximab. To further assess the role that KRAS mutational status has on subsequent biomarker determinations, the analyses were repeated for patients with KRAS wild- type (WT) only and for KRAS Mut tumors only. Kendall’s tau coefficient [26] was used to test for correlation between plasma protein levels and tumor mRNA expression for each marker using the subset of the analysis population for which both samples were available. P- values were not adjusted for multiple testing.
Forest plots were created to depict the prognostic effect sizes (HRs and corresponding 95% CIs) of the different marker levels. For selected predictive markers, marker level was dichotomized at the median as “high” or “low”, and Kaplan–Meier [27] plots of OS or PFS were created with separate curves for each combination of treatment group and marker level.
The Alliance Statistics and Data Center conducted data collection and statistical analyses, and the clinical data were locked as of March 5, 2012. The R software envi-ronment for statistical computing and graphics [28] and the survival [25] package were used to execute the sta-tistical analyses and to generate the figures.
Results
Patientcharacteristics
for biomarker analysis from 152 of the 238 patients enrolled. The characteristics of this biomarker population reflected the characteristics of the overall study population (Table 1). As previously reported, there were no observed differences in outcomes between the groups that received FOLFOX or FOLFIRI chemotherapy, so these groups were combined into chemotherapy (chemo) alone (FOLFOX or FOLFIRI) and chemo+cetuximab groups for this analy-sis. No significant differences in the characteristics of the chemo and chemo+cetuximab groups were observed. KRAS mutational analysis was limited to the seven common mutations of the KRAS gene at codons 12 and 13. Extended RAS mutational analyses were not performed. KRAS muta-tional status was only available for 116 (76.3%) of the patients in this group. In the blood- based biomarker cohort the rate of KRAS mutation is 39.7%, slightly less than the rate of 43.0% in the parent study and 46.6% in our previous analysis of mRNA expression from FFPE samples [12, 17]. A CONSORT diagram is presented in Figure 1.
Biomarkercharacteristics
The six markers of interest were chosen based on their direct role in EGFR signaling, previous examination of mRNA levels in archived FFPE tumor samples, and the availability of high- quality assays to accurately assess each soluble marker in patient plasma. The levels of EGFR markers in blood were measured and tested for association with both OS and PFS outcomes. The
characteristics of the assayed markers are shown in Table S1. The EGFR ligands (EGF, HBEGF) were present at lower levels compared to the soluble receptors, and were observed to have higher levels of variability between patients. Baseline levels of the EGF and HBEGF ligands were positively correlated (Kendall rank correlation coef-ficient τ = 0.34), as were levels of HER2 and HER3 (τ = 0.33). No other marker pairs showed strong cor-relations (Table S2). Additionally, there was no associa-tion observed for any marker tested and KRAS mutation status (data not shown).
Prognosticmarkeranalyses
The prognostic association of protein levels with survival endpoints (PFS and OS) was examined in the overall population (Fig 2, panels A and B) as well as in the KRAS WT (Fig. 2, panels C and D) and KRAS Mut (Fig. 2, panels E and F) groups separately.
In the overall population, higher EGF protein levels were prognostic for shorter PFS (HR = 1.16, 95% CI = 1.01–1.34, P = 0.034) and OS (HR = 1.25, 95% CI = 1.09–1.45, P = 0.002) (Fig. 2, panels A and B). In the KRAS WT group, no association was observed between EGF and PFS (P = 0.482), but EGF levels showed a trend toward being prognostic for OS (HR = 1.21, 95% CI = 0.99–1.49, P = 0.068). In the KRAS Mut group, no prognostic associations were observed between EGF and PFS (P = 0.913) or OS (P = 0.596).
In the overall population, no prognostic association between HBEGF and PFS was observed (P = 0.13). For OS, higher HBEGF levels were prognostic in all patients for shorter OS (HR = 1.49, 95% CI = 1.03–2.16, P = 0.035). No prognostic association between HBEGF and PFS was observed in the KRAS WT group (P = 0.74). Higher HBEGF levels showed a trend toward being prognostic for shorter OS in KRAS WT patients (HR = 1.61, 95%
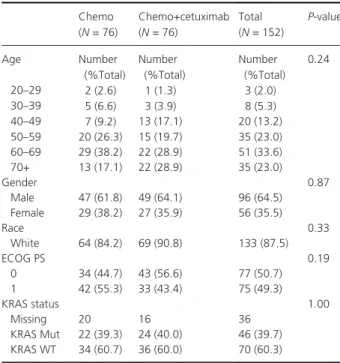
Table 1. Patient characteristics.
Chemo (N = 76)
Chemo+cetuximab (N = 76)
Total (N = 152)
P-value
Age Number
(%Total)
Number (%Total)
Number (%Total)
0.24
20–29 2 (2.6) 1 (1.3) 3 (2.0) 30–39 5 (6.6) 3 (3.9) 8 (5.3) 40–49 7 (9.2) 13 (17.1) 20 (13.2) 50–59 20 (26.3) 15 (19.7) 35 (23.0) 60–69 29 (38.2) 22 (28.9) 51 (33.6) 70+ 13 (17.1) 22 (28.9) 35 (23.0)
Gender 0.87
Male 47 (61.8) 49 (64.1) 96 (64.5) Female 29 (38.2) 27 (35.9) 56 (35.5)
Race 0.33
White 64 (84.2) 69 (90.8) 133 (87.5)
ECOG PS 0.19
0 34 (44.7) 43 (56.6) 77 (50.7) 1 42 (55.3) 33 (43.4) 75 (49.3)
KRAS status 1.00
Missing 20 16 36
KRAS Mut 22 (39.3) 24 (40.0) 46 (39.7) KRAS WT 34 (60.7) 36 (60.0) 70 (60.3)
Figure 1. Study consort diagram. Total patients
randomized to study (n = 238)
Total number of patients with plasma samples
available (n = 159)
Total patients for analysis (n = 152)
Excluded for lack of consent (n = 3) Insufficient sample (n = 2) Ineligible (n = 2)
KRAS status tested (codons 12 and 13) No Data (n = 36)
Figure 2. Prognostic forest plots showing the association of each marker with PFS (A, C, and E) or OS (B, D, and F) for all patients (A and B), KRAS
WT patients (C and D), and KRAS Mut patients (E and F).
<−Favors higher expression Favors lower expression−> 0.2 0.5 1.0 2.0 5.0 CD73
HER3 HER2 EGFR HBEGF EGF
P−value
0.5509 0.2918 0.3793 0.7309 0.1329 0.0343
<−Favors higher expression Favors lower expression−> 0.2 0.5 1.0 2.0 5.0 CD73
HER3 HER2 EGFR HBEGF EGF
P−value
0.0180 0.0415 0.3139 0.8918 0.0352 0.0020
<−Favors higher expression Favors lower expression−> 0.2 0.5 1.0 2.0 5.0 CD73
HER3 HER2 EGFR HBEGF EGF
P−value
0.8296 0.6248 0.8566 0.2806 0.7413 0.4819
<−Favors higher expression Favors lower expression−> 0.2 0.5 1.0 2.0 5.0 CD73
HER3 HER2 EGFR HBEGF EGF
P−value
0.8773 0.7916 0.3790 0.1426 0.0723 0.0680
<−Favors higher expression Favors lower expression−> 0.2 0.5 1.0 2.0 5.0 CD73
HER3 HER2 EGFR HBEGF EGF
P−value
0.7683 0.3928 0.0311 0.0019 0.4196 0.9134
<−Favors higher expression Favors lower expression−> 0.2 0.5 1.0 2.0 5.0 CD73
HER3 HER2 EGFR HBEGF EGF
P−value
0.2040 0.5716 0.5192 0.0085 0.6297 0.5961
A B
C D
CI = 0.96–2.69, P = 0.072). No prognostic associations were observed between HBEGF and PFS (P = 0.42) or OS (P = 0.63) in the KRAS Mut group.
EGFR is the direct molecular target of cetuximab and tumor levels of EGFR protein have been studied exten-sively as a potential predictive biomarker of cetuximab efficacy [29–32]. In the overall population of this study, and in the KRAS WT group, plasma levels of EGFR were not prognostic for PFS or OS. However, in KRAS Mut patients, higher EGFR levels were prognostic for both longer PFS (HR = 0.44, 95% CI = 0.26–0.74, P = 0.002) and longer OS (HR = 0.43, 95% CI = 0.23–0.80, P = 0.009).
In the overall population and in the KRAS WT group there were no prognostic associations observed between HER2 and PFS or OS. In KRAS Mut patients, higher HER2 was prognostic for longer PFS (HR = 0.40, 95% CI = 0.17–0.92, P = 0.031), but not OS (P = 0.52).
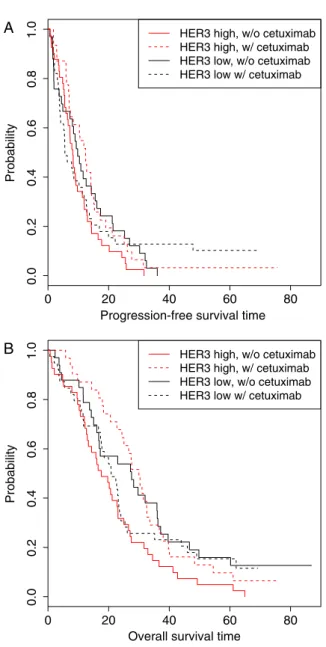
In the overall population, there was no prognostic association observed between levels of HER3 and PFS (P = 0.29). In the overall population, higher HER3 levels were prognostic for shorter OS (HR = 2.17, 95% CI = 1.03– 4.58, P = 0.042). In the KRAS WT and KRAS Mut groups, there was no prognostic association observed between HER3 and PFS or OS.
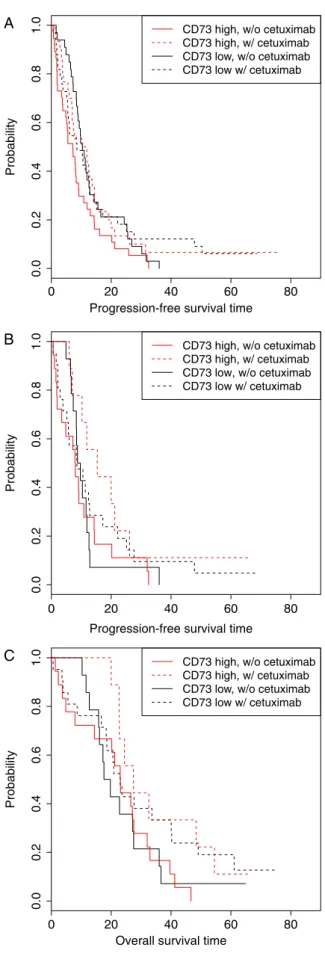
CD73 has been implicated as a potential predictive biomarker for cetuximab in several reports, including our previous analysis of mRNA expression in FFPE samples from CALGB 80203 [17, 18]. In the current analysis, in the overall population higher plasma CD73 was prognostic for shorter OS (HR = 1.26, 95% CI = 1.04–1.52, P = 0.018). No additional prognostic associations between CD73 with PFS or OS were observed in the overall population or in the KRAS groups. All prognostic analyses for each marker are presented in Table S3.
Predictivemarkeranalyses
In the overall population, EGF protein levels were not predictive of PFS (interaction P = 0.233) or OS (interac-tion P = 0.748) benefit from cetuximab, but EGF levels were predictive within the individual KRAS groups. In the KRAS WT group, low EGF levels were predictive of OS benefit from cetuximab (chemo HR = 0.98, 95% CI = 0.74–1.29; chemo+cetuximab HR = 1.54, 95% CI = 1.05–2.25; interaction P = 0.045) (Fig. 3, panel A). In the KRAS Mut group, high EGF was predictive of benefit from cetuximab in both PFS (chemo HR = 2.16, 95% CI = 1.29–3.63; chemo+cetuximab HR = 0.76, 95% CI = 0.56–1.03; interaction P = 0.001) and OS (chemo HR = 1.72, 95% CI = 1.02–2.92; chemo+cetuximab
HR = 0.90, 95% CI = 0.67–1.21; interaction P = 0.026) (Fig. 3, panels B and C).
Levels of HBEGF, EGFR, and HER2 were not predictive for either PFS or OS in the overall population or in either of the KRAS subgroups.
In the overall population, levels of HER3 were predic-tive for both PFS (chemo HR = 3.90, 95% CI = 1.41–10.80; chemo+cetuximab HR = 0.66, 95% CI = 0.25–1.78; inter-action P = 0.032) and OS (chemo HR = 4.82, 95% CI = 1.68–13.84; chemo+cetuximab HR = 0.95, 95% CI = 0.31–2.95; interaction P = 0.046) (Fig. 4, panels A and B). It should be noted that the predictive role of HER3 was sensitive to the presence of an outlier with an extremely high level of plasma HER3. When this patient was removed from the analysis, HER3 was no longer predictive at P = 0.05, but the trends remained (PFS interaction P = 0.098, OS interaction P = 0.128). Interestingly, this patient did not have extreme values for any of the other markers examined, indicating that the high HER3 levels were unlikely due to preanalytic issues, such as sample handling, and may reflect the true levels of HER3 within this patient.
In the overall population, CD73 levels were predictive of PFS benefit across all patients (chemo HR = 1.38, 95% CI = 1.08–1.77; chemo+cetuximab HR = 0.84, 95% CI = 0.63–1.12; interaction P = 0.018) (Fig. 5, panel A), but there was no predictive association observed between CD73 protein levels and OS. In the KRAS WT group, CD73 levels were predictive of PFS benefit from cetuximab (chemo HR = 1.32, 95% CI = 0.92–1.90; chemo+cetuximab HR = 0.61, 95% CI = 0.36–1.04; interaction P = 0.017) (Fig. 5, panel B) and OS benefit from cetuximab (chemo HR = 1.28, 95% CI = 0.88–1.84; chemo+cetuximab HR = 0.60, 95% CI = 0.32–1.13; interaction P = 0.049) (Fig. 5, panel C). No predictive effects for CD73 were observed in KRAS Mut patients.
Comparisonofplasmaproteinsandtumor mRNAexpression
protein levels and tumor mRNA expression levels. However, plasma HER3 protein and tumor HER3 mRNA expression were modestly correlated with one another (τ = 0.22, P = 0.010).
Figure 3. Kaplan–Meier curves showing the effects of EGF level and treatment arm. (A) OS KRAS WT patients (interaction P = 0.045); (B) PFS in KRAS Mut patients (interaction P = 0.001); (C) OS in KRAS Mut patients (interaction P = 0.026). High and low marker levels are dichotomized at the median. OS, overall survival; PFS, progression- free survival; EGF, epidermal growth factor.
0 20 40 60 80
0.0
0.2
0.4
0.6
0.8
1.0
Overall survival time
Probability
EGF high, w/o cetuximab EGF high, w/ cetuximab EGF low, w/o cetuximab EGF low w/ cetuximab A
0 20 40 60 80
0.
00
.2
0.4
0.6
0.8
1.0
Progression−free survival time
Probability
EGF high, w/o cetuximab EGF high, w/ cetuximab EGF low, w/o cetuximab EGF low w/ cetuximab B
0 20 40 60 80
0.
00
.2
0.
40
.6
0.
81
.0
Overall survival time
Probabilit
y
EGF high, w/o cetuximab EGF high, w/ cetuximab EGF low, w/o cetuximab EGF low w/ cetuximab C
Figure 4. Kaplan–Meier curves showing the effects of HER3 level and treatment arm. (A) PFS in all patients (interaction P = 0.032); (B) OS in all patients (interaction P = 0.046). High and low marker levels are dichotomized at the median. OS, overall survival; PFS, progression- free survival.
0 20 40 60 80
0.0
0.2
0.4
0.6
0.8
1.0
Progression-free survival time
Probability
HER3 high, w/o cetuximab HER3 high, w/ cetuximab HER3 low, w/o cetuximab HER3 low w/ cetuximab A
0 20 40 60 80
0.0
0.2
0.4
0.6
0.8
1.0
Overall survival time
Probabilit
y
Discussion
Mutations in KRAS, and more recently NRAS and BRAF, are the only biomarkers regularly used for guiding the use of cetuximab in CRC and additional biomarkers are desperately needed. CALGB 80203 was initiated to evaluate cextuximab with FOLFOX or FOLFIRI chemotherapy in the first- line setting, but was closed due to slow enroll-ment and the approval of bevacizumab as first- line therapy for CRC. After closure of CALGB 80203, a new intergroup study was initiated to directly compare the efficacy of cetuximab versus bevacizumab in mCRC. In CALGB 80405 patients were randomized to receive standard chemotherapy with either bevacizumab (which targets vascular endothelial growth factor) or cetuximab in the first- line setting. As reported at ASCO in 2014, CALGB 80405 did not identify any significant PFS or OS differences between the beva-cizumab and cetuximab cohorts in RAS WT patients [33, 34]. These results underscore the need to identify bio-markers beyond RAS that can select for patients who are most likely to benefit from cetuximab, as well as other targeted agents.
To identify biomarkers for cetuximab in mCRC, we assayed plasma levels of six proteins in patients that were either directly associated with the EGFR signaling pathway or previously implicated as potential biomarkers for cetuxi-mab. Many of the evaluated proteins have been previously suggested as potential prognostic biomarkers; however, very few studies have evaluated the soluble levels of these proteins in patient plasma. While it is established that EGFR tumor levels are prognostic using immunohisto-chemical approaches [35, 36], other readouts, including EGFR mRNA expression and copy number, are less con-sistent [17, 37]. In the overall population, plasma EGF was prognostic for both OS and PFS, contradicting other observations from serum measurements of colon cancer patients [38]. However, differences could be due to the unknown KRAS status for patients in this earlier work or could reflect biological differences in plasma versus serum EGF levels. Interestingly, we observed that EGFR and HER2 were only prognostic in the KRAS Mut popu-lation. However, for HER3, we observed that levels were prognostic for OS across all patients, but when analyzed based on KRAS mutational status, no associations were observed. In fact, no markers were prognostic within the KRAS WT group. While the impact of KRAS mutations on soluble HER receptors and ligand levels and their role
Figure 5. Kaplan–Meier curves showing the effects of CD73 level and treatment arm. (A) PFS in all patients (interaction P = 0.018); (B) PFS in
KRAS WT patients (interaction P = 0.017); (C) OS in KRAS WT patients (interaction P = 0.049). High and low marker levels are dichotomized at the median. OS, overall survival; PFS, progression- free survival.
0 20 40 60 80
0.0
0.2
0.4
0.6
0.8
1.0
Progression-free survival time
Probability
CD73 high, w/o cetuximab CD73 high, w/ cetuximab CD73 low, w/o cetuximab CD73 low w/ cetuximab A
0 20 40 60 80
0.0
0.2
0.4
0.6
0.8
1.0
Progression-free survival time
Probability
CD73 high, w/o cetuximab CD73 high, w/ cetuximab CD73 low, w/o cetuximab CD73 low w/ cetuximab B
0 20 40 60 80
0.0
0.2
0.4
0.6
0.8
1.0
Overall survival time
Probabilit
y
as prognostic factors remain unclear, no associations were observed between marker levels and KRAS mutation status in this study.
Protease- mediated shedding is important for the pro-cessing of membrane- associated ligands and has been implicated in the regulation of EGFR levels [39–42]. Because soluble EGFR is competent to bind EGF [41], high levels of soluble receptors may act as ligand sinks that down-regulate signaling through the EGFR pathway by reducing both the amount of free ligand and the amount of cell- surface receptors. Downregulation of HER3 protein on tumor cells is expected to improve outcomes from cetuxi-mab therapy by reducing compensatory signaling through HER3- containing heterodimers. Increased HER3 protein in patient plasma could reflect a process of active shed-ding as part of a homeostatic response to increased HER- axis signaling that may play a role in tumorigenesis. Strategies inhibiting hetero- dimerization between HER3 and other HER family receptors have been promising [43–45], and targeting HER3 directly in a preclinical model has been effective in overcoming acquired resistance to cetuximab [46].
This study provides data consistent with a model in which HER3 mediating resistance to cetuximab. HER3 shedding may suggest down-regulation of this resistance pathway. In this study, plasma protein levels of HER3, measured by ELISA, and HER3 mRNA from FFPE tumor tissue, measured using real- time PCR, were found to be modestly correlated with each other (τ= 0.22, P = 0.010). However, these comparisons should be considered highly exploratory because not only were different methods used, tumor protein was not analyzed, and all tumor mRNA samples were isolated from the surgical resection of the primary tumor, which often occurred years before the collection of plasma on this trial.
CD73 is an extracellular 5’ ectonucleotidase that func-tions with CD39 (ecto- ATPase), adenosine kinase (AK; phosphorylation to form AMP), and adenosine deaminase (ADA; deamination to inosine) to convert proinflamma-tory extracellular ATP to anti- inflammatory adenosine. The effects of extracellular adenosine on T- cell function and the emerging role of CD73 and purinergic signaling in cancer immunotherapy have been reviewed elsewhere [47–49]. Inhibition of CD73 enhances the effects of immune checkpoint inhibitors in a preclinical model fur-ther supporting a role for CD73 in suppression of anti-tumor immune responses [50]. CD73 is expressed on lymphocytes and endothelial cells and mature CD73 is linked to the extracellular surface by a glycosyl phos-phatidyl inositol anchor. The mechanism by which CD73 is released into the plasma remains to be studied, but higher levels of CD73 may reflect a mechanism of active shedding to regulate the immune- modulatory effects of
CD73 on lymphocytes and other immune cell populations.
While intriguing, there are several limitations to the findings of this study. While CALGB 80203 was randomized, the number of available samples was limited and the cur-rent biomarker analyses were developed retrospectively after completion of the study. The markers included in this study provide a cross section of factors related to EGFR/ HER- family signaling that includes both ligands and soluble receptors. Acknowledging the high number of factors capable of signaling through the EGFR/HER- family of receptors, additional studies are required to comprehensively inves-tigate the levels of all potential ligands as potential predic-tive biomarkers for EGFR- targeting therapies in CRC. Lastly, there are several characteristics of CALGB 80203 that make this study unique, most interesting being that KRAS muta-tion status was not independently predictive of benefit from cetuximab. Additionally, the P- values reported here have not been adjusted for multiple testing so conclusions must be considered preliminary and hypothesis generating.
In conclusion, we have identified several potential blood- based, predictive, protein biomarkers of benefit from cetuximab in mCRC. Though these results should be considered preliminary, and further validation is required before any clinical application of these results, they provide further evidence supporting HER3- targeting therapeutic strategies and implicate immune modulation as an impor-tant factor in the response to cetuximab. These results deserve further study and analyses of these markers in CALGB 80405 are currently ongoing.
Acknowledgments
Research reported in this publication was supported by the National Cancer Institute of the National Institutes of Health under Award Numbers; U10CA180821, U10CA180882, CA31946, CA33601, CA47577, and CA60138. The content of this manuscript is solely the responsibility of the authors and does not necessarily represent the official views of the National Cancer Institute. We gratefully acknowledge the invaluable contributions of the patients, their families and the all the investigators who participated in this trial, particularly Robert J. Mayer, at the Dana- Farber Cancer Institute, Boston, MA for accruing the most patients to this study.
ClinicalTrial.gov
A Phase II Trial Of Irinotecan/5- FU/Leucovorin Or
Oxaliplatin/5- FU/Leucovorin With And Without
ConflictofInterest
ABN has received research funding from Amgen (Inst), Pfizer (Inst), Incyte (Inst), and Tracon Pharmaceuticals (Inst); has received consultant/advisory compensation from Novartis, Pfizer, and Cerulean Pharma; and has pending patents. AP has received research funding from Bayer AG (Inst), Onyx Pharmaceuticals (Inst), Genentech (Inst), GlaxoSmithKline (Inst), Eli Lilly (Inst) and Bristol Meyers Squibb (Inst); and has received consultant/advisory com-pensation from Gilead Sciences. HIH has received research funding from Incyte (Inst), Genentech (Inst), Novartis (Inst), GlaxoSmithKline (Inst), and Tracon Pharmaceuticals (Inst); has received consultant/advisory compensation from Incyte, Novartis, Genentech, Bristol- Myers Squibb, Eli Lilly, Amgen, Sanofi, Regeneron Pharmaceuticals, GlaxoSmithKline, Tracon Pharmaceuticals, Acceleron Pharma and Bayer AG; honoraria from Genentech and ImClone Systems; and has pending patents. AJH, ABS, CJ, and KO disclose pending patents related to this work. MDS, JCS, JJ, DLB, HP, DN, and FI declare that they have no conflicts of interest to disclose.
References
1. Jemal, A., R. Siegel, J. Xu, and E. Ward. 2010. Cancer Statistics, 2010. CA Cancer J. Clin. 60:277–300. 2. Edwards, B. K., A.-M. Noone, A. B. Mariotto, E. P.
Simard, F. P. Boscoe, S. J. Henley, et al. 2014. Annual Report to the Nation on the status of cancer, 1975- 2010, featuring prevalence of comorbidity and impact on survival among persons with lung, colorectal, breast, or prostate cancer. Cancer 120:1290–1314.
3. Pietrantonio, F., C. Cremolini, F. Petrelli, M. Di Bartolomeo, F. Loupakis, C. Maggi, et al. 2015. First- line anti- EGFR monoclonal antibodies in panRAS wild- type metastatic colorectal cancer: a systematic review and meta- analysis. Crit. Rev. Oncol./Hematol. 96:156–166. 4. Lee, M. S., and S. Kopetz. 2015. Current and future
approaches to target the epidermal growth factor receptor and its downstream signaling in metastatic colorectal cancer. Clin. Colorectal Cancer 14:203–218. 5. Arteaga, C. L., and J. A. Engelman. 2014. ERBB
receptors: from oncogene discovery to basic science to mechanism- based cancer therapeutics. Cancer Cell 25:282–303.
6. Wilson, K. J., J. L. Gilmore, J. Foley, M. A. Lemmon, and D. J. 2nd Riese. 2009. Functional selectivity of EGF family peptide growth factors: implications for cancer. Pharmacol. Ther. 122:1–8.
7. Olayioye, M. A., R. M. Neve, H. A. Lane, and N. E. Hynes. 2000. The ErbB signaling network: receptor heterodimerization in development and cancer. EMBO J. 19:3159–3167.
8. Hynes, N. E., and H. A. Lane. 2005. ERBB receptors and cancer: the complexity of targeted inhibitors. Nat. Rev. Cancer 5:341–354.
9. Goldstein, N. I., M. Prewett, K. Zuklys, P. Rockwell, and J. Mendelsohn. 1995. Biological efficacy of a chimeric antibody to the epidermal growth factor receptor in a human tumor xenograft model. Clin. Cancer Res. 1:1311–1318.
10. Bonner, J. A., P. M. Harari, J. Giralt, N. Azarnia, D. M. Shin, R. B. Cohen, et al. 2006. Radiotherapy plus cetuximab for squamous- cell carcinoma of the head and neck. N. Engl. J. Med. 354:567–578.
11. Cunningham, D., Y. Humblet, S. Siena, D. Khayat, H. Bleiberg, A. Santoro, et al. 2004. Cetuximab
monotherapy and cetuximab plus irinotecan in irinotecan- refractory metastatic colorectal cancer. N. Engl. J. Med. 351:337–345.
12. Venook, A., D. Niedzwiecki, D. Hollis, S. Sutherland, R. Goldberg, S. Alberts, et al. 2006. Phase III study of irinotecan/5FU/LV (FOLFIRI) or oxaliplatin/5FU/LV (FOLFOX) ± cetuximab for patients (pts) with untreated metastatic adenocarcinoma of the colon or rectum (MCRC): CALGB 80203 preliminary results. J. Clin. Oncol. 24(18S):abstr 3509.
13. Venook, A. P., D. Niedzwiecki, H. J. Lenz, F. Innocenti, M. Mahoney, B. H. O’Neil, et al. 2014. CALGB/SWOG 80405: Phase III trial of irinotecan/5- FU/leucovorin (FOLFIRI) or oxaliplatin/5- FU/leucovorin (mFOLFOX6) with bevacizumab (BV) or cetuximab (CET) for patients (pts) with KRAS wild- type (wt) untreated metastatic adenocarcinoma of the colon or rectum (MCRC). Journal Clin. Oncol. 32(suppl):000.; abstr LBA3. 14. Jiang, Z., C. Li, F. Li, and X. Wang. 2013. EGFR gene
copy number as a prognostic marker in colorectal cancer patients treated with cetuximab or panitumumab: a systematic review and meta analysis. PLoS ONE 8:e56205.
15. Liska, D., C. T. Chen, T. Bachleitner-Hofmann, J. G. Christensen, and M. R. Weiser. 2011. HGF rescues colorectal cancer cells from EGFR inhibition via MET activation. Clin. Cancer Res. 17:472–482.
16. Ouchi, K., S. Takahashi, Y. Yamada, S. Tsuji, K. Tatsuno, H. Takahashi, et al. 2015. DNA methylation status as a biomarker of anti- epidermal growth factor receptor treatment for metastatic colorectal cancer. Cancer Sci. 106:1722–1729.
17. Cushman, S. M., C. Jiang, A. J. Hatch, I. Shterev, A. B. Sibley, D. Niedzwiecki, et al. 2015. Gene expression markers of efficacy and resistance to cetuximab treatment in metastatic colorectal cancer: results from CALGB 80203 (Alliance). Clin. Cancer Res.
21:1078–1086.
epiregulin and amphiregulin and K- ras mutation status predict disease control in metastatic colorectal cancer patients treated with cetuximab. J. Clin. Oncol. 25:3230–3237.
19. Khambata-Ford, S., C. T. Harbison, L. L. Hart, M. Awad, L. A. Xu, C. E. Horak, et al. 2010. Analysis of potential predictive markers of cetuximab benefit in BMS099, a phase III study of cetuximab and first- line taxane/carboplatin in advanced non- small- cell lung cancer. J. Clin. Oncol. 28:918–927.
20. Amado, R. G., M. Wolf, M. Peeters, E. Van Cutsem, S. Siena, D. J. Freeman, et al. 2008. Wild- type KRAS is required for panitumumab efficacy in patients with metastatic colorectal cancer. J. Clin. Oncol. 26:1626–1634.
21. Douillard, J. Y., K. S. Oliner, S. Siena, J. Tabernero, R. Burkes, M. Barugel, et al. 2013. Panitumumab- FOLFOX4 treatment and RAS mutations in colorectal cancer. N. Engl. J. Med. 369:1023–1034.
22. Karapetis, C. S., S. Khambata-Ford, D. J. Jonker, C. J. O’Callaghan, D. Tu, N. C. Tebbutt, et al. 2008. K- ras mutations and benefit from cetuximab in advanced colorectal cancer. N. Engl. J. Med. 359:1757–1765.
23. Van Cutsem, E., C. H. Kohne, E. Hitre, J. Zaluski, C. R. Chang Chien, A. Makhson, et al. 2009. Cetuximab and chemotherapy as initial treatment for metastatic colorectal cancer. N. Engl. J. Med. 360:1408–1417. 24. Hecht, J. R., J. Y. Douillard, L. Schwartzberg, A.
Grothey, S. Kopetz, A. Rong, et al. 2015. Extended RAS analysis for anti- epidermal growth factor therapy in patients with metastatic colorectal cancer. Cancer Treat. Rev. 000:000.
25. Therneau, T. M., and P. M. Grambsch. 2000. Modeling Survival Data: Extending the Cox Model. Springer, New York. ISBN 0-387-98784-3
26. Kendall, M. G. 1938. A new measure of rank correlation. Biometrika 30(1–2):81–93.
27. Hollander, M., D. A. Wolfe, and E. Chicken. 2014. P 819 Nonparametric statistical methods, 3rd ed. John Wiley & Sons, Inc., Hoboken, New Jersey.
28. R Core Team: A language and environment for statistical computing Vienna, Austria 2014 Available at: http://www.R-project.org/ (accessed October 31 2014 29. Finocchiaro, G., F. Cappuzzo, P. A. Janne, K.
Bencardino, C. Carnaghi, W. A. Franklin, et al. 2007. EGFR, HER2 and Kras as predictive factors for cetuximab sensitivity in colorectal cancer. ASCO Meeting Abstracts.;25(18_suppl):4021.
30. Chung, K. Y., J. Shia, N. E. Kemeny, M. Shah, G. K. Schwartz, A. Tse, et al. 2005. Cetuximab shows activity in colorectal cancer patients with tumors that do not express the epidermal growth factor receptor by immunohistochemistry. J. Clin. Oncol. 23:1803–1810.
31. Lenz, H. J., E. Van Cutsem, S. Khambata-Ford, R. J. Mayer, P. Gold, P. Stella, et al. 2006. Multicenter phase II and translational study of cetuximab in metastatic colorectal carcinoma refractory to irinotecan, oxaliplatin, and fluoropyrimidines. J. Clin. Oncol. 24:4914–4921. 32. Licitra, L., S. Storkel, K. M. Kerr, E. Van Cutsem, R.
Pirker, F. R. Hirsch, et al. 2013. Predictive value of epidermal growth factor receptor expression for first- line chemotherapy plus cetuximab in patients with head and neck and colorectal cancer: analysis of data from the EXTREME and CRYSTAL studies. Eur. J. Cancer 49:1161–1168.
33. Lenz, H., D. Niedzwiecki, F. Innocenti, C. Blanke, M. R. Mahony, B. H. O’Neil, et al. 2014. CALGB/SWOG 80405: phase III trial of irinotecan/5- FU/leucovorin (FOLFIRI) or Oxaliplatin/5- FU/leucovorin (MFOLFOX6) with bevacizumab (BV) or cetuximab (CET) for patients (PTS) with expanded RAS analyses untreated metastatic adenocarcinoma of the colon or rectum (MCRC). Ann. Oncol. 25(suppl 4):501O.
34. Venook, A. P., D. Niedzwiecki, H.-J. Lenz, F. Innocenti, M. R. Mahoney, B. H. O’Neil, et al. 2014. CALGB/ SWOG 80405: Phase III trial of irinotecan/5-FU/ leucovorin (FOLFIRI) or oxaliplatin/5-FU/leucovorin (mFOLFOX6) with bevacizumab (BV) or cetuximab (CET) for patients (pts) with KRAS wild-type (wt) untreated metastatic adenocarcinoma of the colon or rectum (MCRC). ASCO Meeting Abstracts
32(15_suppl):LBA3.
35. Goos, J. A., A. C. Hiemstra, V. M. Coupe, B. Diosdado, W. Kooijman, P. M. Delis-Van Diemen, et al. 2014. Epidermal growth factor receptor (EGFR) and prostaglandin- endoperoxide synthase 2 (PTGS2) are prognostic biomarkers for patients with resected colorectal cancer liver metastases. Br. J. Cancer 111:749–755. 36. Rokita, M., R. Stec, L. Bodnar, R. Charkiewicz, J.
Korniluk, M. Smoter, et al. 2013. Overexpression of epidermal growth factor receptor as a prognostic factor in colorectal cancer on the basis of the Allred scoring system. OncoTargets and therapy 6:967–976.
37. Huang, C. W., H. L. Tsai, Y. T. Chen, C. M. Huang, C. J. Ma, C. Y. Lu, et al. 2013. The prognostic values of EGFR expression and KRAS mutation in patients with synchronous or metachronous metastatic colorectal cancer. BMC Cancer 13:599.
38. Lee, W. S., J. H. Baek, D. H. You, and M. J. Nam. 2013. Prognostic value of circulating cytokines for stage III colon cancer. J. Surg. Res. 182:49–54.
40. Adamczyk, K. A., S. Klein-Scory, M. M. Tehrani, U. Warnken, W. Schmiegel, M. Schnolzer, et al. 2011. Characterization of soluble and exosomal forms of the EGFR released from pancreatic cancer cells. Life Sci. 89(9–10):304–312.
41. Wilken, J. A., M. Perez-Torres, R. Nieves-Alicea, E. M. Cora, T. A. Christensen, A. T. Baron, et al. 2013. Shedding of soluble epidermal growth factor receptor (sEGFR) is mediated by a metalloprotease/fibronectin/integrin axis and inhibited by cetuximab. Biochemistry 52:4531–4540. 42. Schneider, M. R., and E. Wolf. 2009. The epidermal
growth factor receptor ligands at a glance. J. Cell. Physiol. 218:460–466.
43. Swain, S. M., J. Baselga, S. B. Kim, J. Ro, V. Semiglazov, M. Campone, et al. 2015. Pertuzumab, trastuzumab, and docetaxel in HER2- positive metastatic breast cancer. N. Engl. J. Med. 372:724–734.
44. Garrett, J. T., C. R. Sutton, R. Kurupi, C. U. Bialucha, S. A. Ettenberg, S. D. Collins, et al. 2013. Combination of antibody that inhibits ligand- independent HER3 dimerization and a p110alpha inhibitor potently blocks PI3K signaling and growth of HER2 + breast cancers. Cancer Res. 73:6013–6023.
45. Jiang, N., D. Wang, Z. Hu, H. J. Shin, G. Qian, M. A. Rahman, et al. 2014. Combination of anti- HER3 antibody MM- 121/SAR256212 and cetuximab inhibits tumor growth in preclinical models of head and neck squamous cell carcinoma. Mol. Cancer Ther.
13:1826–1836.
46. Iida, M., T. M. Brand, M. M. Starr, E. J. Huppert, N. Luthar, H. Bahrar, et al. 2014. Overcoming acquired resistance to cetuximab by dual targeting HER family receptors with antibody- based therapy. Mol. Cancer. 13:242.
47. Pardoll, D. M. 2012. The blockade of immune
checkpoints in cancer immunotherapy. Nat. Rev. Cancer 12:252–264.
48. Fridman, W. H., F. Pages, C. Sautes-Fridman, and J. Galon. 2012. The immune contexture in human tumours: impact on clinical outcome. Nat. Rev. Cancer 12:298–306.
49. Zhang, B. 2010. CD73: a novel target for cancer immunotherapy. Cancer Res. 70:6407–6411.
50. Allard, B., S. Pommey, M. J. Smyth, and J. Stagg. 2013. Targeting CD73 enhances the antitumor activity of anti- PD- 1 and anti- CTLA- 4 mAbs. Clin. Cancer Res. 19:5626–5635.
SupportingInformation
Additional supporting information may be found in the online version of this article:
Table S1. Marker properties.
Table S2. Kendall’s Tau correlation coefficients for each plasma marker analyzed.