APPLICATION OF SMALL MOLECULE RECEPTORS TO THE ANALYSIS OF POST-TRANSLATIONAL MODIFICATIONS USING FLUORESCENT INDICATOR
DISPLACEMENT ASSAYS.
Brendan Carroll Peacor
A dissertation submitted to the faculty at the University of North Carolina at Chapel Hill in partial fulfillment of the requirements for the degree of Doctor of Philosophy in the Department
of Chemistry (Organic) in the College of Arts and Sciences
Chapel Hill 2015
ii © 2015
iii ABSTRACT
Brendan Carroll Peacor: Application of Small Molecule Receptors to the Analysis of Post-translational Modifications Using Fluorescent Indicator Displacement Assays
(Under the direction of Marcey Waters)
This dissertation focuses on the application of small molecule receptors to a fluorescent assay for the study of histone post-translational modifications, both in real-time enzyme
reactions and endpoint characterization of analytes. In the first section, dynamic combinatorial chemistry was used to generate a series of A2X receptors that varied the functionality of the X monomer. This allowed us to systematically study the contribution of pocket depth and
electrostatic interactions on binding methylated lysine. We discovered that changing the location of a carboxylate increased affinity to K(Me)2, presumably through a salt bridge, while an
additional carboxylate increased affinity across the entire lysine series. Additionally, formation of a deeper binding pocket saw a selectivity increase for K(Me)3 over the lower methylation
states.
The remaining sections describe the application of the Waters lab suite of receptors to fluorescence indicator displacement assays (IDAs). In these assays, fluorescence signal is
directly proportional to the competitive binding of a histone analyte. We applied a sensor system using the receptor A2N and the fluorophore Lucigenin (LCG) to study the enzymatic
iv
enzymatic activity, allowing future experiments to test enzyme response to neighboring
modifications in the ‘histone code’. This assay was also applied to the preliminary examination of the arginine methyltransferases, demonstrating the general applicability of the assay to the full range of enzymatic methylation reactions.
With the large number of receptors previously established, we sought to develop a general discriminatory assay capable of recognizing histone modifications beyond the designed scope of the sensor. By combining the fluorescent IDA signal for four different receptors, A2B, A2D, A2N, and A2G, we were able to accurately classify thirteen different histone peptides in a single output. Each peptide had multiple modifications, including arginine methylation and lysine methylation, as well as lysine methylation and threonine phosphorylation. The
classification assay was able to distinguish both the degree of modification as well as the site of the specific modifications, all based on the slight perturbations neighboring residues make on binding affinity. This assay was also preliminarily applied to the sensing of complex enzymatic reactions by performing a mock kinase experiment, in which we were able to classify distinct ‘time-point’ of enzymatic phosphorylation on two separate substrates.
v
ACKNOWLEDGEMENTS
First I would like to thank Marcey Waters for your inspiration and mentorship over the last five years. You have allowed me to explore interesting science, even when it started us down an entirely new, and sometimes only slightly related path. You always answered my questions and had your own that challenged me to think of new solutions and ideas to try. I am so
appreciative of the environment you have created in this lab, these five years have flown by in a supremely enjoyable and enriching way.
I would also like to thank my other committee members, Jeff Johnson, David Lawrence, Kevin Weeks, and Stephen Frye, as well as Mike Gagné who served on my orals committee. Your guidance and insight over the past several years has been extremely helpful and is very much appreciated.
Many thanks go out to the excellent collaborators I have been privileged to work with. Sam Pattenden and Jacqueline Norris-Drouin, your aid with G9a and in answering my general biology questions has been instrumental in getting these projects off the ground, thank you very much. Scott Rothbart, thank you for your help with the PRMT expression, and a special thanks to Brian Strahl for allowing me to use your lab space and radioactive assay.
vi
our receptor project. Masa, our conversations, both about science and the world in general have been supreme. The random weekend emails about comet landers and your general enthusiasm is awesome. Thank you Derek for all your help, both in lab and outside of it, looking forward to many more board game nights in the future. Amber and Effie, thanks for all your help, from running the peptide synthesizer to helping me figure out how to order proteins. To Kai, Jes, and Natalie, you have been wonderful to work with and get to know. Finally a special thanks to Chris Ramsay. Your work over the last two years was key to the success of the neutral histone code project.
vii
TABLE OF CONTENTS
LIST OF TABLES ... xii
LIST OF FIGURES ... xiii
LIST OF ABBREVIATIONS ... xxiii
Structure Function Study of A2X ... 1
Background ... 1
Ordered Structure of DNA ... 1
Post-translational Modifications ... 3
Lysine Methylation ... 4
Non-covalent Binding of Methylated Lysine ... 8
Small Molecule Receptors for Trimethyl Lysine... 12
Dynamic Combinatorial Chemistry ... 13
Motivation ... 16
Results ... 17
Dynamic Combinatorial Libraries ... 17
Investigation of Receptors with Varied Electrostatic Interactions ... 22
Investigation of Receptors with Deeper Binding Pockets ... 25
viii
Experimental ... 29
Peptide Synthesis ... 29
DCC Libraries ... 30
Preparative Synthesis of A2E ... 31
Extinction Coefficient Determination ... 33
Isothermal Titration Calorimetry Binding Experiments ... 34
REFERENCES ... 39
Fluorescence Assay for Enzymatic Methylation of Histone Peptides ... 42
Introduction ... 42
Background ... 43
Protein Lysine Methyltransferases (PKMTs) ... 43
Protein Arginine Methyltransferases (PRMTs). ... 47
Methylation Assays ... 50
Project Motivation ... 56
Lysine Methyltransferase Assay ... 58
Fluorophore Screening ... 58
Acridine Orange/A2B Sensor ... 62
Lucigenin (LCG) Sensor ... 65
Arginine Methyltransferase Assay ... 81
ix
A2D/LCG Methylated Arginine Peptide Displacement ... 82
PRMT1 Radioactive Activity Assay ... 83
Experimental ... 84
Peptide Synthesis ... 84
Fluorescence quenching ... 85
Peptide Fluorescence Displacement Experiments ... 87
Cuvette fluorescence assay ... 87
Radioactive SAM assay ... 90
Cuvette based enzyme assay ... 91
REFERENCES ... 92
Fingerprint Sensor Array for Combinatorial Histone Modifications ... 95
Introduction ... 95
Background ... 96
The Histone Code ... 96
Tools for Studying the Histone Code... 97
Sensor Arrays ... 98
Motivation ... 102
Results ... 103
Sensor Test With Short H3 Mimic Peptides. ... 103
x
Sensor Array of Single PTMs ... 113
Sensor Array for Peptides with Multiple Methylation ... 115
Sensor Array for Peptides with Neighboring Phosphorylation... 117
Combined Sensor Array Output... 119
Application of the Sensor Array to Enzymatic Reactions... 121
Experimental ... 125
Peptide Synthesis ... 125
Receptor Fluorescence Titration ... 125
96-well Sensor Array ... 126
384-well Sensor Array ... 126
Mock Enzyme Sensor Array ... 126
Linear Discriminate Analysis ... 127
Sensor Array Statistical Validation ... 127
REFERENCES ... 129
Fingerprint Sensor Array for Neutral Histone Modifications ... 131
Background and Motivation ... 131
Lysine Acetylation ... 131
Lysine Deacetylation ... 132
Arginine Deimination ... 134
xi
Results ... 137
Single Sensor Citrulline Displacement ... 137
Citrulline Sensor Array ... 139
Lysine Acetylation Sensor Array ... 141
Histone Neutralization Sensor Array ... 145
Future Directions ... 146
Experimental ... 152
Peptide Synthesis ... 152
Receptor Fluorescence Titration ... 152
Peptide Fluorescence Displacement Experiments ... 153
384-well Sensor Array ... 153
Linear Discriminate Analysis ... 153
xii
LIST OF TABLES
Table 1.1 Thermodynamic binding data obtained for binding of A2B, A2C, and A2E to
Ac-WGGG-QTARK(Me)nSTG-NH2 as measured by ITC.a ... 23
Table 1.2 Thermodynamic binding data obtained for binding of A2N and A2E to Ac-WGGG-QTARK(Me)nSTG-NH2 as measured by ITC.a ... 27
Table 1.3 Thermodynamic binding data obtained for binding of the receptors to Ac-WGGG-QTARK(Me)nSTG-NH2 as measured by ITC.a ... 34
Table 2.1 Binding affinity of A2B, A2D, and A2N for methylated lysine measured by ITC. ... 57
Table 2.2. Binding data for A2B, A2D, and A2N with Lucigenin (5 µM)... 67
Table 2.3 Buffer identities for the radioactive methylation of H3 1-20 by G9a ... 72
Table 2.4 Binding affinities of A2D for the H3 tail peptide Ac-YGG-QTAR(Me)nSTG- NH2 in 10 mM Na2HPO4 pH 8.0. Dimethyl arginine is shown in one of two forms, symmetric (sRMe2) or asymmetric (aRMe2). ...82
Table 3.1 Peptides used in LDA for combinatorial methylation study... 106
Table 3.2 H3 peptides methylated to varying degrees at varying sties. ... 111
Table 3.3 H3 peptides with single PTMs. ... 113
Table 3.4 H3 peptides with threonine phosphorylation and lysine methylation... 117
Table 4.1 ITC Binding data for A2B and A2N to the Histone 3 (H3) peptide Ac-WGGG-QTA(R8X)(K9Z)STG-NH2.25 ... 136
xiii
LIST OF FIGURES
Figure 1.1 Crystal structure of a nucleosome. ... 2 Figure 1.2 Representation of the two states of chromatin, either unwound and active
(euchromatin) or tightly condense and inaccessible (heterochromatin). ... 3 Figure 1.3 Post-translation modification of lysine, arginine, and serine. ... 4 Figure 1.4 a) Dimethyl lysine bound to the pocket of 53BP1 b) Trimethyl lysine bound
to the aromatic cage of BPTF. ... 6 Figure 1.5 a) Histone H4K20(Me)2 binding to L3MBTL1 b) Histone H3K9(Me)3 bound
to HP1 ... 7 Figure 1.6 Classical hydrophobic effect. ... 8 Figure 1.7 Diagram of the high-energy water inside two molecular containers. ... 9 Figure 1.8 a) Electrostatic potential map of benzene29 b) Association energy for
tetramethylammonium interacting with benzene and water in the gas phase.26 ... 10 Figure 1.9 Cyclophane designed to complex quaternary ammonium species in
CDCl3 (1) or pD=9 buffer (2). ... 11
Figure 1.10 Modification of the CX4 receptor (left) into the trisulfonated host (right). ... 13 Figure 1.11 Dynamic combinatorial chemistry. ... 14 Figure 1.12 Breakdown of Dougherty’s cyclophane into its constituent dithiol
building blocks for DCC. ... 15 Figure 1.13. Redesign of the small molecule receptor A2B to A2N ... 16
Figure 1.14 DCL containing monomers E and B (1 mM each) with peptide guest
Ac-K(Me)nGGY (2 mM) monitored at 254 nm. ... 18
Figure 1.15 DCL containing monomers E and A (1 mM each) with peptide guest
Ac-K(Me)nGGY (2 mM) monitored at 254 nm. ... 19
Figure 1.16 DCL containing monomers A (0.5 mM) and E (0.25 mM) and Ac-K(Me)nGGY-NH2 (0.75 mM), monitored at 280 nm. ... 20
Figure 1.17 Amplification data for the low concentration DCC libraries biased toward the formation of A2E with 0.5 mM A, 0.25 mM E, and 0.75 mM
Ac-K(Me)nGGY-NH2, as compared to the untemplated library. ... 20
xiv
Figure 1.19 Monomers used to examine the contribution of electrostatic interactions in the A2X framework. ... 23
Figure 1.20 Molecular modeling of A2C (A in grey, C in cyan) binding to butyldimethyl
ammonium (green). ... 24 Figure 1.21 Molecular models of A2N (left) and A2G (right) bound to butyl-trimethyl
ammonium (blue) as a model for K(Me)3. ... 26
Figure 1.22 Overlaid HPLC traces at 254 nm of DCC libraries biased toward the formation of A2C with monomers A (5 mM) and C (2.5 mM) and
Ac-K(Me)nG-NH2 (7.5 mM).5 ... 30
Figure 1.23 Overlaid HPLC traces at 254 nm of DCC libraries biased toward the formation of A2G with monomers A (0.5 mM) and G (0.25 mM) and
Ac-K(Me)nGGY-NH2 (0.75 mM). ... 31
Figure 1.24 Overlaid HPLC traces at 254 nm of DCC libraries biased toward the
formation of A2H with monomers A (5 mM) and H (2.5 mM) and
Ac-K(Me)nGGY-NH2 (7.5 mM). ... 31
Figure 1.25 Reverse phase HPLC trace of the preparative DCC library for the synthesis of A2E, monitored at 254nm. ... 32
Figure 1.26 Mass spectrum of A2E (-ESI). [M-H]-1 at 934.92 and [M-2H]-2 at 466.96. ... 33
Figure 1.27 Extinction coefficient determination of A2E. The extinction coefficient was
determined as the slope of the linear regression ... 34 Figure 1.28. ITC of R8GK9G (Ac-WGGG-QTAGGSTG-NH2) (1.2 mM) into
A2E (120 uM) at 26°C in 10 mM borate buffer, pH 8.5. ... 36
Figure 1.29 One of two trials of Lys (Ac-WGGG-QTARKSTG-NH2) (0.996 mM) into
A2E (109 uM) at 26°C in 10 mM borate buffer, pH 8.5. ... 36
Figure 1.30 One of two trials of KMe (Ac-WGGG-QTARKMeSTG-NH2) (1.1 mM)
into A2E (103 uM) at 26°C in 10 mM borate buffer, pH 8.5. ... 37
Figure 1.31 One of two trials of KMe2 (Ac-WGGG-QTARKMe2STG-NH2) (1.2 mM)
into A2E (99 uM) at 26°C in 10 mM borate buffer, pH 8.5. ... 37
Figure 1.32 One of two trials of KMe3 (Ac-WGGG-QTARKMe3STG-NH2) (0.95 mM)
into A2E (80 uM) at 26°C in 10 mM borate buffer, pH 8.5. ... 38
Figure 1.33 One of two trials of R8GKMe3 (Ac-WGGG-QTAGK(Me)3STG-NH2)
(1.001 mM) into A2E (98 uM) at 26°C in 10 mM borate buffer, pH 8.5. ... 38
xv
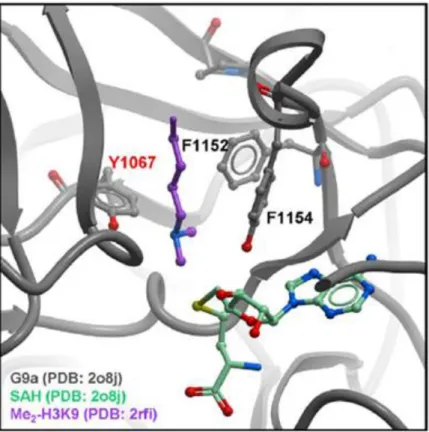
Figure 2.2 General reaction scheme for the methylation of lysine by PKMT enzymes and the cofactor S-Adenosylmethionine. ... 44 Figure 2.3 Model of G9a (grey) bound to H3K9(Me)2 (purple) and SAM cofactor (green). ... 45
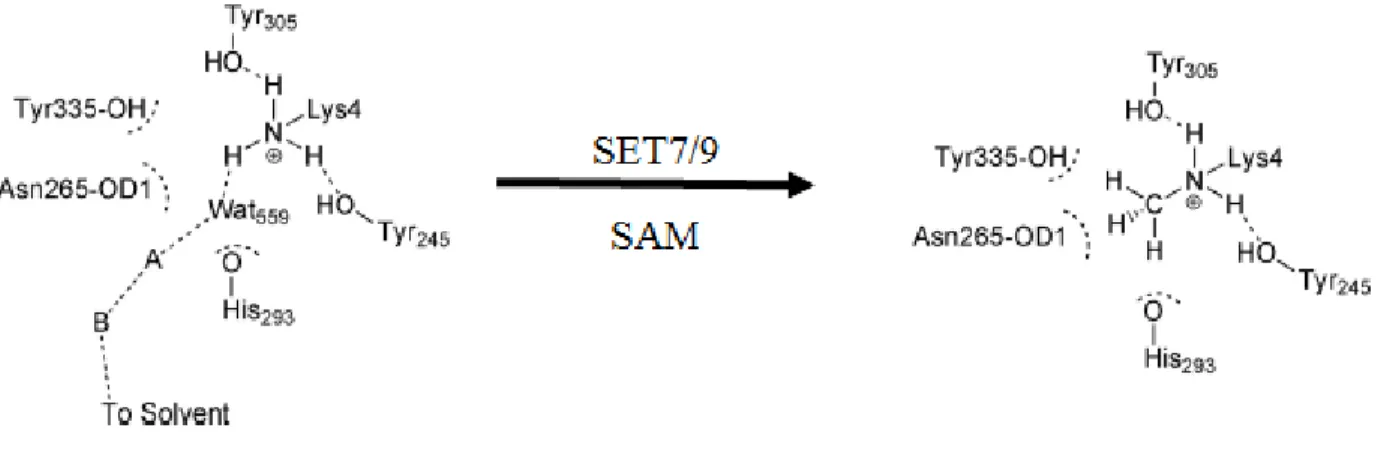
Figure 2.4 MD Simulations of the water channel promoted deprotonation of H3K4 and
subsequent methylation in the SET7/9 active site. ... 47 Figure 2.5 Methylation of arginine catalyzed by two distinct families of enzyme.
Asymmetric dimethylation is catalyzed by the Type I PRMT whereas symmetric dimethylation is carried out by the Type II PRMT. ... 48 Figure 2.6 Monomeric structure of PRMT1. SAM binding domain is shown in green,
with SAH (AdoHcy) shown in grey. The β-barrel is shown in yellow with bound arginine shown as the dark blue stick structure. The dimerization region of PRMT is highlighted in light blue. ... 49 Figure 2.7 Reaction scheme for the SAH (AdoHcy) coupled lysine methyltransferase
assay. ... 52 Figure 2.8 General scheme of a ‘turn-on’ indicator displacement assay. ... 53
Figure 2.9 Diagram for the fluorescent diamine oxidase enzyme based on the CB7/AO sensor. ... 55
Figure 2.10 DCC receptors A2B, A2D, and A2N. ... 56
Figure 2.11 Diagram for the fluorescent sensing of the dimethyltransferase enzyme G9a.. ... 57 Figure 2.12 Receptor A2B and binding affinities for representative peptides
(Ac-WGGG-QTARKMenSTG-NH2) for the enzymatic methylation of lysine 9 by G9a.4 ... 59
Figure 2.13 Environmentally sensitive fluorophores screened in the initial system study. ... 59
Figure 2.14 Fluorescence intensity of Dansyl Choline (58µM), Dansyl Choline (29 µM) and A2B (125 µM), and Dansyl Choline (29 µM) in
pH 8.5 phosphate buffer. ... 60
Figure 2.15 Fluorescence changes of PP Dye (5µM) and Thioflavin T (5µM) upon binding to A2B. ... 61
Figure 2.16 Fluorescence quenching and subsequent recovery of Acridine Orange (5 µM) with increasing concentrations of A2B. ... 61
Figure 2.17 Titration of H3K9 peptides (Ac-YGGG-QTARK(Me)nSTG-NH2) into
xvi
Figure 2.18 Fluorescence spectra for the enzymatic reaction of G9a on the peptide Ac-YGGG-QTARKSTG-NH2. Two experiments contain the IDA sensor
with AO/A2B each at 5µM, SAM at 50 µM, and G9a at 200 nM. ... 65
Figure 2.19. Structure of the fluorophore lucigenin (LCG). ... 66
Figure 2.20 Fluorescence quenching curves for 5 µM LCG with each receptor (0-150 µM). ... 67
Figure 2.21 IDA for the H3 mimic peptide Ac-YGGG-QTARK(Me)nSTG-NH2 using A2B (10 µM) and LCG (2.5 µM). ... 68
Figure 2.22 IDA for the H3 mimic peptide Ac-YGGG-QTARK(Me)nSTG-NH2 using A2D (5 µM) and LCG (1 µM). ... 69
Figure 2.23 IDA for the H3 mimic peptide Ac-YGGG-QTARK(Me)nSTG-NH2 using A2N (15 µM) and LCG (2.5 µM). ... 69
Figure 2.24 Radioactive S-Adenosylmethionine assay for the methylation of Lysine. ... 71
Figure 2.25 Radioactivity assay results for the methylation of H3 1-20 by G9a and 3H-SAM... 72
Figure 2.26 Peptide displacement tests to determine optimal substrate length using the A2N (25 µM)/LCG (2.5 µM) ... 74
Figure 2.27 Fluorescent ‘heat map’ of A2N/LCG (1 µM) sensor system for H3 1-15 (ARTKQTARKSTGGKAY-NH2). ... 76
Figure 2.28 Cuvette based fluorescence differentiation assay. ... 77
Figure 2.29 Cuvette based fluorescence enzyme assay. ... 78
Figure 2.30 Real-time G9a fluorescence assay ... 79
Figure 2.31 Real-time G9a fluorescence assay, 50 mM glycine, pH 9.15, 37°C. LCG (1 µM), A2N (15 µM), H3 1-15 (15 µM), G9a (0.2 µM), and SAM (300 µM). ... 80
Figure 2.32 Fluorescence titration of H4 peptides into A2D/LCG sensor system (5 µM/1 µM) ... 83
Figure 2.33 Fluorescence quenching of LCG (5 µM) binding to A2D (pH 8.0 25 mM K2HPO4, 2mM MgCl2, 1mM EDTA, 0.01% Triton X-100, 27°C) ... 86
xvii
Figure 2.35 Fluorescence quenching of LCG (5 µM) binding to A2N (pH 8.0
25 mM K2HPO4, 2mM MgCl2, 1mM EDTA, 0.01% Triton X-100, 27°C) ... 87
Figure 2.36 Cuvette based fluorescence differentiation assay. A2N (10 µM) and
LCG (1 µM), titrated with H3 1-15 peptides either unmodified or bearing K9(Me)2. The experiments were performed in 50 mM glycine,
pH 9.15 at 25°C. ... 88 Figure 2.37 Cuvette based fluorescence differentiation assay. A2N (12.5 µM)
and LCG (1 µM), titrated with H3 1-15 peptides either unmodified or bearing K9(Me)2. The experiments were performed in 50 mM
glycine, pH 9.15 at 25°C. ... 89
Figure 2.38 Cuvette based fluorescence differentiation assay. A2N (15 µM)
and LCG (1 µM), titrated with H3 1-15 peptides either unmodified or bearing K9(Me)2. The experiments were performed in 50 mM
glycine, pH 9.15 at 25°C. ... 89 Figure 2.39 Combined fluorescence difference for A2N (varying)
and LCG (1 uM) sensor pair. ... 90
Figure 3.1 Examples of the ‘histone code’, the cross talk between modifications on the histone tail ... 96
Figure 3.2 General assay design for pattern-based recognition and identification of analytes. ... 99
Figure 3.3 Sensor design for red-wine flavonoids. ... 99
Figure 3.4 Structure of the fluorescent cucurbiturils 1 and 2 as well as the LDA score plot for the response of ten analytes to the sensors. ... 100
Figure 3.5 a) Calixarene sensor readout for histone peptides with a variety of modifications. b) Sensor readout for varying degrees of methylation on a histone H3 peptide... 102
Figure 3.6 Fluorescence displacement for three receptor/LCG pairs by the histone H3 peptide Ac-YGGG-QTARK(Me)nSTG-NH2.. ... 104
Figure 3.7 Fluorescence response of three sensors (A2B/LCG, A2D/LCG, A2N/LCG)
to the short H3 peptide Ac-YGGG-QTARK(Me)nSTG-NH2 (30 µM)
in 50 mM glycine buffer, pH 9.15. ... 105 Figure 3.8 LDA plot of the fluorescence response to the short H3 peptides
Ac-YGGG-QTARK(Me)nSTG-NH2 (30 µM). Confidence ellipses at 95%. ... 105
Figure 3.9 Fluorescence response of three sensors (A2B/LCG, A2D/LCG, A2N/LCG)
xviii
Figure 3.10 LDA plot of the fluorescence response to the peptides in Table 3.1(30 µM).
Confidence ellipses at 95%. ... 107 Figure 3.11 3D LDA plot of the fluorescence response to the peptides in
Table 3.1(30 µM). ... 108
Figure 3.12 Fluorescence quenching of AO (5 µM) by three receptors in 50 mM glycine buffer, pH 9.15. ... 109
Figure 3.13 Fluorescence quenching of LCG (1 µM) by A2G in 50 mM
glycine buffer, pH 9.15. ... 111
Figure 3.14 Fluorescence titration of AO sensors with the multiply methylated peptides in Table 3.2 (15 µM) in 50 mM glycine buffer. ... 112
Figure 3.15 LDA of the fluorescence titration of AO sensors with the multiply methylated peptides in Table 3.2 (15 µM) in 50 mM glycine buffer. ... 112
Figure 3.16 Fluorescence titration of LCG sensors with the single modification peptides in Table 3.3 (15 µM) in 50 mM glycine buffer. ... 113
Figure 3.17 LDA of the fluorescence titration of LCG sensors with the single modification peptides in Table 3.3 (15 µM) in 50 mM glycine buffer. ... 114
Figure 3.18 Fluorescence titration of LCG sensors with the multiply methylated peptides in Table 3.2 (15 µM) in 50 mM glycine buffer. ... 115
Figure 3.19 LDA of the fluorescence titration of LCG sensors with the multiply methylated peptides in Table 3.2 (15 µM) in 50 mM glycine buffer.
85% confidence ellipses. ... 116
Figure 3.20 Fluorescence titration of LCG sensors with the phosphorylated peptides in Table 3.2 (15 µM) in 50 mM glycine buffer. ... 118
Figure 3.21 LDA of the fluorescence titration of LCG sensors with the phosphorylated peptides in Table 3.2 (15 µM) in 50 mM glycine buffer.
85% confidence ellipses. ... 118
Figure 3.22 LDA of the combined sensor array output for all thirteen peptides. The first five data points for each analyte are displayed to lower the
complexity of the output. ... 120
xix
Figure 3.24 LDA of the mock enzymatic kinase reaction monitoring conversion
of H3 1-12 K9(Me)3 to H3 1-12 K9(Me)3 T11 Phos.. ... 124
Figure 4.1 QM/MM calculation of the critical residues in the GCN5 HAT enzyme catalyzing the acetylation of K171. H-bonds responsible for deprotonation and acetylation shown in yellow... 132
Figure 4.2 Proposed mechanism of the metal-dependent HDAC enzymes.. ... 133
Figure 4.3 Molecular modeling of the PAD4 deimination reaction intermediates. ... 134
Figure 4.4 IDA for four different H3 peptides (Ac-ARTKQTARKSTGY-NH2) with A2B (10 µM) and LCG (2.5 µM). ... 138
Figure 4.5 LDA plot of the fluorescence sensor array with the H3 peptide Ac-AXTKQTAXKSTGY-NH2 (15 µM) where X is either Arg or Cit.. ... 139
Figure 4.6 LDA plot of the fluorescence sensor array with the H3 peptide Ac-AXTKQTAXKSTGY-NH2 (10 µM) where X is either Arg or Cit.. ... 140
Figure 4.7 LDA plot of the fluorescence sensor array with the H3 peptide Ac-AXTKQTAXKSTGY-NH2 (5 µM) where X is either Arg or Cit. ... 141
Figure 4.8 LDA plot of the fluorescence sensor array with the H3 peptide Ac-ARTXQTARXSTGY-NH2 (15 µM) where X is either K or K(Ac).. ... 142
Figure 4.9 LDA plot of the fluorescence sensor array with the H3 peptide Ac-ARTXQTARXSTGY-NH2 (10 µM) where X is either K or K(Ac).. ... 143
Figure 4.10 LDA plot of the fluorescence sensor array with the H3 peptide Ac-ARTXQTARXSTGY-NH2 (5 µM) where X is either K or K(Ac).. ... 144
Figure 4.11 LDA plot of the combined sensor data for analytes bearing acetylation or citrullination (15 µM).. ... 145
Figure 4.12 3D LDA plot of the combined sensor data for analytes bearing acetylation or citrullination (15 µM). ... 146
Figure 4.13 Zipper model describing histone H4 acetylation. Each lysine position is numbered starting from the N-terminus of the histone tail. ... 147
Figure 4.14 Fluorescence titration of A2E (inset) into LCG (5 µM). ... 149
Figure 4.15 Carboxylate spaced receptors GlyA2B (left) and GlyA2N (right). ... 150
Figure 4.16 Fluorescence titration of GlyA2B into LCG (5 µM). ... 151
xx
LIST OF ABBREVIATIONS
Ac Acetyl
AcCh Acetylcholine
ACN Acetonitrile
Ala, A Alanine
AO Acridine Orange
Arg, R Arginine
Boc tert-Butyloxycarbonyl
CB[#] Cucurbit[#]uril
CH3CN Acetonitrile
ChIP Chromatin Immunoprecipitation
Cit Citrulline
CX# Calix[#]arene
DA Discriminate Analysis
DCC Dynamic Combinatorial Chemistry
DCL Dynamic Combinatorial Library
DMF N,N-Dimethylformamide
DNA Deoxyribonucleic Acid
DTT Dithiothreitol
Fmoc Fluorenylmethoxycarbonyl
Gln, Q Glutamine
Glu, E Glutamic Acid
xxi
HAT Histone Acetyltransferase
HBTU N,N,N′,N′-Tetramethyl-O-(1H-benzotriazol-1-yl)uronium hexafluorophosphate
HDAC Histone Deacetylase
HP1 Heterochromatin Protein 1
HPLC High Performance Liquid Chromatography
HOBt Hydroxybenzotriazole
IDA Indicator Displacement Assay
ITC Isothermal Titration Calorimetry
Kd Dissociation Constant
K(Me) Monomethyllysine
K(Me)2 Dimethyllysine
K(Me)3 Trimethyllysine
LC-MS Liquid Chromatography - Mass Spectrometry
LCG Lucigenin
LDA Linear Discriminate Analysis
Leu,L Leucine
Lys/K/ Lysine
m/z Mass to Charge Ratio
MS Mass Spectrometry
NH4OAc Ammonium Acetate
NMR Nuclear Magnetic Resonance
PAD Protein Arginine Deiminase
xxii
Phos Phosphorylation
PKMT Protein Lysine Methyltransferase
PRMT Protein Arginine Methyltransferase
PTM Post-translational Modification
R(Me) Monomethylarginine
R(Me)2a Asymmetric Dimethylarginine
R(Me)2s Symmetric Dimethylarginine
RP-HPLC Reverse Phase-High Performance Liquid Chromatography
SAH/AdoHey S-adenoxyl-L-homocysteine
SAM/AdoMet S-adenosyl-L-methionine
Ser, S Serine
TFA Trifluoroacetic Acid
Thr, T Threonine
TIPS Triisopropylsilane
Trp, W Tryptophan
Trt Trityl
1
Structure Function Study of A2X Background
Ordered Structure of DNA
The genetic material responsible for coding eukaryotic life is contained within DNA and comprises the blueprints for all functions necessary to an organism’s survival. DNA in humans is contained in 23 unique pairs of chromosomes each with a different complement of genes
2
Figure 1.1 Crystal structure of a nucleosome. The DNA (in grey) wraps around 4 pairs of histone proteins (each colored as shown). From each of these proteins, an unstructured tail extends away from the complex.2 Reprinted with permission from Chem. Rev. 2015, 115, 2255-2273. Copyright 2015 American Chemical Society.
3
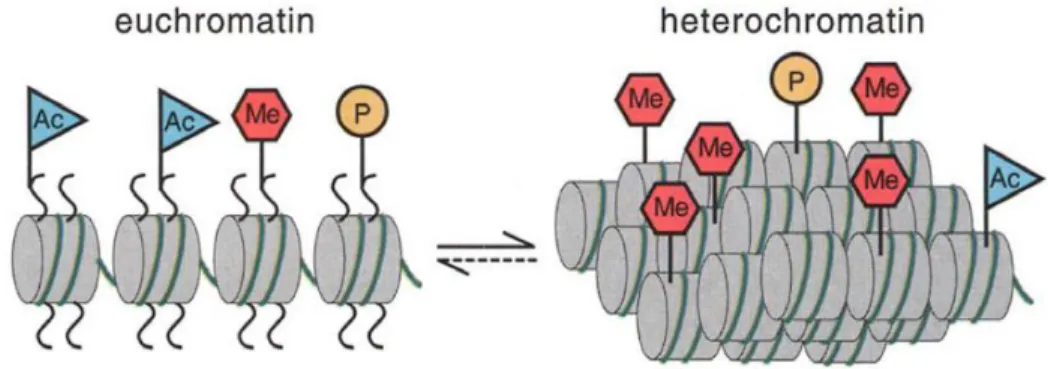
Figure 1.2 Representation of the two states of chromatin, either unwound and active
(euchromatin) or tightly condensed and inaccessible (heterochromatin). Each state is host to a unique assembly of post-translational modifications.5 From Science, 2001, 293, 1074-1080.
Reprinted with permission from AAAS.
Because each chromosome contains hundreds to thousands of genes, several mechanisms exist for switching between these active and inactive forms to preserve the compaction while ensuring no loss of function. A primary method for this switching utilizes the histone tails which extend outwards from the nucleosome complex, eight N-terminal tails, one from each histone, and two C-terminal tails, one from each H2A histone protein. 2 These tails are unstructured and are host to a variety of post-translational modifications (PTMs), covalent functional groups installed after the protein is synthesized.6
Post-translational Modifications
4
Figure 1.3 Post-translation modification of lysine, arginine, and serine. Each small chemical marker changes the recognition element of the amino acid side chain and is responsible for unique biological functions
In addition, larger molecules can be attached to the histone complex as PTMs, including sumoylation and ubiquitinilation, though these are outside of the scope of the current work.8,9 Each of these modifications can influence the genetic landscape through direct interaction with DNA, as seen in phosphorylation of H4S47 or acetylation of the H3 tail or through the
recruitment of ‘reader’ proteins that signal other events, such as trimethylation of H3K4 recruitment of the Chd1 remodeler protein.10
Lysine Methylation 1.1.3.1 Biological Significance
5
tails, but rather is responsible for a diverse range of chromatin remodeling events. Critically, the downstream events rely not just on the degree of methylation, but also on the site of
methylation.11 This methylation can be responsible for transcriptional activation, in the case of methylated H3K4, H3K36, and H3K79, or transcriptional silencing in the case of methylated H3K9, H3K27, and H4K20.6 Misregulation of the lysine methylation landscape has been implicated in many disease states. Expression of EZH2, responsible for the methylation of histone H3K27, has been linked to breast and prostate cancer, while loss of G9a, which dimethylates H3K9 has been shown to coincide with advantageous growth of cancer cells.12 Lysine methylation is proposed to be largely responsible for the recruitment of other proteins to the histone-DNA complex, and these proteins can either operate on or further recruit other cellular factors responsible for biological consequences.
1.1.3.2 Reader Proteins for Methyl Lysine
Throughout the lysine reader protein family there are many different binding domains that are responsible for recognizing not just the degree of methylation but its sequence context as well.13 As lysine is methylated, the hydrophobicity increases with a concurrent loss of hydrogen bonding capacity. Because of this, as well as the general hydrophobicity of the methylene units in the side chain, many lysine reader proteins rely on aromatic cages to recognize the
6
Figure 1.4 a) Dimethyl lysine bound to the pocket of 53BP1 b) Trimethyl lysine bound to the aromatic cage of BPTF.13 Reprinted by permission from Macmillan Publishers Ltd: Nat. Struct. Mol. Biol., 2007, 14, 1025-1040. Copyright 2007.
As evidenced from Figure 1.4, 53BP1 favors K(Me)2 binding through a variety of
cation-π interactions as well as a hydrogen bonding interaction with the neighboring aspartic acid. K(Me)3 on the other hand, because it lacks the capacity to hydrogen bond, is bound inside the
pocket with four aromatic residues, creating an excellent hydrophobic pocket as well as cation-π contacts.13 Work done in the Waters lab demonstrated that mutations of the binding pocket of reader proteins could significantly alter the binding properties and methylation state preference. The Drosophila heterochromatin binding protein, dHP1α can favorably bind to both trimethyl and dimethyl lysine 9 on the histone H3 tail using a half-cage motif of two tyrosines, a
tryptophan, and a glutamic acid. Through mutation studies, they showed that the glutamic acid, while not participating in K(Me)3 recognition, was important to binding K(Me)2. By mutating the
7
In addition to the residues that make up the binding pocket, many reader proteins distinguish between the methylated forms of lysine by taking advantage of surface grooves or deep cavity binding sites, as shown in Figure 1.5.16
Figure 1.5 a) Histone H4K20(Me)2 binding to L3MBTL1 through a deep cavity binding motif,
where the dimethyl lysine side chain is buried into a pocket in the reader protein b) Histone H3K9(Me)3 binding to HP1 through a surface groove motif, where the residue is surround by an
aromatic cage but not buried.16 Guo, Y, et al. Methylation-site-specific recognition of histones by the MBT repeat protein L3MBTL2. Nucleic Acids Research, 2009, 37, 7, 2204-2210 by
permission of Oxford University Press.
The deep cavity binding of L3MBTL1 is selective for K(Me) and K(Me)2, and
L3MBTL1 binding is responsible for the compaction of chromatin.17 The deep cavity motif imparts selectivity for lower methylation states because of its smaller size; K(Me)3 is too bulky to
thread in and interact with the aromatic cavity. Unmethylated lysine can thread into the cavity, but has weaker van der Waals’ and cation-π interactions with the hydrophobic pocket, reducing overall affinity.16,18 In contrast, the HP1 binding pocket is surface exposed, allowing the more bulky trimethyl lysine to bind, though selectivity is almost identical for K(Me)2 and K(Me)3, a
8 Non-covalent Binding of Methylated Lysine 1.1.4.1 Hydrophobic Effect
The classical hydrophobic effect describes the association of non-polar molecules in water. It postulates that in solution, water molecules around a hydrophobic surface, such as a hydrocarbon, become more ‘ice-like’, in that they engage in a higher number of hydrogen bonding interactions resulting in higher order and less favorable entropy. The association of two hydrophobic molecules reduces the surface area required for solvation, releasing the highly ordered water back into bulk solvent, and creating a favorable entropy term, as seen in Figure 1.6.19
Figure 1.6 Classical hydrophobic effect. Ice-like water (Light blue) is released into bulk solvent (dark blue) upon association of two hydrophobic surfaces.
9
enthalpy gain arose from the generation of other non-covalent interactions such as hydrogen bonding and cation-π interactions upon association, and these gains outweigh the disfavored entropy of restricted freedom.22 Recently, work done by the Nau group has postulated another source of enthalpic gain upon complexation, the release of high energy water.23 High energy water differs from highly ordered water in that high energy water cannot optimize its hydrogen bonding. This high energy water arises from the hydration of the inner cavities of molecules, of which every host species has a different size, and therefore different number of water molecules, as seen in Figure 1.7.
Figure 1.7 Diagram of the high-energy water inside two molecular containers. With increasing cavity size, more water molecules can fill the space, leading to less frustrated hydrogen bonding and lower energy complexes.23 Reproduced with permission from Wiley: Angew. Chem. Int. Ed.,
2014, 53, 11158-11171.
10
whereas CB8 had minimal binding due to having enough inner cavity space to allow optimization of the water hydrogen bonding network.24
1.1.4.2 Cation-π Interactions
Another significant attractive force for biological molecules in aqueous environments is the cation-π interaction. Aromatic surfaces have a permanent quadrupole moment, such that there exist two regions above and below the aromatic ring with localized negative charge (Figure 1.8a).25 Described in 1981 by Kebarle, then elaborated by Meot-Ner, the cation-π interaction is
responsible for the stronger interaction between benzene and cations over the analogous water binding of said cations, as seen for tetramethylammonium in Figure 1.8b.26–28 This motif is common in biological systems, with calculations showing that there is one significant cation-π interaction for every 77 residues within a given protein.29 Additional studies have shown that while an electrostatic salt bridge decreases in affinity over 50-fold in water, the analogous cation-π interaction drops only 3-fold, allowing the interaction to remain viable in a wider variety of environments, both solvent-exposed or buried in a pocket.30
Figure 1.8 a) Electrostatic potential map of benzene31 b) Association energy for
tetramethylammonium interacting with benzene and water in the gas phase.28 Reprinted with
11
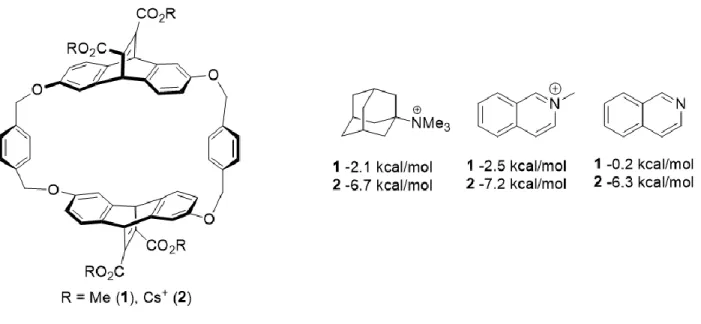
While critical and often referenced in biological function, the cation-π interaction is also prominent in small molecule recognition. In 1988, the Dougherty group designed a water-soluble cyclophane capable of binding to quaternary ammonium guest to explore the interaction, as shown in Figure 1.9.32
Figure 1.9 Cyclophane designed to complex quaternary ammonium species in CDCl3 (1) or
pD=9 buffer (2).32
In their work, they showed that the quaternary ammonium guests are able to tightly interact with the aromatic surface of their host (2), and still maintain their interaction in organic media (1), where solvent effects and ionic interactions to the charged carboxylates are
nonexistent. Additionally, removal of the quaternary ammonium significantly reduced binding, to the point that the non-methylated guest did not bind in organic medium, ruling out
electrostatics as the driving force of recognition. This result has been seen in other systems, such as analysis of the HP1 chromodomain binding to trimethyl lysine studied in the Waters lab. Upon mutation of K(Me)3 to tert-butyl norleucine the neutral analog, the binding affinity of the native
12
Small Molecule Receptors for Trimethyl Lysine 1.1.5.1 Cucurbiturils
In recent years much work has gone into the development and characterization of small-molecule receptors capable of binding to methylated lysine targets. In 2013, the Macartney lab studied the binding of methylated lysine and arginine to the supramolecular host cucurbituril.34
Cucurbiturils (CB) have previously been shown to bind to a variety of cationic guests due to their hydrophobic cavity with dense negative charge at either rim. This allows binding to hydrophobic guests that bear positive charge, ideal for methylated lysine.35 The Macartney group studied the interaction between CB6 and CB7 to the various methylated lysines in their amino acid form. They observed a 3500-fold selectivity for binding to K(Me)3 vs the unmethylated lysine, with a
Kd of 500 nM for K(Me)3. NMR studies showed that the N-methyl groups experience upfield
shifting similar to that of other cations, and neutralization of the amino acid carboxylate resulted in tighter binding, suggesting that binding was negatively influenced by the close proximity of the anionic residue to the carbonyl rim.34
1.1.5.2 Calixarenes
Recently the calixarene series of hosts has also been used to bind to trimethyl lysine in both binding studies and biological applications. The Hof group reported in 2010 that the p-sulfonatocalix[4]arene (CX4) host could differentiate between the methylated forms of lysine in both amino acid and peptide based forms.36 They observed almost 20-fold selectivity for
trimethyl lysine over the unmethylated form in the short peptide Ac-RKST-NH2, with a Kd for
K(Me)3 of around 10 µM. The high affinity and selectivity of binding was proposed to come
13
with the CX4 cavity, but only the K(Me)3 residue is capable of burying into the hydrophobic core
of the receptor, as the lower methylation states are too well solvated. Hof then performed a redesign and optimization of the CX4 receptor through selective modification of a single aromatic ring to achieve higher binding to trimethyl lysine, as shown Figure 1.10.37
Figure 1.10 Modification of the CX4 receptor (left) into the trisulfonated host (right). Affinities shown based on NMR titrations of the K(Me)3 and unmethylated lysine amino acids.
Using a multi-step synthesis the Hof group was able to furnish several derivatives of the trisulfonated calixarene, though only one displayed higher affinity binding and selectivity for trimethyl lysine. They hypothesized that the extra phenyl substituent was able to make increased contact with the side chain of lysine, increasing affinity, though additional substitution on this phenyl group significantly hampered binding. These calixarene receptors have been further applied to the disruption of protein-protein interactions between trimethylated lysine and several reader proteins, highlighting the utility of applying synthetic receptors to biological
problems.38,39
Dynamic Combinatorial Chemistry
14
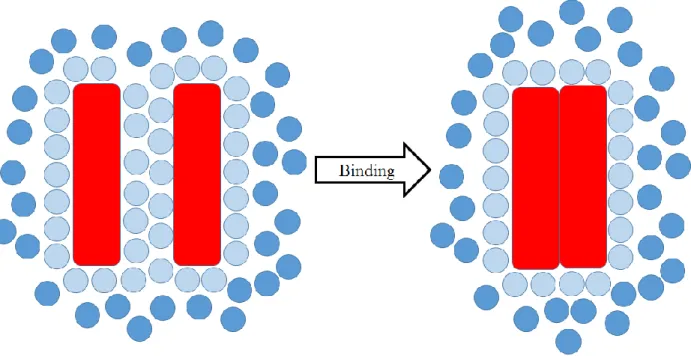
improvements were made to binding affinity and selectivity. Dynamic combinatorial chemistry (DCC) has arisen as a favorable alternative to this method of preparing larger macrocycles, allowing for both affinity screening and synthesis to occur in the same step. DCC is defined as combinatorial chemistry under thermodynamic control, where library members can exchange until the most stable, and therefore favorable, species is selected.40 The inclusion of a guest, should it create a more thermodynamically favorable species, will shift the equilibrium of the library such that said species is amplified, as shown in Figure 1.11.41
Figure 1.11 Dynamic combinatorial chemistry. Monomers in solution form stable species. The addition of a guest or template induces an equilibrium shift to favor the most stable binder.41
Reprinted from Curr. Opin. Chem. Biol., 6, Otto, S., Furlan, R., Sanders, J., Recent
Developments in Dynamic Combinatorial Chemistry. 321-327, Copyright 2002, with permission from Elsevier.
There have been a large number of reversible exchange reactions developed, including imine exchange, metathesis reactions, and thiol-thioester exchange to name a few.42–45 Disulfide exchange is also used to generate macrocyclic species due to its ease of exchange and ability to perform at near physiological pH, as well as having an easily adapted synthesis of thiol
15 1.1.6.1 Disulfide Receptors for Methylated Lysine
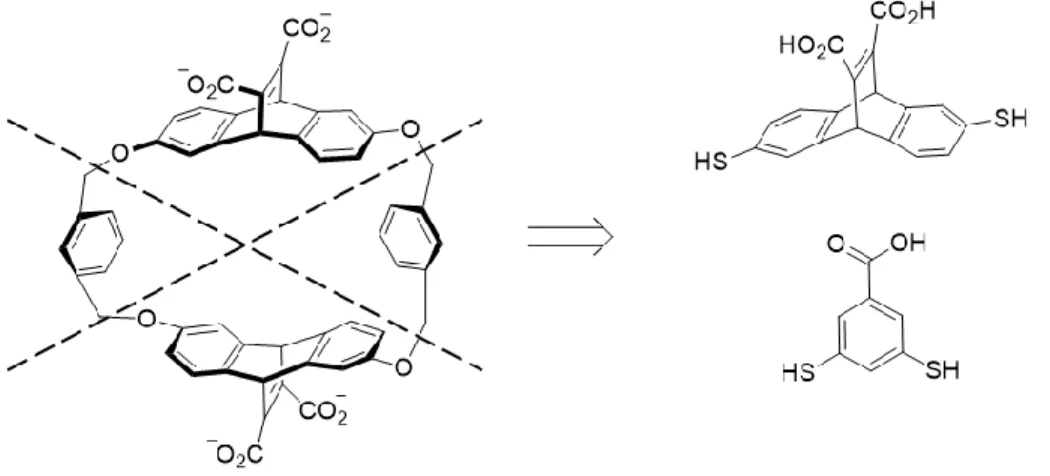
In 2008, Otto and Sanders applied disulfide exchange to the cyclophanes designed by Dougherty and described in section 1.1.4.2. They were able to split the cyclophane into several components that bore aromatic thiol functionalities with carboxylates for water solubility, and allowed these components to assemble in the presence of quaternary ammonium guests.47
Figure 1.12 Retrosynthesis of Dougherty’s cyclophane into its constituent dithiol building blocks for DCC.
Based on this work, the Waters group established the use of disulfide exchange to study methylated lysine receptors. They screened a variety of monomers that contained carboxylates for water solubility, aromatic cores for cation-π and hydrophobic effect interactions, and dithiols for reversible exchange.48 Using DCC, they discovered the small molecule receptor A2B, which bound to K(Me)3 with native protein like affinity, and showed selectivity over the lower
methylation states of lysine. The receptor was proposed to bind to trimethyl lysine through cation-π interactions, with selectivity arising from the increased cost of desolvation for the various lower methylated states.
16
Figure 1.13. Redesign of the small molecule receptor A2B to A2N to deepen the binding cavity as well as increase cation-π interactions.49 Reproduced from Org. Biomol. Chem., 2014, 12,
7059-7067 with the permission of The Royal Society of Chemistry.
This receptor bound to K(Me)3 with high nanomolar affinity, with the extra aromatic
surface providing a 1.3 kcal/mol increase in binding affinity, similar to that reported for other cation-π interactions. Additionally, the extra ring on the N monomer provided a more
hydrophobic surface, increasing the favorable entropic gain upon binding to trimethylated lysine based on the classical hydrophobic effect. This elegant redesign of a single monomer enabled the facile screening and synthesis of a tighter binder, highlighting the utility of DCC in creating synthetic host systems.
Motivation
17
afforded a unique opportunity to study the contributions of a variety of non-covalent interactions in the molecular recognition of methylated lysine. By modifying the monomeric species, we can set up dynamic combinatorial libraries (DCLs) that allow for simultaneous monitoring of
amplification as well as synthesis of host. This highlights the utility of DCC in structure function studies and receptor optimization, and allows us to draw comparisons between our receptors and the reader proteins that natively recognize this class of modification to further drive the
discovery and understanding of chemical biology tools for PTMs.
Results
Dynamic Combinatorial Libraries 1.2.1.1 Monomer E
With each of our previously described receptors, we saw retention of the A2X motif, suggesting that this was a highly favorable minimum energy for any library containing monomer A. One of the main advantages of DCC is that we could easily monitor libraries for selectivity through amplification, making it facile to prepare several libraries in tandem and perform a high-throughput monomer screen. For this study, we chose to prepare monomer E (Figure 1.19), which was reported in 2006 by the Otto group to bind to the poly amine spermine.50 We prepared DCC libraries containing monomer A and E to examine if it would form the A2X motif as well as libraries combining monomer B and E to test the possibility of forming tetramer structures like those previously reported. All libraries were equilibrated in the presence of the peptides Ac-K(Me)nGGY-NH2, which allowed us to examine effect of lysine methylation on the library
18
The DCC libraries containing B and E had only two main peaks amplified, with masses corresponding to the B3 trimer and B4 tetramer, as seen in Figure 1.14.
Figure 1.14 DCL containing monomers E and B (1 mM each) with peptide guest Ac-K(Me)nGGY (2 mM) monitored at 254 nm.
The B3 and B4 macrocycles were favored in the unmethylated lysine library and
amplification decreases as methylation state increases. Interestingly, we saw no incorporation of the E monomer, though the trace signal at 254nm is higher at 0.5 minutes for the later libraries, suggesting that the E containing macrocycles are not being retained on the column, though no masses corresponding to macrocyclic species could be distinguished.
19
Figure 1.15 DCL containing monomers E and A (1 mM each) with peptide guest Ac-K(Me)nGGY (2 mM) monitored at 254 nm.
Our initial libraries, prepared at millimolar concentrations of monomers and not in a buffered system, gave surprising amplification, suggesting that the dimethylated lysine amplified A2E the most. However, upon analysis of the library using different conditions, we observed that the peaks corresponding to peptide in the K(Me)3 library were drastically lower, suggesting that
20
Figure 1.16 DCL containing monomers A (0.5 mM) and E (0.25 mM) and Ac-K(Me)n
GGY-NH2 (0.75 mM), monitored at 280 nm.
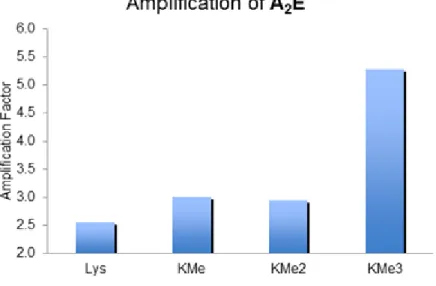
Figure 1.17 Amplification data for the low concentration DCC libraries biased toward the
formation of A2E with 0.5 mM A, 0.25 mM E, and 0.75 mM Ac-K(Me)nGGY-NH2, as compared
to the untemplated library.
21
determined by mass and binding characterization was performed using Isothermal Titration Calorimetry (ITC). Concurrently with this receptor, another member of the lab, Dr. Joshua Beaver, discovered several other monomers that amplified the A2X motif. Because each library amplified the A2X framework, we established a structure function study to characterize the contribution of modifying the single X residue.
1.2.1.2 Additional Monomers Characterized in This Study
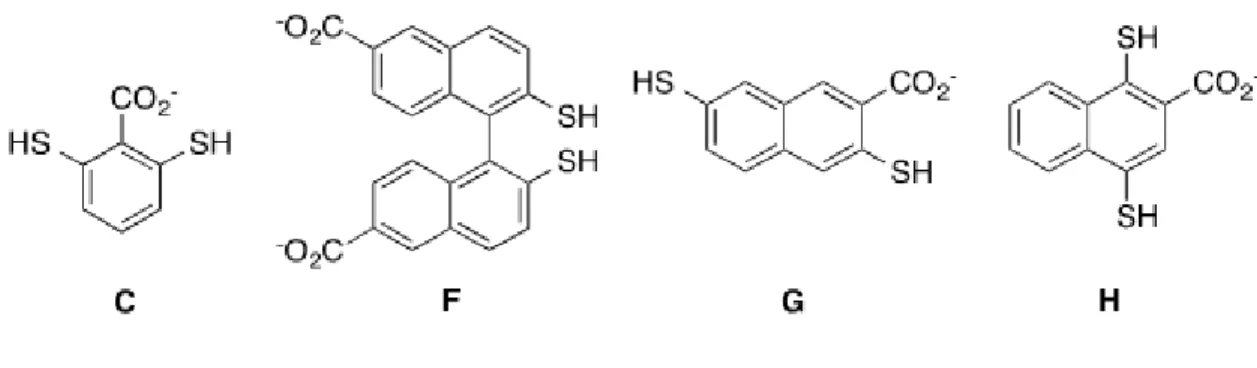
The additional receptors used in this study were synthesized and characterized by Dr. Joshua Beaver, and full experimental details can be found in the resulting publication.51 Figure 1.18 shows the structure of each monomer studied as part of the A2X framework.
Figure 1.18 Monomers synthesized by Dr. Joshua Beaver for the structure function study of A2X.
For each monomer, exploratory libraries were set up to test for amplification in the presence of methylated lysine. Monomer C, designed to test the effect of moving the carboxylate closer to the interior of the receptor pocket, saw amplification of the A2C receptor. The
22
the A2G species, this time heavily favoring the trimethyl lysine species (Figure 1.23), suggesting a selective binder. For monomers F and H, we did not observe useful library amplification. Monomer F did not display any higher order macrocyclic species upon addition of lysine guests, and monomer H, while forming the A2H species, displayed equally high amplification regardless of guest (Figure 1.24). We hypothesized that this monomer was capable of self-templating A2H through edge-face interactions between the naphthyl moiety of H and the aromatic surface of the A2 cleft, therefore abolishing selectivity.49
Investigation of Receptors with Varied Electrostatic Interactions
We first investigated the binding of methyl lysine bearing peptides to the receptors A2C and A2E, which varied the electrostatic interactions present inside the methyl lysine binding pocket of the A2X framework. We studied the binding of these receptors to peptide mimics of the histone H3 tail, Ac-WGGG-QTARK(Me)nSTG-NH2 using all four methylation states of lysine.
The WGGG tag was appended to the N-terminus to allow accurate concentration determination, and the control peptide Ac-WGGG-QTAGGSTG-NH2 was also examined. This control peptide
23
Figure 1.19 Monomers used to examine the contribution of electrostatic interactions in the A2X framework.
Table 1.1 Thermodynamic binding data obtained for binding of A2B, A2C, and A2E to Ac-WGGG-QTARK(Me)nSTG-NH2 as measured by ITC.a
Entry Receptorb Peptide Kd c (μM) Selectivity d ΔG c (kcal/mol)
1 e A2B KMe3 2.6 ± 0.1 - -7.63 ± 0.03
2e A2B KMe2 6.3 ± 0.3 2.4 -7.10 ± 0.07
3e A2B KMe 13.9 ± 0.1 5.4 -6.64 ± 0.01
4e A2B Lys 22 ± 1 8.3 -6.38 ± 0.02
5 e A2B R8GKMe3 17.1 ± 0.1 -6.52 ± 0.01
6 A2C KMe3 2.3 ± 0.1 - -7.69 ± 0.02
7 A2C KMe2 2.8 ± 0.2 1.2 -7.57 ± 0.04
8 A2C KMe 13.8 ± 0.7 6.0 -6.63 ± 0.03
9 A2C Lys 22 ± 1 9.6 -6.34 ± 0.03
10 A2C R8GKMe3 29 ± 3 -6.17 ± 0.05
11f A2E KMe3 0.191 ± 0.002 - -9.16 ± 0.01
12f A2E KMe2 0.5 ± 0.1 2.6 -8.5 ± 0.1
13 f A2E KMe 1.6 ± 0.2 8.4 -7.92 ± 0.08
14 f A2E Lys 6.7 ± 0.1 35 -7.05 ± 0.01
15f A2E R8GKMe3 2.7 ± 0.3 -7.59 ± 0.06
(a) All data determined by ITC, fit to one-site binding model; Condi-tions: 26 °C, in 10 mM sodium borate buffer, pH 8.5. (b) All receptors are mixtures of isomers except rac-A2B. (c) Errors are from averages of three trials, unless noted otherwise. (d) Selectivity is calculated as the fold difference in affinity for KMe3 over the designated methyla-tion state of the peptide in that row. (e) Data reported by Pinkin and Waters.21 (f) Average of two trials.
24
affinity for K(Me)3, K(Me), or unmethylated lysine. However, the binding affinity for K(Me)2
increased by approximately 2-fold, essentially abolishing selectivity of the receptor for K(Me)2
and K(Me)3 in a similar fashion to shallow binding pocket reader proteins.13 Molecular modeling
of A2C revealed a potential hydrogen bonding interaction within the pocket, as seen in Figure 1.20.
Figure 1.20 Molecular modeling of A2C (A in grey, C in cyan) binding to butyldimethyl ammonium (green).
The modeling suggests that the methyl groups of lysine can associate with the aromatic walls of the A2 cleft through several cation-π effects, providing several favorable binding interactions. Interestingly, the positioning of the carboxylate ortho to the two thiols twists it out of the plane of the aromatic ring of C. This conformation is what directs the charge inside the binding pocket, becoming available for hydrogen bonding. This hydrogen bond does not influence K(Me)3 binding, presumably because it can still fully participate in the interactions
25
Addition of the extra carboxylate in A2E increased the binding affinity to trimethylated lysine by an order of magnitude compared to A2B (Table 1.1, entries 1 and 11). Additionally, the binding to each form of methylated lysine was increased by 1.3-1.5 kcal/mol, though the
selectivity across this series remained essentially unchanged. This result suggests that the extra charge provides a consistent increase in binding, irrespective of the degree of methylation, similar to work done by Dougherty in which increased receptor charge enhanced binding to well solvated guests through cooperative interaction.52 However, the binding selectivity over
unmethylated lysine increased dramatically, from 8 fold in the case of A2B to 35 fold for A2E due to a lesser overall increase in binding affinity for unmethylated lysine.
Previous work had shown that the neighboring charge can influence receptor binding to trimethyl lysine (Table 1.1, entry 5).49 By varying the amino acid sequence and replacing the lysine-adjacent arginine with glycine (R8G), we can examine the specific binding of receptors to trimethyl lysine. For both A2C and A2E this resulted in a 13-fold drop in affinity corresponding to a loss of 1.5 kcal/mol of binding energy. In comparison, A2B only drops 7 fold when arginine is swapped for glycine, suggesting that by repositioning the negative charge or increasing it, the receptor is more sensitive to the neighboring peptide sequence. However, these results do
highlight the ability to fine-tune the binding properties of a synthetic receptor through addition or modification of the existing electrostatic contributions, though only a small difference in
selectivity was observed.
Investigation of Receptors with Deeper Binding Pockets
Previous work in the Waters lab had seen the iterative re-design of A2B into receptor A2N, which bound to K(Me)3 with high nanomolar affinity.49 Interestingly, this affinity increase
26
A2C and A2E, had shallow binding pockets with electrostatic interactions close to the interior, A2N cannot form electrostatic interactions to guests bound inside the pocket. Additionally, monomer N has an additional aromatic surface responsible for greater cation-π interactions with the methylated ammonium as well as CH-π interactions with the side chain methylenes (Figure 1.21). This deeper pocket allows trimethyl lysine to bury inside, while the lower methylation states require more significant desolvation because the inner cavity is deeper.
Figure 1.21 Molecular models of A2N (left) and A2G (right) bound to butyl-trimethyl ammonium (blue) as a model for K(Me)3.
27
Table 1.2 Thermodynamic binding data obtained for binding of A2N and A2E to Ac-WGGG-QTARK(Me)nSTG-NH2 as measured by ITC.a
Entry Receptorb Peptide K
d c (μM) Selectivity d ΔG c (kcal/mol)
1 e A2N KMe3 0.30 ± 0.04 - -8.91 ± 0.07
2 e A2N KMe2 4.1 ± 0.5 14 -7.36 ± 0.04
3 e A2N KMe 40 ± 4 130 -6.01 ± 0.06
4 e A2N Lys 10.5 ± 0.9 35 -6.80 ± 0.05
5 e A2N R8GKMe3 1.3 ± 0.2 -8.05 ± 0.08
6 f A2G KMe3 1.4 ± 0.1 - -8.00 ± 0.05
7 f,g A2G KMe2 13.2 ± 2.4 10 -6.6 ± 0.1
8 f A2G KMe 15 ± 1 11 -6.57 ± 0.04
9 f,h A2G Lys >58 >40 < -5.8
10 fg A2G R8GKMe3 5.4 ± 0.1 -7.19 ± 0.01
(a) All data determined by ITC, fit to one-site binding model; Conditions: 26 °C, in 10 mM sodium borate buffer, pH 8.5. (b) A2N was measured as the meso-species, A2G as a mixture of isomers. (c) Errors are from averages of three trials, unless noted otherwise. (d) Selectivity is calculated as the fold difference in affinity for KMe3 over the designated methylation state of the peptide in that row. (e) Data reported by Pinkin and Waters21 (f) Average of two
trials. (g) Error determined by propagation from curve fitting and averages. (h) These values are approximate because the c-value for these experiments was <1.
ITC revealed that A2G bound to K(Me)3 about two fold tighter than A2B (Kd = 1.4 ± 0.1
μM). Additionally, it had good selectivity over the lower methylated species of lysine, comparable to A2N, supporting the hypothesis of a deeper, more selective binding pocket.
Binding for K(Me)2 was similar to that of K(Me), suggesting that neither of the smaller guests fit
well in the pocket, and the selectivity over unmethylated lysine was larger than 40-fold, the greatest observed so far, presumably due to the higher surface area of the pocket and increased desolvation cost of the guest.
28 Conclusion
In summary, we have used DCC to perform a structure function study on the A2X macrocyclic framework to establish the contributions of several different non-covalent binding interactions. DCC allowed for both rapid affinity screening and facile synthesis of several different receptors, with varying electrostatic interactions and pocket depths. Interestingly, the fast screening methodology allowed for several monomers to be screened that did not synthesize useful, selective binders. This allowed us to move on quickly from the unproductive monomers without expending time in the full synthesis and characterization, a large advantage of DCC.
Of the monomers and receptors we did synthesize, we observed that the shallow binding pockets were influenced by not just the number of electrostatic interactions but also their position in the receptor. By adding an extra carboxylate in monomer E, we observed an increase in
binding affinity across the series of methylated lysine, but by repositioning the carboxylate to ortho between the thiols we saw a significant increase in affinity for only the K(Me)2 species,
indicative of a hydrogen bond. This is significant because it shows that by careful manipulation of the functionality of monomers it would be possible to create selective receptors for the lower methylated forms of lysine.
We also explored the contribution of binding from a deeper binding pocket and observed that the selectivity of binding for K(Me)3 increased. This is presumably due to the lower
desolvation cost of K(Me)3, allowing it to bury into the pocket. Interestingly the deep pocket also
29
These receptors reinforce many of the binding motifs seen in biological reader proteins for methylated lysine, despite the fact that they are many orders of magnitude smaller. In
addition, the utility of DCC in rapidly designing, screening, and synthesizing receptors cannot be understated, fueling novel receptor design and broadening of targets to other methylated species and furthering the understanding of non-covalent binding interactions in water.
Experimental
Full synthesis and characterization, including ITC for receptors A2C, A2G, and A2H can be found in the publication of this work.51
Peptide Synthesis
All peptide synthesis was performed on a Tetras Peptide Synthesizer using Peptides International CLEAR-Amide resin. Peptides were synthesized on a 0.06 mmol scale. All amino acids with functionality were protected during synthesis. Coupling reagents were HOBt/HBTU in DMF. For the dipeptides, the N-terminus was acylated with a solution of 5% acetic anhydride and 6% 2,6-lutidine in DMF. Cleavage was performed by hand with a cocktail of 95%
TFA/2.5% triisopropylsilane/2.5% H2O for 3 hours.
Methylated peptides were synthesized with either 2 equivalents of Fmoc-Lys(Boc)(Me)-OH purchased from BaChem or Fmoc-Lys(Me)2-Fmoc-Lys(Boc)(Me)-OH•HCl purchased from Anaspec and coupled for 4 hours. The trimethyl lysine-containing peptides were synthesized by reacting the
30
washing the resin with DMF (3x), CH2Cl2 (3x), and drying, the peptide was cleaved and purified
as normal.
Peptides were purified by semipreparative reverse-phase HPLC on a C18 column at a flow rate of 4 mL/min. Peptides were purified with a linear gradient of A and B (A: 95% H2O,
5% CH3CN with 0.1% TFA, B: 95% CH3CN, 5% H2O with 0.1% TFA) and elution was
monitored at 214 nm. Once purified, peptides were lyophilized to powder and characterized by ESI-MS. Peptides used in binding studies were desalted and repurified by semipreparative reverse-phase HPLC with a C-18 column and buffered mobile phase. Peptides were purified using an optimized gradient of A and B (A: 100% H2O, 10 mM NH4OAc; B: 90% CH3CN, 10%
H2O, 10 mM NH4OAc). The ammonium salts were removed under reduced pressure for three to
five days after the samples were dry.
DCC Libraries
31
Figure 1.23 Overlaid HPLC traces at 254 nm of DCC libraries biased toward the formation of A2G with monomers A (0.5 mM) and G (0.25 mM) and Ac-K(Me)nGGY-NH2 (0.75 mM).
Figure 1.24 Overlaid HPLC traces at 254 nm of DCC libraries biased toward the formation of A2H with monomers A (5 mM) and H (2.5 mM) and Ac-K(Me)nGGY-NH2 (7.5 mM).
Preparative Synthesis of A2E
A2E was synthesized using a preparative scale DCL, with monomer A (2.0 mM),
32
buffer, pH = 8.5. AcCH was used because it is commercially available and amplified A2E under preparative library conditions. After five days, the library was filtered and purified using semi-preparative HPLC (solvent A: 10mM NH4OAc in H2O; solvent B: 10 mM NH4OAc in 10% H2O,
90% CH3CN) in a linear gradient. Clean separation of the isomers was not possible, so the trace
as reported was used for further experiments.
33
Figure 1.26 Mass spectrum of A2E (-ESI). [M-H]-1 at 934.92 and [M-2H]-2 at 466.96.
Extinction Coefficient Determination
In order to have reproducible concentrations of receptor, extinction coefficients were determined using mixtures of isomers from A2E. After purification using NH4OAc buffered
solvents, the receptors were lyophilized for at least one week to ensure removal of the volatile NH4Oac salts. The dry sample was then taken up into anhydrous methanol and filtered with a
34
Figure 1.27 Extinction coefficient determination of A2E. The extinction coefficient was determined as the slope of the linear regression
Isothermal Titration Calorimetry Binding Experiments
Depending on the system studied, ITC titrations were performed with a range of ~0.7-2 mM solution of peptide into ~60-200 uM of receptor. For weaker interactions, the c-value is low, so there is a higher degree of error. While one-site binding is assumed, n-values do deviate from 1, which can be attributed to both the error in accurately determining receptor concentration.
Heat of dilution titrations were measured on a Microcal AutoITC200 at 298K. In parallel to binding measurements by ITC, peptide (1-2 mM) was titrated into sodium borate buffer (10 mM, pH 8.5) using 2.0 μL increments every 3 minutes. The resulting data was manually integrated to reduce error in automatic baseline calculations. The resulting normalized changes in enthalpy (NDH) measurements were normalized for peptide concentration and subtracted directly from NDH measurements for all subsequent ITC titrations from that peptide stock solution.
Table 1.3 Thermodynamic binding data obtained for binding of the receptors to Ac-WGGG-QTARK(Me)nSTG-NH2 as measured by ITC.a
y = 0.4812x - 0.0003 R² = 0.9997
0 0.1 0.2 0.3 0.4 0.5 0.6
0 0.2 0.4 0.6 0.8 1 1.2
Ab
so
rb
an
ce
A2E Concentration (mM)
35
(a) All data determined by ITC, fit to one-site binding model; Conditions: 26 °C, in 10 mM sodium borate buffer, pH 8.5. (b) All receptors are mixtures of isomers except rac-A2B and meso-A2N. (c) Errors are from averages of three trials, unless noted otherwise. (d) S. factor is selectivity, which is calculated as the fold difference in affinity for KMe3 over the designated methylation state of the peptide in that row. (e) Data reported by Pinkin and Waters.7
(f) Average of two trials. (g)Error determined by propagation from curve fitting and averages. (h)These values are approximate because the c-value for these experiments was <1.
36
Figure 1.28. ITC of R8GK9G (Ac-WGGG-QTAGGSTG-NH2) (1.2 mM) into A2E (120 uM) at
26°C in 10 mM borate buffer, pH 8.5.
Figure 1.29 One of two trials of Lys (Ac-WGGG-QTARKSTG-NH2) (0.996 mM) into A2E (109
37
Figure 1.30 One of two trials of KMe (Ac-WGGG-QTARKMeSTG-NH2) (1.1 mM) into A2E
(103 uM) at 26°C in 10 mM borate buffer, pH 8.5.
Figure 1.31 One of two trials of KMe2 (Ac-WGGG-QTARKMe2STG-NH2) (1.2 mM) into A2E
38
Figure 1.32 One of two trials of KMe3 (Ac-WGGG-QTARKMe3STG-NH2) (0.95 mM) into
A2E (80 uM) at 26°C in 10 mM borate buffer, pH 8.5.
Figure 1.33 One of two trials of R8GKMe3 (Ac-WGGG-QTAGK(Me)3STG-NH2) (1.001 mM)
39
REFERENCES
(1) Annuziato, A. Nature Education. 2008, 1, 26.
(2) McGinty, R. K.; Tan, S. Chem. Rev. 2015, 115, 2255. (3) Luger, K.; Collins, F. Life Sci. 2001, 1.
(4) Braunstein, M.; Sobel, R. E.; Allis, C. D.; Turner, B. M.; Broach, J. R. Mol. Cell. Biol. 1996, 16, 4349.
(5) Jenuwein, T.; Allis, C. D. Science 2001, 293, 1074. (6) Kouzarides, T. Cell 2007, 128, 693.
(7) Falkenberg, K. J.; Johnstone, R. W. Nat. Rev. Drug Discov. 2014, 2, 673. (8) Shiio, Y.; Eisenman, R. N. Proc. Natl. Acad. Sci. U. S. A. 2003, 100, 13225. (9) Cao, J.; Yan, Q. Front. Oncol. 2012, 2, 1.
(10) Bowman, G. D.; Poirier, M. G. Chem. Rev. 2015, 115, 2274. (11) Martin, C.; Zhang, Y. Nat. Rev. Mol. Cell Biol. 2005, 6, 838.
(12) He, Y.; Korboukh, I.; Jin, J.; Huang, J. Acta Biochim. Biophys. Sin. 2012, 44, 70.
(13) Taverna, S. D.; Li, H.; Ruthenburg, A. J.; Allis, C. D.; Patel, D. J. Nat. Struct. Mol. Biol. 2007, 14, 1025.
(14) Yun, M.; Wu, J.; Workman, J. L.; Li, B. Cell Res. 2011, 21, 564. (15) Eisert, R. J.; Waters, M. L. ChemBioChem 2011, 12, 2786.
(16) Guo, Y.; Nady, N.; Qi, C.; Allali-Hassani, A.; Zhu, H.; Pan, P.; Adams-Cioaba, M. a.; Amaya, M. F.; Dong, A.; Vedadi, M.; Schapira, M.; Read, R. J.; Arrowsmith, C. H.; Min, J. Nucleic Acids Res. 2009, 37, 2204.
(17) Trojer, P.; Li, G.; Sims, R. J.; Vaquero, A.; Kalakonda, N.; Boccuni, P.; Lee, D.;
Erdjument-Bromage, H.; Tempst, P.; Nimer, S. D.; Wang, Y. H.; Reinberg, D. Cell 2007, 129, 915.
40
(19) Anslyn, E.; Dougherty, D. Modern Physical Organic Chemistry; University Science Books: California, 2006.
(20) Southall, N. T.; Dill, K. a.; Haymet, a. D. J. J. Phys. Chem. B 2002, 106, 521.
(21) Meyer, E. E.; Rosenberg, K. J.; Israelachvili, J. Proc. Natl. Acad. Sci. U. S. A. 2006, 103, 15739.
(22) Meyer, E. a.; Castellano, R. K.; Diederich, F. Angew. Chem. Int. Ed. 2003, 42, 1210. (23) Biedermann, F.; Nau, W. M.; Schneider, H.-J. Angew. Chem. Int. Ed. 2014, 2.
(24) Biedermann, F.; Uzunova, V. D.; Scherman, O. a.; Nau, W. M.; De Simone, A. J. Am. Chem. Soc. 2012, 134, 15318.
(25) Ma, J. C.; Ma, J. C.; Dougherty, D. A.; Dougherty, D. A. Chem. Rev. 1997, 97, 1303. (26) Sunner, J.; Nishizawa, K.; Kebarle, P. J. Phys. Chem. 1981, 85, 1814.
(27) Meot-Ner, M.; Deakyne, C. a. J. Am. Chem. Soc. 1985, 107, 474. (28) Meot-Ner, M.; Deakyne, C. a. J. Am. Chem. Soc. 1985, 63, 469.
(29) Gallivan, J. P.; Dougherty, D. a. Proc. Natl. Acad. Sci. U. S. A. 1999, 96, 9459. (30) Gallivan, J. P.; Dougherty, D. a. J. Am. Chem. Soc. 2000, 122, 870.
(31) Wheeler, S. E.; Houk, K. N. J. Chem. Theory Comput. 2009, 5, 2301. (32) Stauffer, D. a.; Dougherty, D. a. Tetrahedron Lett. 1988, 29, 6039.
(33) Hughes, R. M.; Wiggins, K. R.; Khorasanizadeh, S.; Waters, M. L. Proc. Natl. Acad. Sci. U. S. A. 2007, 104, 11184.
(34) Gamal-Eldin, M. a; Macartney, D. H. Org. Biomol. Chem. 2013, 11, 488. (35) Assaf, K. I.; Nau, W. M. Chem. Soc. Rev. 2015, 44, 394.
(36) Beshara, C. S.; Jones, C. E.; Daze, K. D.; Lilgert, B. J.; Hof, F. ChemBioChem 2010, 11, 63.
(37) Daze, K. D.; Ma, M. C. F.; Pineux, F.; Hof, F. Org. Lett. 2012, 14, 1512.