PERCEPTUALLY DRIVEN INTERACTIVE SOUND PROPAGATION FOR VIRTUAL ENVIRONMENTS
Atul Rungta
A dissertation submitted to the faculty of the University of North Carolina at Chapel Hill in partial fulfillment of the requirements for the degree of Doctor of Philosophy in the Department of Computer Science.
Chapel Hill 2018
© 2018 Atul Rungta
ABSTRACT
Atul Rungta: Perceptually Driven Interactive Sound Propagation for Virtual Environments (Under the direction of Dinesh Manocha)
Sound simulation and rendering can significantly augment a user‘s sense of presence in virtual environ-ments. Many techniques for sound propagation have been proposed that predict the behavior of sound as it interacts with the environment and is received by the user. At a broad level, the propagation algorithms can be classified into reverberation filters, geometric methods, and wave-based methods. In practice, heuristic methods based on reverberation filters are simple to implement and have a low computational overhead, while wave-based algorithms are limited to static scenes and involve extensive precomputation. However, relatively little work has been done on the psychoacoustic characterization of different propagation algorithms, and evaluating the relationship between scientific accuracy and perceptual benefits.
ACKNOWLEDGMENTS
First of all, I would like to thank my adviser Prof, Dinesh Manocha for giving me the opportunity to work with him and providing me with the necessary tools to pursue my ideas. His guidance and support were instrumental in me accomplishing my research goals.
I would also like to thank my committee member Prof. Roberta Klatzky for her exceptional guidance in helping me design my experiments. For someone of her stature to be so approachable and helpful was indeed a privilege. Further, I am grateful to my committee members Prof. Ming Lin, Prof. Marc Niethammer, and Prof. Gary Bishop for their feedback in making sure my dissertation meets the highest standards.
I would like to thank my co-author Ravish Mehra for being a mentor to me as I was starting out and introducing me to the field of sound simulation. Further, I am grateful to my other co-authors for their help and insight. Apart from that, these last five years would not have been an enjoyable experience had it not been for my amazing friends in the GAMMA group and the CS department; the constant companionship, deep technical (and sometimes personal) discussions, the late night fooseball, ping-pong, and heated, irrelevant discussions have made this an unforgettable experience, which I shall forever look back upon fondly.
Apart from my friends at UNC, my friends from Pune (India) have continued to play a huge role in my life and I owe my sanity and well-being over the last five years to them. Aaditya, Vaibhav, Anu, Neha, and Mansa are the reason I kept traveling to California, to blow-off steam after a strenuous paper submission. Here’s to many more fun trips together.
My wife Vagisha is perhaps the most patient person I know. She was very understanding during her time here and managed really well on the limited resources we had at our disposable. This really helped me focus on my PhD and get it done as soon as was possible. I love you!
Finally, and most importantly, I would like thank my parents who are always there for me, no matter what. They have been incredibly supportive and loving and none of this would have been possible without them. I dedicate this dissertation to them.
TABLE OF CONTENTS
LIST OF TABLES . . . xi
LIST OF FIGURES . . . xiii
1 INTRODUCTION . . . 1
1.1 Motivation . . . 1
1.2 Psychoacoustic Evaluation of Interactive Sound Propagation Algorithms . . . 3
1.3 Accurate Simulation of Sound Propagation Effects . . . 6
1.4 Challenges . . . 9
1.5 Thesis Statement . . . 11
1.6 Main Results . . . 12
1.6.1 Psychoacoustic Evaluation of Interactive Sound Propagation Algorithms . . . 12
1.6.2 Mode-aware Sound Propagation . . . 13
1.6.3 Diffraction Kernels for Interactive Sound Propagation in Dynamic Environments . . . . 15
1.6.4 Perceptual Characterization of Early and Late Reflections for Auditory Displays . . . 16
1.7 Organization . . . 17
2 Psychoacoustic Evaluation of Interactive Sound Propagation . . . 19
2.1 Introduction. . . 19
2.2 Background . . . 21
2.2.1 Diffraction . . . 21
2.2.2 Reverberation . . . 21
2.2.3 Geometric Acoustics. . . 22
2.2.4 Numerical or Wave-based Acoustics . . . 23
2.2.4.1 Adaptive Rectangular Decomposition . . . 23
2.2.5 Related Work . . . 24
2.3 Experiment 1: Diffraction Study . . . 25
2.3.1 Participants . . . 25
2.3.2 Apparatus . . . 25
2.3.3 Stimuli . . . 25
2.3.4 Design and Procedure. . . 27
2.3.5 Results . . . 29
2.4 Experiment 2: Reverberation Study I . . . 30
2.4.1 Participants . . . 31
2.4.2 Apparatus and Stimuli . . . 31
2.4.3 Design and Procedure. . . 32
2.4.4 Results . . . 32
2.5 Experiment 3: Reverberation Study II . . . 34
2.5.1 Participants . . . 34
2.5.2 Apparatus . . . 35
2.5.3 Stimuli . . . 35
2.5.4 Filter calibration . . . 35
2.5.5 Design & Procedure . . . 35
2.5.6 Training . . . 36
2.5.7 Method . . . 36
2.5.8 Results . . . 37
2.6 Analysis . . . 37
2.6.1 Diffraction Study . . . 37
2.6.2 Reverberation Study . . . 38
3 Mode-Aware Sound Propagation . . . 41
3.1 Introduction. . . 41
3.2 Related Work and Background . . . 43
3.2.1 Sound Synthesis for rigid-bodies . . . 43
3.2.2 Sound Radiation and Propagation . . . 44
3.2.2.1 Sound Radiation . . . 45
3.2.2.2 Geometric Sound Propagation . . . 46
3.2.3 Coupled Synthesis-Propagation . . . 47
3.3 Overview . . . 47
3.4 Coupled Synthesis-Propagation . . . 50
3.4.1 Single-Point Multipole Expansion . . . 50
3.4.2 Mode-adaptive Sound Propagation . . . 51
3.4.3 Hankel Approximation . . . 52
3.5 User-Evaluation of Hankel Approximation . . . 55
3.6 Implementation and Results . . . 58
3.6.1 Results . . . 60
3.6.2 Analysis. . . 61
3.7 Limitations, Conclusion and Future Work . . . 63
4 Diffraction Kernels for Interactive Sound Propagation . . . 65
4.1 Introduction. . . 65
4.2 Related Work . . . 67
4.2.1 Wave-Based Methods . . . 67
4.2.2 Geometric Acoustics and Diffraction . . . 68
4.2.3 Hybrid Methods . . . 69
4.3 Acoustic Field & Diffraction Kernel . . . 69
4.3.1 Acoustic wave equation . . . 70
4.3.3 Source Placement . . . 72
4.3.3.1 Visual Symmetry vs. Scattering Field Symmetry . . . 72
4.3.3.2 Multi-stage Algorithm . . . 72
4.3.4 Diffraction Kernel Computation . . . 76
4.4 Interactive Ray Tracing with Diffraction Kernels . . . 76
4.4.1 Coupling between ray and diffraction kernels . . . 78
4.5 Implementation & Results . . . 79
4.5.1 Performance and Comparisons . . . 79
4.5.2 Benchmarks . . . 80
4.6 Analysis . . . 81
4.6.1 Source Placement . . . 82
4.6.2 Diffraction Kernel . . . 83
4.6.3 Monte-Carlo Sampling . . . 83
4.7 Perceptual Evaluation . . . 84
4.7.1 Participants . . . 86
4.7.2 Apparatus . . . 86
4.7.3 Stimuli . . . 86
4.7.4 Design and Procedure. . . 86
4.7.5 Results . . . 88
4.8 Conclusions, Limitations and Future Work . . . 88
5 Perceptual Characterization of Early and Late Reflections for Auditory Displays . . . 90
5.1 Introduction. . . 90
5.2 Related Work . . . 92
5.2.1 Reverberation . . . 92
5.2.1.1 Reverberation Time (RT60): . . . 92
5.2.1.2 Mean-Free Path . . . 93
5.2.3 Early & Late Reflections: Psychoacoustics . . . 94
5.2.4 Estimating Reverberation Parameters . . . 94
5.3 Perceptual Evaluations and P-Reverb . . . 95
5.3.1 Experiment I - Just-noticeable difference of ERs . . . 95
5.3.2 Experiment II - Relationship betweenJ N Der&J N Dlr. . . 98
5.3.3 P−ReverbMetric . . . 100
5.4 Results & Evaluation . . . 103
5.4.1 Mean-Free Path Computation . . . 104
5.4.2 RT60usingP−ReverbComputation . . . 104
5.5 Interactive Sound Propagation . . . 106
5.5.1 Sound Propagation usingP −Reverb. . . 107
5.5.1.1 Precomputation . . . 107
5.5.1.2 Runtime . . . 108
5.5.2 Benchmarks . . . 108
5.6 Conclusion, Limitations and Future Work . . . 108
6 SUMMARY AND CONCLUSIONS . . . 110
6.1 Summary of Results . . . 110
6.2 Limitations . . . 111
6.3 Future Work . . . 111
LIST OF TABLES
3.1 Equivalence test results for the three scenes. The equivalence interval was±2.2
while the confidence level was 95% . . . 58 3.2 We show the performance of our runtime system (mode-adaptive propagation).
The number of modes for Tuscany and Auditorium is the sum over all sources used. The number of modes and number of paths were chosen to give a trade-off for speed vs. quality. All timings are in milliseconds. We show the breakdown between ray-tracing based propagation (Prop.) and pressure (Pres.) computation and the total (Tot) time per frame on a multi-core PC. #S is the number of sources
and #M is the number of modes. . . 58 3.3 We show the characteristics of SPME for different geometries and materials. . . 60 3.4 The speed-up obtained using the Perceptual-Hankel approximation. We achieve
at least3−7x speed-up with no loss in the perceptual quality of sound. Here, F-Hankel stands for Full-Hankel while P-Hankel stands for Perceptual-Hankel.
The results for Tuscany and Auditorium are averaged over all the sources. . . 62 3.5 The table shows how controlling the number of rays and the number of modes
can influence the timing in the Cathedral scene with a bell. This can help one customize the system to provide the best quality/performance ratio for a particular scenario. The total time taken is propagation time + time for chosen number of
modes. All times are reported in milliseconds. . . 63
4.1 A table of important mathematical symbols used in the text. . . 70 4.2 Diffraction Kernel Computations: The table highlights the geometric
complex-ity, size of objects (meter), maximum frequency, running times for computing the diffraction kernel of different objects. The value of |S|is 1922 in all the benchmarks. The speedups obtained using our source placement algorithm are
highlighted in the last column. . . 81 4.3 Runtime Performance Analysis: We highlight the performance of our
interac-tive sound propagation algorithm on a desktop multi-core PC. We highlight the number of diffraction objects (D-objects), precomputation time (PreC) in hours and the average frame time (ms) on a multi-core desktop CPU. Our algorithm can perform interactive sound propagation in dynamic scenes with specular and diffuse
5.1 Mean-free path Computation: We show the accuracy of computingµer using early reflections for differently shaped rooms. The closed-form expression in Eq 5.3 gives us the analytical value for the mean-free paths in each of the roomsµan. We observe that ERs can closely approximate the analytically obtainedµan. The Room with Pillars is shown in Fig. 5.8. Even for a scene with multiple obstacles, our method computes the mean-free path while inducing a maximum error of only
3%. . . 104 5.2 Mean-Free Path and Reverberation Time Computation:We show the average
values computed using high-order ray tracing for the three different regions shown in Fig. 5.9 and the differences from the average values. Each of these rooms corresponds to imperceptible regions based on our P −Reverb metric. The numerical value shows a maximum variation of5%, which is within JND values ofRT60. The exactRT60 was computed using high-order ray tracing with300
bounces. . . 106 5.3 Precomputation Performance Analysis: We highlight the speed-up in
precom-putation stage using theP −Reverbmetric. #P is the number of points along the listener path,TERis the avg. time taken at each point using ERs,TLR is the average time taken at each point using LRs, and #P is the number of clusters
LIST OF FIGURES
1.1 Overview of our work: The figure shows the various components of our work. We consider sound propagation as a combination of three distinct phenomena: Source directivity, diffraction, and reverberation. Then, user evaluations tell us if numerical accuracy matters perceptually. These results are then utilized to design
more perceptually accurate and efficient algorithms . . . 11 1.2 Overview of the results of our user studies:. a) The loudness perception for a
sound source behind an obstacle and multiple listener positions around it in an open environment. The figure on top is the result for geometric diffraction (UTD), while the one below is for wave-based diffraction. b) The results of the room size perception experiment using two different reverberation algorithms. c) The results
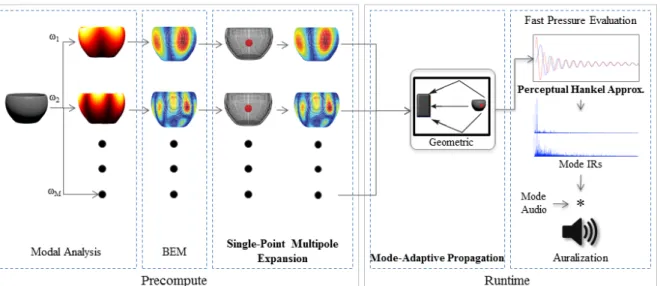
of the auditory distance perception experiment using two different reverberation algorithms. . 12 1.3 Overview of our coupled synthesis and propagation pipeline for interactive
virtual environments:. The first stage of precomputation comprises the modal analysis. The figures in red show the first two sounding modes of the bowl. We then calculate the radiating pressure field for each of the modes using BEM, place a single multipole at the center of the object, and approximate the BEM evaluated pressure. In the runtime part of the pipeline, we use the multipole to couple with an interactive propagation system and generate the final sound at the listener. We
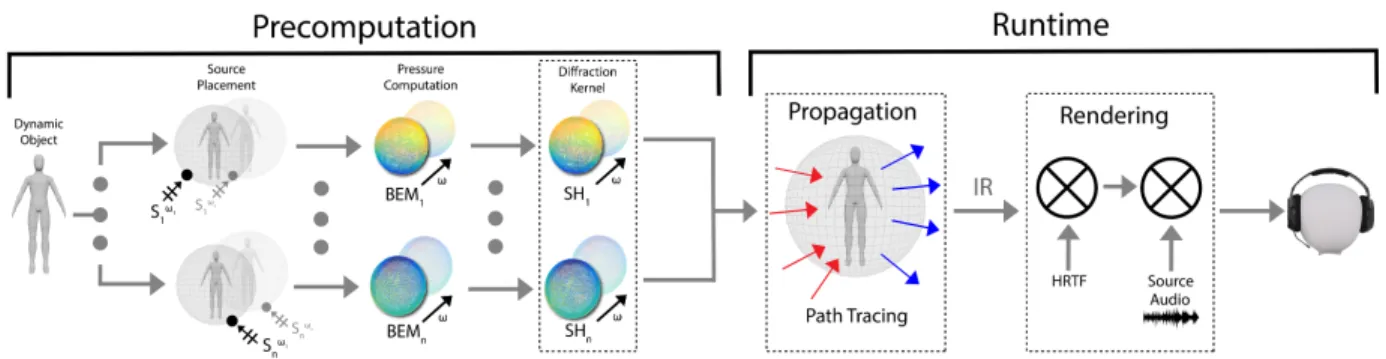
present a new perceptual Hankel approximation algorithm to enable interactive performance. 14 1.4 Interactive Sound Propagation and Rendering: We highlight different stages
of our novel sound propagation and rendering pipeline, which uses per-object diffraction kernels. In the precomputation stage, we adaptively perform BEM simulations for certain directions (computed using our novel source placement algorithm) and measure the outgoing pressure fields produced by the scattering of plane waves at various frequencies. These pressure fields encode the scattering as a function of frequency and the input and output directions. These fields are then converted into an efficient spherical harmonic representation called the diffraction kernel. At runtime, the diffraction kernel is coupled with an interactive path tracing
algorithm to simulate sound propagation and auralization in dynamic scenes. . . 15
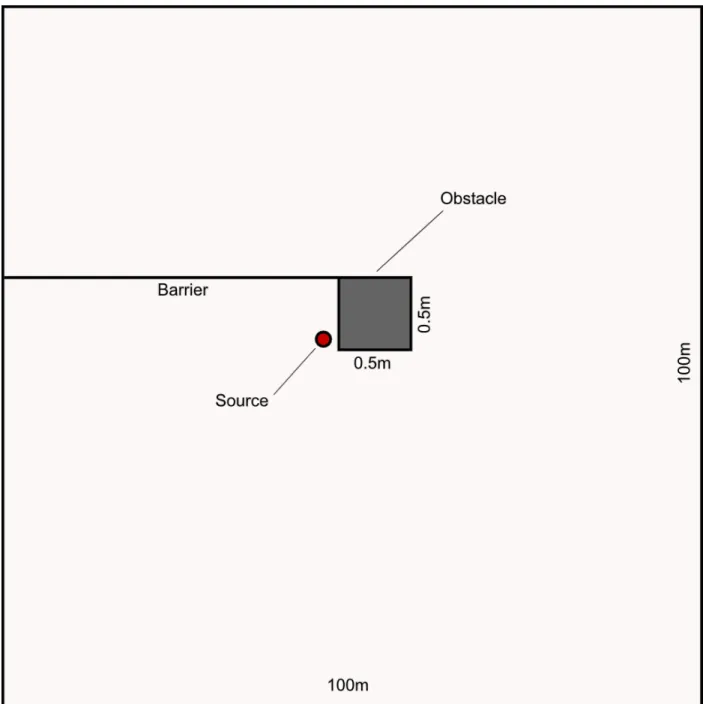
2.1 The figure shows the setting used for characterizing diffraction. The obstacle was 0.5m x 0.5m. The solid barrier prevents the sound from reaching the listener from behind the obstacle. The barrier and the obstacle are fully absorptive to prevent any reflections and making sure only the diffracted sound reached the listener. The
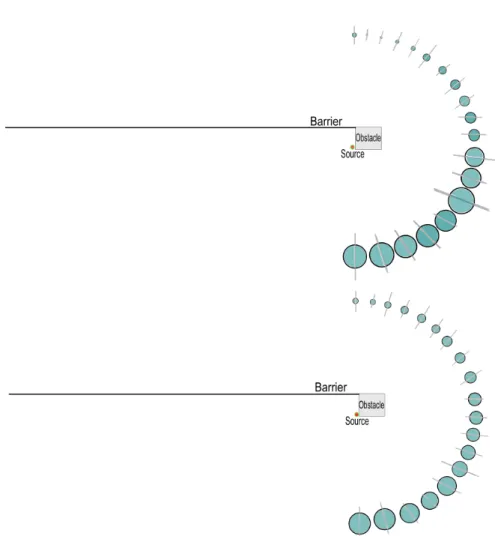
2.3 Mean subject ratings for different positions along a semi-circle for two methods of diffraction, plus one direct sound region. The cross-hatches show the between-subjects standard deviation of the responses. The upper figure shows the results for the UTD-based diffraction while the lower one shows results for wave-based diffraction. Wave-based diffraction shows a strongly linear decay while the
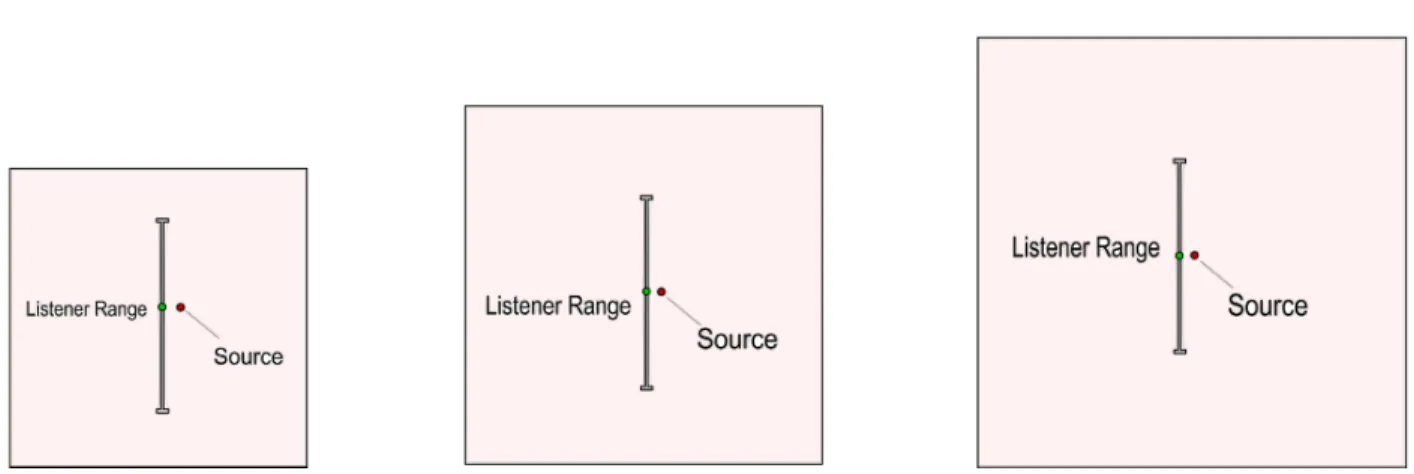
UTD-based diffraction shows considerable deviation from linear decay. . . 29 2.4 The reverberation experiment setup consisted of seven cubes of increasing
dimen-sion three of which are shown here. The listener path length in all the cubes was
the same. . . 30 2.5 The average subjective magnitude given by the subjects for the two reverberation
conditions across the three blocks of trials. The IR-based reverberation starts doing better as the experiment progresses and starts showing a logarithmic relation between the volume of the room and perceived reverberant intensity (Purple dotted
line in Block 3 is the log fit). The reverberation filter shows no such learning effect. . . 33 2.6 The room used for the experiment. The path marked in red is the walking path
along which the subject walks. The sound sources are perpendicular to the walking path and kept at increasing distances from it. The labels 1-7 show the different
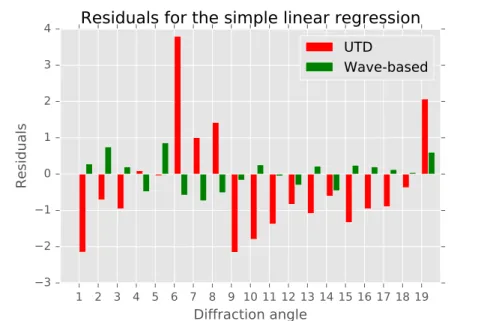
source distances sampled uniformly from the range 10-40m . . . 36 2.7 The residual error from the simple linear regression for both diffraction methods.
As is clearly evident, UTD-based diffraction shows high error when trying to fit its response to a straight line as compared to the wave-based method. The X-axis
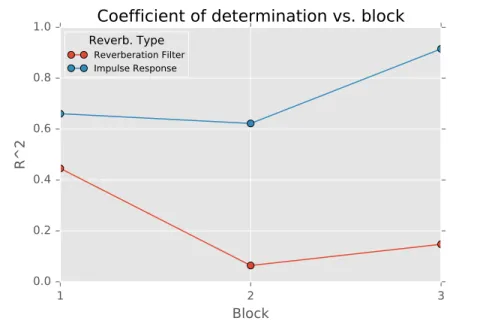
represents the19equi-spaced diffraction angles ranging from0◦to180◦ . . . 38 2.8 The value ofR2for the reverberation types across all the three trial blocks. . . 39
3.1 Overview of our coupled synthesis and propagation pipeline for interactive virtual environments. The first stage of precomputation comprises the modal analysis. The figures in red show the first two sounding modes of the bowl. We then calculate the radiating pressure field for each of the modes using BEM, place a single multipole at the center of the object, and approximate the BEM evaluated pressure. In the runtime part of the pipeline, we use the multipole to couple with an interactive propagation system and generate the final sound at the listener. We present a new perceptual Hankel approximation algorithm to enable interactive performance. The
stages labeled in bold are the main contributions of our approach. . . 47 3.2 The error between the Hankel function approximation˜h(2)l (kd)and the original
functionh(2)l (kd)decreases at increasing values ofdfor orderl = 6and mode frequency1000Hz. An error threshold of= 5dB SPL is overlaid. For this case, the approximation threshold distance is chosen to bed˜h= 93m. All sound paths
for this mode frequency withd >93m use this approximation. . . 55 3.3 Mean and standard errors of the subjects’ scores on the user-study. Full refers to
sound computed using Full Hankel, while Approx refers to sound computed using our perceptual approximation. The response is to the question,”Compared to the
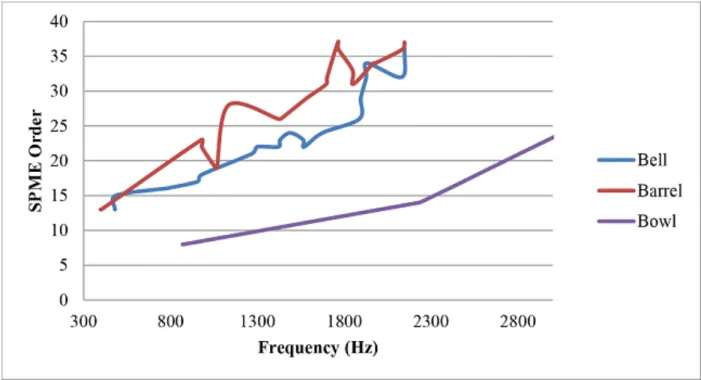
3.4 The order required by the Single-Point multipole generally increases with increas-ing modal frequency. We show the results for the objects used in our simulations. It is possible for the same modal frequency (for different objects) to have differ-ent order multipole owing to difference in geometries of these objects. The plot shows the SPME order required for approximating the radiation pattern of different
objects as a function of their increasing modal frequencies. . . 61 3.5 The Auditorium Music Scene. This scene includes multiple sources playing a
musical composition. . . 62 3.6 For an increasing error threshold, the order of the multipole decreases almost
quadratically. This demonstrates our SPME algorithm provides a very good
ap-proximation. . . 63
4.1 Interactive Sound Propagation and Rendering: We highlight different stages of our novel sound propagation and rendering pipeline, which uses per-object diffraction kernels. In the precomputation stage, we adaptively perform BEM simulations for certain directions (computed using our novel source placement algorithm) and measure the outgoing pressure fields produced by the scattering of plane waves at various frequencies. These pressure fields encode the scattering as a function of frequency, the input and output directions and converted into an efficient spherical harmonic representation called the diffraction kernel. At runtime, the diffraction kernel is coupled with an interactive path tracing algorithm
to simulate sound propagation and auralization in dynamic scenes. . . 68 4.2 Overview of our source placement algorithm:We use a novel source placement
algorithm to compute the representative source positions for each object: (a) Given a scatterer (human), we consider a densely sampled sphere around it; (b) For each pointsion the sphere the projected area and viewed curvatures are computed; (c) The curvature values are binned into histogramsHiand together with the projected areaAigive a shape signatureSSiatsi. (d) These shape signatures are used to compute geometric similarity between different viewpoints. (e) Points are grouped together if their shape signatures are within error thresholdsAandH. The overall
algorithm results in1−2order of magnitude improvement in the precomputation stage. . . 71 4.3 Similar Shape Signatures: We highlight different points that have similar shape
signatures. Each set of points with the same color on the sphere corresponds to a set that is computed as geometrically invariant and will be represented using a single sound source. (a) The source placement automatically detects symmetry in the model which is bilateral in this case; (b) shows another viewpoint and the since
no symmetry exists in that plane, the two hemispheres have different colors. . . 74 4.4 Reflection symmetry detection: Given a cluster of points with similar shape
signatures (a) we perform a pair-wise comparison of the boundaries and compute Hausdorff distance; (b) Boundaries B1 andB2 that nearly overlap after being reflected result in a large drop of their Hausdorff distances, whileB3andB4do not exhibit reflection symmetry with each other or withB1orB2’ (c) A relative
4.5 We highlight how the diffraction kernelD(x,y, ω)can be integrated into Monte Carlo path tracing using two-way coupling. When an incoming ray with direction xstrikes a diffracting object, the ray is scattered in a randomly chosen directiony with probability density functionP(y). The diffraction kernel in the directionyis evaluated at the four corners of the quad intersected byx, and the resulting pressures D(x1,y, ω),D(x2,y, ω),D(x3,y, ω), andD(x4,y, ω)are bilinearly interpolated according toxto yield the pressure transfer functionD(x,y, ω). The energy carried
by the ray is then multiplied by D(x,y,ω)P(y) 2 to get the output ray energy. . . 77 4.6 The plot shows the heat map error introduced by our source placement algorithm
for three different objects. The error is computed on a sphere representing all the incoming directions for the diffraction (S). Given the source positions (RP) computed by our source placement algorithm, we run BEM at these points and interpolate the field for the rest of the points inSusing reflection and/or rotation. The plots here show the MAE at each point onS by unwrapping it on to a 2D plane. The horizontal axis represents the latitude while the vertical represents the longitude. As can been seen, even for complex objects at high frequencies, the
error introduced by our source placement algorithm is<2 dB. . . 83 4.7 The plot shows the variation of the relative error when trying to represent a
diffracted field of a human in a spherical harmonic basis. As can be seen, the error increases sharply with frequency and low SH-order but stays close to zero with high order spherical harmonic. High-order spherical harmonics are more expensive
to evaluate and tend to be numerically unstable . . . 84 4.8 We compare the sound pressure field for an object (human) computed using our
modified ray tracing algorithm (Section 4) vs. BEM (wave-based solver). We perform a dense ray sampling using the diffraction kernel to compute the pressure field in the left figures. The red arrows indicate the incident direction of the plane-wave. We use100×100grid to sample at each point and filter them through the diffraction kernel to compute the angular variation in the diffracted sound field. The pressure values are in Pascals and we demonstrate the results for two different frequencies, where diffraction effects are prominent. These benchmarks show a close match between the sound fields computed using our method vs. BEM. In practice, our approach can perform these computations at interactive rates, where
BEM solver can take minutes. . . 85 4.9 The figure shows the setup used for the user study that compared the psychoacoustic
characteristic of our diffraction kernel based algorithm with BEM-based wave propagation algorithm. We considered5equi-spaced points in the shadow region (black) of the obstacle(green). The obstacle is a column and only the diffracted sounds are audible in the shadow region. We evaluated the auditory perception
5.1 We highlight the different components of the sound field. The sound directly reaching the listener is called the direct sound, the reflections that reach in the first
80ms are called early reflections (ERs), while the reflections following the early reflections that show a decaying exponential trend are called late reflections or reverberation (LRs). OurP−Reverbmetric presents a new perceptual relationship
between ERs and LRs and we use it for fast sound rendering. . . 92 5.2 The psychometric function for sound rendered using the early reflections for the
4 frequency bands. The Y-axis shows the proportion of responses indicating the sounds were different. We see a clear, linear trend between increasing µ and the probability of responding different, until the last roomµ = 2.2, where the
responses seem to flatten out. . . 97 5.3 The average JND over the frequency bands. The Y-axis shows the proportion of
responses indicating that a difference was judged. The psychophysical function is essentially linear, showing that the probability of judging the sounds as different
increases linearly with the increasing mean-free paths of the rooms. . . 98 5.4 The psychometric function for sound rendered using the full impulse response(LR)
for the4frequency bands. The Y-axis shows the proportion of responses indicating sounds were judged to be different. In this case, we observe more variability for the different frequency bands, which could be attributed to the greater sensitivity of human hearing to a more accurate signal (compared to the less accurate ER signal).
Overall, however, the responses can be modeled as a linear function with reasonable accuracy. 99 5.5 The average JND over the frequency bands for the full impulse response signal.The
Y-axis shows the proportion of responses indicating a judgment of difference. The psychophysical function is not as linear as the early reflection signal, but a linear function approximates the subject responses reasonably well (R2 = 0.87),
accounting for most of the variability. . . 100 5.6 This plot shows the overlaid psychometric functions for signals rendered using the
early reflections (blue) and full impulse response (orange). Note that the first data point corresponds to differences being reported when the stimuli are objectively identical. Although the full impulse data shows a greater departure from a linear relationship beyond that point, the results are similar to the early reflection function, offset by a constant, allowing us to establish a simple, linear relationship between
J N DerandJ N Dlrin terms of the mean-free path. . . 101 5.7 The psychometric function with a constant offset adjustment. We consider the ratio
of the mean-free path for the different rooms to the mean-free path of Room 1. The resulting linear fits for the two cases (early reflections and full impulse response) coincide once a constant offset of 0.02 is added to the ratio for the full impulse
response. This highlights the accuracy of our model. . . 102 5.8 Room with Pillars: We illustrate the room with8pillars and use this benchmark
to estimate the effectiveness of our mean-free path computation in complex envi-ronments with obstacles. We observe less than3%error using our early reflection
5.9 We highlight the application ofP−Reverbmetric to predict variations inRT60 in a scene composed of interconnected rooms of different shapes and volumes: (a) shows the variation inµalong a path that goes through three rooms with volumes 135m3, 256m3, and 125m3 from left to right; (b) shows three regions(1,2,3)
along the path roughly corresponding to the three rooms, whereµchanges within the JND specified by theP−Reverbmetric. This indicates that the reverberation in these regions would vary imperceptibly, as is indicated by the uniformity of theµvalues; (c) shows rapidly varyingµvalues as one approaches the apertures between the connected rooms, indicating thatRT60would also vary rapidly. This is expected because the geometry varies rapidly in these regions and validates the
accuracy of our perceptual metricP−Reverb. . . 105 5.10 The figure shows how theP−Reverbmetric can be used to estimate regions where
RT60would vary imperceptibly in a scene. The left figure shows a typical listener path in a scene. At each point along this path, we compute the mean-free pathµ using the early reflection based method described. Then using theP −Reverb metric, we cluster the points based on theJ N Dto give us clusters along the path
whereRT60would vary imperceptibly as shown in the right figure. . . 106 5.11 The figure shows the schematic of a typical Schroeder-type filter used in our
implementation. The input is processed through a parallel bank of comb filters that create the delayed version of the input signal. The output of this parallel bank goes through a series connection of allpass filters. These filters require parameters like
CHAPTER 1: INTRODUCTION
Sound is one of the most important senses available for conveying information about the world around us. It constitutes a fundamental mode of communication, entertainment, and education, among other things. Mathematically, sound is a pressure wave creating compression and rarefaction when traveling through a medium. These waves create changes in pressure that, upon reaching our ears, cause the eardrum to vibrate, which creates the sensation we call sound. Human hearing is only sensitive to a subrange of sound wave frequencies called thehuman hearing range(20Hz−20kHz).
Sound has many associated phenomena that have been studied both physically and psychophysically. Physically speaking, sound propagation constitutes the emanation of sound from a source, and transmission through an environment undergoing phenomena such as diffraction, reflections, scattering before reaching the listener. Once the sound waves reach the listener, they create the perception of sound and the study of these perceptual effects constitutes the psychophysical aspect of sound. The field of psychophysics that deals with studying the perception of sound is called psychoacoustics.
1.1 Motivation
visuals, better sound will enhance the user’s sense of realism. Sound propagation can be used to generate realistic environmental sound effects such as diffraction and reverberation for virtual sound sources placed in a real environment. Teleconferencing systems can benefit from sound propagation by considering the geometry and materials of the rooms in which the callers are located, making the remote callers sound like they are in the same room. Big architectural projects such as building auditoriums, hospitals, and airports can benefit tremendously from realistic sound simulation on their CAD models to achieve the desired aural characteristics before the projects are implemented, saving a lot of time and money. Similarly, classrooms can benefit from sound propagation to gauge the intelligibility of speech in all parts of a classroom before it is constructed.
While sound propagation numerically simulates acoustic phenomena, an equally important aspect of modeling sound is the perceptual study of these phenomena. Some of the earliest experiments in modern psychoacoustics were done by Hermann von Helmholtz (Von Helmholtz, 1912), who studied human hearing and the perception of music. Lord Rayleigh, in addition to his pioneering work on the physics of sound, did ground-breaking work in sound localization propounding his duplex theory (Rayleigh, 1907). With the advent of telephony, psychoacoustic measures concerning auditory thresholds, intensity discrimination, and frequency discrimination were established to reduce the bandwidth requirements of telephone lines (Fletcher and Galt, 1950; Fletcher, 1953). As sound made its way into virtual environments, a whole new realm of applied psychoacoustics was developed dealing with not only the perception of sound in these environments but also how the environmentsthemselvesaffect the perception of sound. A typical example of this type of work is experiments on sound localization in virtual environments (Begault and Trejo, 2000) and the associated studies of the head-related transfer functions (HRTF) (Wenzel et al., 1993; Algazi et al., 2001; Kistler and Wightman, 1992) that are either numerically or experimentally synthesized. An interesting example of the virtual environment itself affecting a psychoacoustical phenomenon is that of auditory distance perception which is the ability to discern the distance to a sound source based on the sound. In real-life, auditory distance perception is compressive (Bronkhorst and Houtgast, 1999), but when coupled with a virtual environment, the compression characteristics change (Zahorik, 2002).
1.2 Psychoacoustic Evaluation of Interactive Sound Propagation Algorithms
Evaluation of Approximate and Accurate Diffraction Simulation Diffraction is a very important, yet psychoacoustically understudied, phenomenon referring to the bending of sound around obstacles. Diffraction helps a listener hear sounds not in the line- of-sight and is observed in everyday life (Tsingos et al., 2001a). The acoustic wave equation explains the phenomenon; hence, wave-based methods simulate it automatically. Geometric methods, on the other hand, work on the simplifying assumption of rectilinear propagation of sound cannot account for it intrinsically, must incorporate diffraction externally. This has been done by incorporating methods such as the uniform theory of diffraction. (Kouyoumjian and Pathak, 1974). With the advent of better algorithms and faster hardware, realtime diffraction is now used for interactive geometric propagation (Schissler et al., 2014a; Tsingos et al., 2001a). Few psychoacoustical studies have been performed on diffraction. (Torres and Kleiner, 1998) conducted a study investigating the audibility of diffracted sound for a simple open geometry and found that diffracted sound is audible in non-shadow regions. (Torres et al., 2001a) performed listening tests to compute the audibility of edge diffraction in a stage house and found that first order diffraction is significantly more audible than second order diffraction. However, none of these studies considered interactive sound propagation algorithms or virtual environments and they were done in actual, physical environments. (Mehra et al., 2015) conducted experiments to evaluate the subject localization performance using wave-based and geometric propagation and found that diffraction helped the subjects localize faster. However, this study did not consider diffraction as a separate phenomenon from other acoustic effects, necessitating the comparative study of diffraction as computed by an accurate (wave-based) and an approximate (UTD) method.
and speech intelligibility, reverberation is known to a have positive impact on externalization, environment size estimation, and auditory distance perception. (Begault, 1992) conducted studies to show that spatial reverberation increases externalization. (Hameed et al., 2004) assessed reverberation parameters (RT60 andDRR) and their effect on room size estimation, finding thatRT60is the most important in this regard. (Cabrera et al., 2005) performed studies in real and virtual rooms to investigate the role of various parameters, while (Pop and Cabrera, 2005) performed experiments in three real rooms to find a negative relation between sound level and room size perception. Reverberation parameters such as direct-to-reverberant ratio(DRR)
are known to increase auditory distance perception (Mershon and King, 1975). (Richards and Wiley, 1980) showed the effect of reverberation on auditory distance perception in outdoor environments. (Bronkhorst and Houtgast, 1999) formulated a computational model of auditory distance perception as a function of theDRR showing that increases in simulated reflections of sounds in virtual environments can result in increased auditory distance perception.
Given the strong effect reverberation has on human auditory perception, most virtual environments incorporate it either using approximate reverberation filters or a geometric acoustic system. Reverberation filters use a combination of nested all-pass and comb filters to produce a series of decaying echoes. These filters require setting reverberation parameters such asRT60andDRRto model reverberation. SinceRT60 requires either real-world measurements or accurate simulation to estimate, a well-known empirical formula called the Sabine’s equation is used to estimateRT60. Sabine’s equation establishes the relationship between the volume, surface area, and absorptivity of the room and is given by:
RT60≈0.1611sm−1 V
Sa, (1.1)
1.3 Accurate Simulation of Sound Propagation Effects
Modeling sound propagation involves simulating the constituent phenomena such as scattering, diffrac-tion, early reflections, and late reverberation. As mentioned above, research in simulating these phenomena has yielded three distinct categories of methods: heuristic or parametric filters, geometric methods, and wave-based methods.
Typically, parametric filters are used to simulate reverberation based on reverberation parameters of the environment; hence, these filters are also called artificial reverberators.These reverberators typically fall into three distinct categories: delay networks, convolutional, and room models. Out of the three, delay networks are by far the most commonly used because of their low computational complexity. The first artificial reverberator was introduced by Schroeder (Schroeder and Logan, 1961) and is an example of a delay network based reverberator. It uses digital nested allpass filters in combination with a parallel bank of comb filters to produce a series of decaying echoes. These filters require parameters such as reverberation time(RT60)
and direct-to-reverberant ratio(DRR)to tune the allpass and comb filters. An important improvement to Schroeder’s filter was made by Moorer (Moorer, 1979) who added one-pole filters to Schroeder’s filter to enable setting(RT60)in a frequency-dependent way. Another important type of delay network filter is the Feedback Delay Network (FDN) introduced by Jot and Chaigne (Jot and Chaigne, 1991). Despite its age, the Schroeder filter remains the most widely used artificial reverberator due to its simplicity and low compute requirements.
and Biot-Tolstoy-Medwin (BTM) (Biot and Tolstoy, 1957) have been incorporated into interactive geometric acoustic systems (Tsingos et al., 2001a; Antani et al., 2012b).
Wave-based methods solve the underlying mathematical formulation that governs sound phenomena (the acoustic wave-equation) numerically to generate accurate results. The acoustic wave-equation is a second order partial differentiation equation given in the time domain as:
∇2p− 1 c2
∂p2
∂2t =F(x, t) x∈Ω, (1.2)
where∇2 is the Laplacian,pis pressure,c= 343ms−1 is the speed of sound,F(x, t)is the forcing term corresponding to the source, andΩis the domain of interest. Equivalently, it can be expressed in the frequency domain as the Helmholtz equation:
∇2p+ ω
2
c2p= 0, x∈Ω, (1.3)
wherep=p(x, ω)is the complex-valued pressure field,ωis the angular frequency,cis the speed of sound in the medium, and∇2is the Laplacian operator.
Methods solving the frequency domain Helmholtz equation are based on the finite element method (FEM) (Zienkiewicz et al., 2006) which discretizes the entire domain volume, and the boundary element method (BEM), which only discretizes the surface or boundary of the domain in question. (Cheng and Cheng, 2005; Liu and Nishimura, 2006; Gumerov and Duraiswami, 2009). Time-domain methods for solving the acoustic wave-equation include methods such as the finite-difference time domain (FDTD) (Yee, 1966; Taflove and Hagness, 2005), which uses finite-differences and iterates over the time steps. Stability requirements for these methods mandate time step sizes that make these methods scale linearly with the volume of the scene and, by the fourth-order with the increasing frequency of simulation. Other, more efficient, time-domain methods include adaptive rectangular decomposition (ARD) (Raghuvanshi et al., 2009) and the pseudo-spectral time domain (PSTD) (Liu, 1997). These methods can accurately model all acoustic phenomena but their high precomputation and runtime costs limit their application to interactive sound propagation in static virtual environments.
Modal Source Propagation Research in sound simulation can be broadly categorized into two different groups: sound synthesis and sound propagation. While sound propagation deals with how sound interacts with the environment, sound synthesis deals with how a source itself produces sound based on its physical characteristics when provided with an external impulse, e.g., hitting a bell (O’Brien et al., 2002a; Raghuvanshi and Lin, 2006). While many standalone algorithms have been developed for each of these categories, these methods tend to be mutually exclusive. Rigid sound sources vibrate on being applied on impact, but the final sound we hear is these vibrations that propagate through the environment. Existing methods can model the propagation of these vibrations infreespace(James et al., 2006a), but no method can handle the propagation of the complex vibrational modes through an environment while accounting for the specific directivities of vibrational modes on the object. In other words, there is a need for a method that cancouplethe modally synthesized sound with sound propagation to give us mode-aware sound propagation.
Diffraction refers to the bending of sound waves around obstacles when the object dimensions are parable to the wavelength. Few virtual acoustic systems incorporate diffraction because of the high com-plexity of simulating it. Geometric acoustic systems use methods such as the uniform theory of diffraction (UTD)(Kouyoumjian and Pathak, 1974) and Biot-Tolstoy-Medwin (BTM) (Biot and Tolstoy, 1957) to approx-imate diffraction. These methods have been incorporated into existing geometric acoustic systems (Tsingos et al., 2001a; Antani et al., 2012b), but these are approximate methods that only work for very simple objects. Further, the cost of these methods increases quadratically off of which sound must diffract. Wave-based techniques incorporate all the associated wave effects, including diffraction. As explained above, however, these methods have very high computation requirements, especially during the precomputation stage, and can only work in realtime virtual environments for scenes with limited number of sources and limited dynamism (Mehra et al., 2013; Raghuvanshi et al., 2009). Some hybrid methods (Yeh et al., 2013) combine the speed of geometric methods with the accuracy of numerical methods but suffer from some of the same drawbacks as the wave-based methods, i.e. large compute requirements for precomputation. Therefore, it is important to develop methods for simulating diffraction that have both a low precomputation and a low runtime overhead while having an accuracy comparable to wave-based methods.
systems incorporate reverberation to various degrees of accuracy. The first attempt at simulating reverberation was through the use of artificial reverberators (Schroeder and Logan, 1961), which are parametric filters that use combinations of all-pass and comb filters to create delayed and attenuated versions of the input signal to simulate repeated reflections. These methods work well when the parameters of the filters are tuned based on the actual physical parameters such as theRT60andDRR, but estimating these parameters requires running simulations or doing actual acoustical measurements. Hence the parametric filters are normally tuned based on the sound designer’s intuition of what the reverberation would sound like in that particular space making these methods inaccurate. However, artificial reverberators are still widely used in virtual acoustic systems such as game engines because of their simplicity and low computational overhead. Another way in which reverberation is simulated in virtual environments is through geometric acoustic systems. Since reverberation is repeated reflections of sound in an environment as the sound decays, geometric acoustic systems simulate this by repeating reflections of the geometric primitive (rays, frusta, beams) reducing the energy of the primitive with each bounce based on the material parameters of the surface. Typically, these systems can only compute a few orders of specular reflections for realtime environments (Chandak et al., 2008; Funkhouser et al., 2004; Vorl¨ander, 1989), but recent developments in geometric acoustics have made it possible to get accurate reverberation using high-order specular and diffuse reflections(Schissler et al., 2014a; Schissler and Manocha, 2017) at interactive rates for multiple sources. Although this makes accurate reverberation possible at interactive rates, these methods need at least the computational power of a mid-range desktop machine. With virtual reality moving to low-powered devices (e.g., mobile), there is a need to simulate reverberation that is both plausible and low in its computational requirements.
1.4 Challenges
framework. (James et al., 2006a) introduced the idea of using multipole basis functions to compute the propagated sound of these individual modes, but this work only considers freespace propagation. While the idea of multipole basis functions can be extended to environmental sound propagation within the framework of a wave-based system, the high frequencies often generated by small rigid-bodies would be well beyond the capabilities of the current generation of wave-based techniques. Current geometric methods offer the best way to couple modal sounds with a propagation engine for all mode frequencies by weighting the rays using the multipole basis functions. This presents a significant challenge in terms of maintaining interactivity because tens of thousands of rays would be needed to get artifact free sound, and each one of these rays would have to be weighted using these complex and expensive multipole basis functions.
Diffraction has long been challenging to simulate accurately, especially for geometric systems. The state-of-the-art geometric system (Schissler et al., 2014a) incorporates the uniform theory of diffraction method and can handle high-orders of diffraction at interactive rates. However, it can only do so for objects with few edges or simplified versions of complex objects. Wave-based methods, as mentioned, handle diffraction for any object shape, but their exorbitant precomputation costs make them impractical for most applications. Further, these methods often only work in static scenes and can handle very few sources interactively. The state-of-the-art hybrid method (Yeh et al., 2013) offers the speed of geometric methods with the accuracy of wave-based methods, but it also suffers from very high precomputation costs that can reach on the order of weeks on desktop machines. This necessitate the use of high-performance compute clusters, which makes these methods impractical. We thus need a method that can significantly reduce the precomputation time for computing diffraction without sacrificing accuracy and that can work interactively at runtime.
sample points and precompute the reverberation parameters for each of those points. Depending on the size of the scene, however, thousands of such sample points might be needed for precomputation and even with a fast sound propagation system, computing the full reverberation characteristics of all those points might take too long for it to be practical. We thus need a way of computing reverberation on low powered devices that avoids expensive ray tracing at runtime andprecomputation, but that provides accurate reverberation parameters for tuning the digital reverberation filters.
1.5 Thesis Statement
The perceptual differentiation of acoustic effects such as modal source propagation, diffraction, and
reverberation is enhanced by accurate simulation, and can be modeled efficiently in immersive virtual
environments.
In this dissertation, we propose a set of experiments that evaluate the perceptual accuracy of various existing algorithms that simulate phenomena such as diffraction and reverberation. Based on the results of these experiments, we propose a set of efficient techniques to model challenging acoustic phenomena with a focus on interactive virtual environments. All the methods developed have runtime computation on the order of a few milliseconds and have been integrated with commercial game engines to highlight their efficiency in a variety of challenging scenarios. Figure 1.1 gives a high-level overview of the thesis’ flow.
1.6 Main Results
Figure 1.2: Overview of the results of our user studies:. a) The loudness perception for a sound source behind an obstacle and multiple listener positions around it in an open environment. The figure on top is the result for geometric diffraction (UTD), while the one below is for wave-based diffraction. b) The results of the room size perception experiment using two different reverberation algorithms. c) The results of the auditory distance perception experiment using two different reverberation algorithms.
1.6.1 Psychoacoustic Evaluation of Interactive Sound Propagation Algorithms
method. The first of these experiments evaluated the effect of the reverberation method on the perception of room size while the second experiment evaluated the effect of the two reverberation conditions on acoustic distance perception. In all three cases we saw a positive effect of the more physically-accurate algorithm over the approximate algorithm. (Figure 1.2)
1.6.2 Mode-aware Sound Propagation
Sound simulation research has focused on either sound synthesis or sound propagation, and many standalone algorithms have been developed for each domain. Although the current sound propagation methods can handle myriad sound sources and model their directional characteristics, none of these methods account for the modal characteristics of rigid sound sources that vibrate on impact (e.g., hitting a bell). The final sound we hear in such cases is the vibrations that propagate through the environment. In other words, the sounds we hear from these objects are coupled, i.e. the sound is synthesized when a source has an impulse applied to it and propagates through the environment in a manner defined by the vibrational characteristics of the sound (or their modes). In this work, we present an integration approach for coupling modal sound synthesis for rigid bodies with an interactive sound propagation system. The main contributions of this work are as follows:
1. First method that enables per-mode coupling of synthesis and propagation through single-point multipole expansion.
2. Interactive mode-adaptive propagation technique based on perceptually-driven Hankel function approxi-mation.
3. High degree of dynamism to model dynamic surface vibrations, sound radiation, and propagation for moving sources and listeners.
Figure 1.3:Overview of our coupled synthesis and propagation pipeline for interactive virtual environ-ments:. The first stage of precomputation comprises the modal analysis. The figures in red show the first two sounding modes of the bowl. We then calculate the radiating pressure field for each of the modes using BEM, place a single multipole at the center of the object, and approximate the BEM evaluated pressure. In the runtime part of the pipeline, we use the multipole to couple with an interactive propagation system and generate the final sound at the listener. We present a new perceptual Hankel approximation algorithm to enable interactive performance.
simultaneously. We have integrated our system with the Unity game engine and demonstrate the effectiveness of this fully-automatic technique for audio content creation in complex indoor and outdoor scenes.
Figure 1.4: Interactive Sound Propagation and Rendering: We highlight different stages of our novel sound propagation and rendering pipeline, which uses per-object diffraction kernels. In the precomputation stage, we adaptively perform BEM simulations for certain directions (computed using our novel source placement algorithm) and measure the outgoing pressure fields produced by the scattering of plane waves at various frequencies. These pressure fields encode the scattering as a function of frequency and the input and output directions. These fields are then converted into an efficient spherical harmonic representation called the diffraction kernel. At runtime, the diffraction kernel is coupled with an interactive path tracing algorithm to simulate sound propagation and auralization in dynamic scenes.
1.6.3 Diffraction Kernels for Interactive Sound Propagation in Dynamic Environments
In this work, we introduce the notion of diffraction kernels to incorporate plausible diffraction in an interactive sound propagation algorithm. Diffraction kernels encapsulate the diffraction sound interaction behaviors of individual objects in the free field by representing them in a compact spherical harmonic basis function. We precompute the diffraction characteristic using an accurate wave-based method. Since diffraction is a direction-dependent phenomenon, a significant amount of precomputation is required to capture the effect from all possible incident angles. To remedy this, we introduce a novel source placement algorithm that significantly reduces the precomputation time required to compute the complete diffracted field of an object. Our source placement algorithm clusters the incident source positions that are likely to produce similar or symmetric diffracted fields and computes the diffracted field for only one source per cluster, thus giving us a substantial speedup in the precomputation stage. The main contributions of this work are as follows:
• Handling of highly tessellated or smooth objects while modeling diffraction and occlusion effects. • General approach that can be integrated into existing geometric sound propagation methods.
Figure 1.4 shows the approach. We consider a densely sampled sphere around the object representing all possible incident angles for diffraction computation. Using our source placement algorithm we compute the incident angles that are expected to produce similar diffracted fields and cluster them together. An accurate wave-based solver (BEM) is run for one representative point per cluster and the diffracted fields for the other points in the cluster are interpolated from the representative point. The computed diffracted field is then represented in a spherical harmonic basis that we call diffraction kernels. We have performed extensive evaluation of the method and find that our approach results in a significant speedup (up to 130x) in the precomputation time and introduces a mean absolute error (MAE) of<2dB even for complex, highly-tessellated objects. The diffraction kernels are easily integrable with interactive sound propagation algorithms to produce plausible diffraction effects for highly complex objects.
1.6.4 Perceptual Characterization of Early and Late Reflections for Auditory Displays
Even though geometric sound propagation is interactive on PC-based systems, its compute and memory requirements are still too high for devices with limited resources such as mobile-based VR devices such as Oculus Go and Samsung GearVR. This becomes particularly evident in reverberant environments where the decay of sound energy is slow requiring multiple reflections to compute the reverberation. As an alternative, parametric reverb filters can approximate reverberation efficiently, but must be tuned by hand to match the reverberation characteristics of a given environment. This makes these filters a feasible option for resource-constrained platforms, but tuning of the filters poses a significant challenge since reverberation characteristics often vary within an environment requiring one to establish multiple reverb zones with different reverberation parameters. A viable approach to the problem could be the dense sampling of the scene at a multitude of points and using a high-fidelity sound propagation system to estimate the reverberation parameters (e.g., RT60) at each of these sample points and then using theseRT60values to Since computing late reverberation is a computationally expensive process, such naive preprocessing could take a long time.
introduce a novel, perceptually derived metricP −Reverbthat relates the just-noticeable difference (JND) of the early reflections to the late reverberation in terms of the mean-free path (MFP) of the environment. We conduct two extensive user evaluations that establish the JND of the early reflections and late reverberation in terms of the mean-free path of the environment. We then relate the two JNDs in terms of the mean-free path giving us theP −Reverbmetric. We demonstrate the use of the metric in speeding up the precomputation of late reverberation parameters (e.g.,RT60). The main contributions of this work are as follows:
• A novel, perceptually derived metric relating early reflections to the late reverberation (P−Reverb) • Two extensive user-studies establishing the JND of early reflections and JND of late reverberation in
terms of mean-free path of the environment.
• Significant speed-up in the precomputation ofRT60usingP −Reverbmetric.
1.7 Organization
The rest of this dissertation is organized as follows:
Chapter 2 presents various user studies evaluating the perceptual differentiation capabilities of current sound propagation methods by comparing their efficacy in modeling acoustic phenomena showcasing the advantages of using physically-accurate algorithms.
Chapter 3 presents an efficient method to couple modal sound synthesis with sound propagation using an efficient, perceptually-driven approximation of the Hankel function.
Chapter 4 presents an adaptive source placement algorithm for reducing the computation time of acoustic scattering problems. We also highlight the performance and effectiveness of this approach by coupling our algorithm to a geometric sound propagation system to compute diffraction effects from complex objects in real-time.
CHAPTER 2: Psychoacoustic Evaluation of Interactive Sound Propagation
2.1 Introduction
Sound plays a vital role in increasing the degree of realism in virtual environment (VE) systems (Begault et al., 1994; Larsson et al., 2002a) and other interactive applications such as video games. This observation has motivated the development of different sound propagation methods that are used to simulate how sound waves, emitted from a source, travel through an environment and interact with the objects before reaching a listener. These methods are used to model well-known acoustic phenomena such as diffraction, reverberation (comprising early reflections and late reverberation), and scattering. At a broad level, sound propagation methods are categorized into geometric (Krokstad et al., 1968a; Borish, 1984b; Allen and Berkley, 1979) and wave-based (Zienkiewicz, 2005; Yee, 1966; Cheng and Cheng, 2005) algorithms. While these computational techniques have been studied for many decades in different fields, only recent advancements in terms of new algorithms and fast hardware have enabled the development of interactive propagation systems that are useful for VE. These include interactive geometric methods based on ray tracing and beam tracing (Schissler et al., 2014a; Tsingos et al., 2001a; Taylor et al., 2009b; Funkhouser et al., 2004) that can simulate approximate diffraction, early reflections, and high-order late reverberation. Furthermore, advancements in scientific solvers (Mehra et al., 2013; Raghuvanshi et al., 2009; Webb and Gray, 2013; Mehra et al., 2015) have made it possible to compute highly accurate solutions to the wave equation for large domains, and thereby perform interactive sound propagation.
In this chapter, we mainly focus on two of the aforementioned phenomena: diffraction and late rever-beration (hereafter referred to as reverrever-beration). Early reflections were not considered here, as they are easy to simulate and have been widely studied in the literature (Haas, 1951; Djelani and Blauert, 2001). Reverberation is also a well-studied phenomenon in psychoacoustics and enhances immersion (Kuttruff, 2007). Despite this, one of its fundamental effects, namely, to convey the size of the environment remains relatively unexamined. Reverberation is typically approximated using artificial filters, and such filters are widely used in computer games and VE (Jot and Chaigne, 1991).
Therefore, we evaluate the reverberation computed in a physically accurate manner using an interactive, state-of-the-art geometric propagation system to a pre-computed (Schroeder-type) filter and evaluate their relative effectiveness in telling us the size of an environment. Perceptual effects of diffraction, although important (Torres et al., 2001b), are seldom evaluated in virtual environments primarily due to the complexity of modeling diffraction. Most interactive geometric sound propagation systems approximate edge diffraction based on Uniform Theory of Diffraction (UTD) (Tsingos et al., 2001a). Therefore, we evaluate the perceptual performance of diffraction effects computed using UTD with a numerically accurate solver that directly solves the wave equation. We report two separate comparative studies to evaluate whetherincreased numerical accuracy of sound propagation translates to perceptual differentiation.
In our diffraction study, we construct a virtual test scene similar to (Kawai, 1981) and perform a psychoacoustical evaluation. We evaluate the diffracted sound field around an obstacle by placing subjects along a semi-circle for the two methods: UTD and wave-based. The subjects are asked to rate the perceived loudness for different positions along the semi-circle. Our results show that wave-based diffraction results in a diffracted field that decays nearly linearly with an increasing diffraction angle, as compared to the UTD-based diffraction, which shows erratic behavior.
The rest of the chapter is organized as follows. In Section 2 we give a brief overview of the two acoustic effects and the corresponding techniques and algorithms used in the study to model them and their evaluation. Sections 3 and 4 describe the two studies, including their designs and procedures. Section 5 describes our evaluation metrics. In Sections 6 and 7 we discuss our results and their applications.
2.2 Background
In this section, we give a brief overview of the two sound phenomena, the methods used to model them, and the related work in psychoacoustic evaluation of these phenomena.
2.2.1 Diffraction
Diffraction refers to the bending of a wave around an obstacle when the obstacle’s dimensions are comparable to the wavelength of the wave. Diffraction helps a listener hear sounds not in the line-of-sight and is observed in everyday life (Tsingos et al., 2001a). Diffraction is explained through the wave equation; hence wave-based methods emulate it automatically. Geometric methods, on the other hand, assume rectilinear propagation of sound. As these methods do not account for the bending of sound rays around an obstacle, this effect must be incorporated separately. Doing so is difficult and computationally expensive, which is why most virtual environments avoid incorporating diffraction even though the theories for approximating its effects have existed for decades (Biot and Tolstoy, 1957; Kouyoumjian and Pathak, 1974). With the advent of better algorithms and fast hardware, real-time diffraction is now used for interactive geometric propagation (Tsingos et al., 2001a; Schissler et al., 2014a).
2.2.2 Reverberation
Reverberation forms the later part of the impulse response(IR) within closed environments. It is caused by successive reflections or ‘echoes’ as they diminish in intensity.
time (RT60) and clarity index (C50andC80) have been formulated (Kuttruff, 2007). We concern ourselves withRT60in this study.RT60is defined as the time it takes for the sound to decay by60dB.
Given the importance of reverberation to architectural/room acoustics, and complexity of simulating it from physical principles, empirical methodologies have been developed to artificially simulate reverberation in virtual acoustics such as digital and convolution reverberators. These reverberators are parametrized using a number of values, the most important of which is theRT60. We use a digital Schroeder filter for our evaluation as these filters are the most common form of digital reverberators in use today. A well-known empirical formula used to estimateRT60is Sabine’s equation, which gives the relationship between theRT60 of a room, its volume, and the total absorption by:
RT60≈0.1611sm−1 V
Sa, (2.1)
whereV is the total volume of the room inm3,S is total surface area inm2,ais the average absorption coefficient of the room surfaces, and Sais the total absorption in sabins. Another, more accurate, way to estimate theRT60of a room is to look at the room’s impulse response (RIR) and directly compute the time it took for the sound to decay by 60 dB as specified in ISO 3382-1:2009. This method involves a reverse cumulative trapezoidal integration to estimate the decay of the impulse response and using a linear least-squares fit to estimate the slope between 0 dB and -60 dB. This is the method we used to compute the RT60for our digital reverberator.
2.2.3 Geometric Acoustics
2.2.3.1 Uniform Theory of Diffraction
The Uniform theory of diffraction (Kouyoumjian and Pathak, 1974) is a high frequency approximation of the phenomenon of diffraction. These methods were initially developed for the propagation of light, but later used for sound (Tsingos et al., 2001a). UTD assumes that a diffracting edge is of infinite length and acts as a secondary sound source. Another assumption made by UTD is that the source and listener are far away as compared to the wavelength of sound. According to UTD, an incoming sound ray hitting an infinite wedge results in a cone of diffracted rays, and a single ray with the shortest distance to the listener (in a homogeneous medium) forms the diffracted field.
2.2.4 Numerical or Wave-based Acoustics
Sound propagation is governed by the acoustic wave equation (in time domain):
∇2p− 1 c2
∂p2
∂t2 =F(x, t) x∈Ω, (2.2)
where ∇2 is the Laplacian, p is pressure,c = 343ms−1 is the speed of sound, F(x, t) is forcing term corresponding to the source, andΩis the domain of interest.
Solving Eq. 2.2 gives us the sound pressureP at any point in the domain. Unfortunately, closed-form solutions to the wave equation only exist for the simplest of domains, and most solvers use numerical techniques. However, the complexity of these methods increases as a fourth power of the frequency.
2.2.4.1 Adaptive Rectangular Decomposition
2.2.5 Related Work
Reverberation and its effects have been widely studied in psychoacoustics. (Zannini et al., 2011) explored the effect of source localization in reverberant conditions and found that the localization deteriorates with changing reverberation times. (Hartmann, 1983) found that localization accuracy decreases in a reflecting room compared to the same absorbing room. (Rakerd and Hartmann, 1985) showed that reverberation has a considerable effect on localization even at low frequencies. (Gigu`ere and Abel, 1993) found localization was poorer in reverberant environments as compared to absorbing ones. Other studies involving reverberation have analyzed the impact of reverberation on speech clarity. (Knudsen, 1932) showed that the presence of reverberation reduces the number of sounds that are heard correctly. (Galster, 2007) found the relation between the Speech transmission index (STI) as a function of signal-to-noise ratio and the reverberant condi-tions and found speech intelligibility decreases significantly in a small, highly reflective rooms. Although reverberation decreases localization accuracy, it is known to have positive effects with respect to externaliza-tion. Externalization is defined as the perception of the sound source emanating from a point in the world in contrast to internalization where the sound appears to be emanating from within one’s own head. (Begault, 1992) conducted studies that showed that spatial reverberation increased externalization. Another important perceptual effect of reverberation is that of size estimation. (Hameed et al., 2004) conducted studies to assess the effect of two reverberation parameters: the reverberation timeRT60and the direct-to-reverberant energy ratio (D/R) ratio and found thatRT60is the most important parameter in room size estimation. (Cabrera et al., 2005) performed experiments using real and virtual rooms and investigated the role of various parameters including the reverberation time. They found reverberation strongly affects the room size perception. (Pop and Cabrera, 2005) tested the relationship between acoustical characteristics of a room and its perceived size for three real rooms. They found that a negative relation between sound level and room size.
localization performance using wave-based and geometric propagation and found that diffraction played a part in helping the subjects localize faster. However, this study did not consider diffraction as a separate phenomena from other acoustic effects.
2.3 Experiment 1: Diffraction Study
2.3.1 Participants
Sixteen subjects participated in this study with informed consent. The ages ranged from 22 to 28 (Mean = 24.6 with SD = 1.4, 2 females and 14 males). The participants were recruited from the staff and students at a university campus. All participants reported normal hearing.
2.3.2 Apparatus
The setup consisted of a Dell T7600 workstation with the sound delivered through a pair of Beyerdynamic DT990 PRO headphones. The subjects wore a blindfold. The software consisted of in-house code to auralize precomputed IRs. All code was written in C++.
2.3.3 Stimuli
The source consisted of a pre-recorded sound of a ringing bell. Since diffraction is a frequency-dependent phenomenon and more prominent at low frequencies, the bell clip was low-pass filtered with a cut-off frequency of 300 Hz. The choice of frequency range was motivated by:
• The edge-diffraction phenomena is most prominent in the 20 Hz - 350 Hz range. (Torres et al., 2001b) • The loudness characteristic of sound is least complex (near linear) with respect to frequency in the
frequency range chosen by us. Fig. 2.2
positions randomly with the audio either auralized using the UTD-based or the wave-based diffraction, the order of which was also randomized.
Figure 2.2: ISO equal-loudness contours with frequency in Hz.
2.3.4 Design and Procedure