DATA-DRIVEN QUALITY OF SERVICE IMPROVEMENTS IN HOSPITALS
Dongqing Yu
A dissertation submitted to the faculty of the University of North Carolina at Chapel Hill in partial fulfillment of the requirements for the degree of Doctor of
Philosophy in the Department of Statistics and Operations Research.
Chapel Hill 2016
c 2016 Dongqing Yu
ABSTRACT
DONGQING YU: Data-Driven Quality of Service Improvements in Hospitals (Under the direction of Haipeng Shen and Serhan Ziya)
In recent years, there has been an increasing interest in developing novel methods for effective and efficient healthcare service delivery and data analytics has widely been rec-ognized as being essential for decision-making at various healthcare service settings. This dissertation consists of three research projects each aiming to improve decisions at three different healthcare settings with one being related to critical care delivery and the other two being related to inpatient patient flow management. Each project combines statistical analysis of hospital data with techniques and methodologies from operations research.
ACKNOWLEDGEMENTS
Pursuing the Ph.D. degree is a long, and most of the time, stressful journey. I am deeply grateful to all the people who have helped me during this journey.
First of all, I would like to thank my two advisors, Professor Haipeng Shen and Professor Serhan Ziya. They have dedicated an enormous amount of time, numerous efforts, and great patience to guide me on my thesis research. Without their support and continuous encouragement, I would not be able to finish my thesis. They are great mentors not only in research but also in life; every meeting with them is enjoyable and inspiring. I am truly lucky to have the opportunity to work with and learn from them.
I would like to thank Professor Chuanshu Ji, Professor Nilay Argon, and Professor Jason Katz for serving on my dissertation committee, providing insightful comments to my thesis. More specifically, I would like to thank Professor Chuanshu Ji for offering generous help during my first two years study. I would like to thank Professor Nilay Argon for teaching me and answering my questions regarding both research and life. I would like to thank Professor Jason Katz for the opportunity to work on the CICU project and the practical insights from a physician perspective.
I would like to thank my friends: Qing Feng, Siliang Gong, Gen Li, Siying Li, Jenny Shi, Dong Wang, Jie Xiong, Tan Xu, Dan Yang, Qunqun Yu, and Yu Zhang. Your company and support have brought me a lot of joy during this long journey.
I would also like to thank Minghui Liu. He always believes in me and gives me vigorous support during this journey. His encouragement is particularly important when I experi-enced setbacks during my research. He deserves as much credit as I do for completing this thesis.
TABLE OF CONTENTS
LIST OF TABLES . . . viii
LIST OF FIGURES . . . ix
CHAPTER 1: Introduction . . . 1
1.1 Cardiac Intensive Care Unit (CICU) . . . 1
1.2 Emergency Departments (ED) and Internal Wards (IW) . . . 2
CHAPTER 2: Investigating the Benefits of Closed Unit Structure in the Cardiac Intensive Care Unit . . . 6
2.1 Introduction . . . 6
2.2 Description of Models of Care and Data . . . 7
2.2.1 Patient Population and Models of Care . . . 7
2.2.2 Data . . . 8
2.3 Data Analysis . . . 9
2.3.1 Demographics and Comorbidities . . . 10
2.3.2 Admission Source . . . 10
2.3.3 Admission Diagnoses and Severity-of-Illness . . . 10
2.3.4 Resource Consumption and Procedures . . . 12
2.3.5 Patient Outcomes . . . 12
2.4 Discussion . . . 15
2.4.1 Is the CICU Beneficial? . . . 16
2.4.2 What is the Best Way to Deliver CICU Care? . . . 17
2.4.3 Limitations . . . 18
2.4.4 Conclusions . . . 19
2.5.1 CICU Mortality . . . 20
2.5.2 Model of Length of stays . . . 20
2.5.3 Subgroup Analysis . . . 22
CHAPTER 3: Controlling Emergency Department Boarding Times via Ac-tive Bed Management . . . 25
3.1 Introduction . . . 25
3.2 Literature Review . . . 29
3.3 A Short Description of the Patient Flow . . . 31
3.4 ED Boarding Times and Internal Ward Occupancy . . . 33
3.4.1 Rambam Hospital Data and Processing . . . 33
3.4.2 Lognormal ED Boarding Times . . . 34
3.4.3 System-level Factors and ED Boarding Times . . . 35
3.5 Determining the target number for early discharges or internal ward occupancy 40 3.5.1 Policy 1: Daily dynamic determination of the target number for early discharges . . . 42
3.5.2 Policy 1-Var: Variation of Policy 1 . . . 44
3.5.3 Policy 2: A look-up table for the internal ward target occu-pancy level . . . 45
3.5.4 Policy 2-Var: Variation of Policy 2 . . . 47
3.6 Simulation Study . . . 47
3.6.1 Description of the simulation model . . . 47
3.6.2 Specification of simulation model parameters . . . 49
3.6.3 Results of the simulation Study . . . 51
3.6.4 Changing the Arrival Rates . . . 54
3.7 Conclusion and Discussion . . . 58
3.8 Proof of Proposition (3.1) . . . 60
CHAPTER 4: Investigating the Benefits of Early Bed Request on Emer-gency Department Performance . . . 64
4.2 Literature Review . . . 66
4.3 Description of IW Bed Request . . . 67
4.4 Making Early IW Bed Requests: Two Policies . . . 69
4.4.1 Policy 1: Early Requesting A Bed for Each Individual ED Patient . . . . 69
4.4.2 Policy 2: Early Requesting Beds As a Batch . . . 71
4.5 Simulation Model . . . 74
4.5.1 3-Step Bed-Request Procedure . . . 75
4.5.2 Formal Description of Bed-Request Policies . . . 75
4.5.2.1 Policy 1 . . . 75
4.5.2.2 Policy 2 . . . 76
4.5.3 Patient Route . . . 77
4.5.3.1 ED Patient . . . 77
4.5.3.2 NonED-to-IW Patient . . . 78
4.5.3.3 IW Patient . . . 79
4.6 Specification of Simulation Model Parameters . . . 80
4.6.1 Bed Capacity . . . 81
4.6.2 Arrival Rate . . . 82
4.6.3 Demographics . . . 82
4.6.4 Admission Probability . . . 84
4.6.5 Service Times . . . 85
4.7 Simulation Study . . . 88
4.7.1 Validation of Simulation Model . . . 90
4.7.2 Simulation Results . . . 93
4.8 Conclusion and Discussion . . . 96
LIST OF TABLES
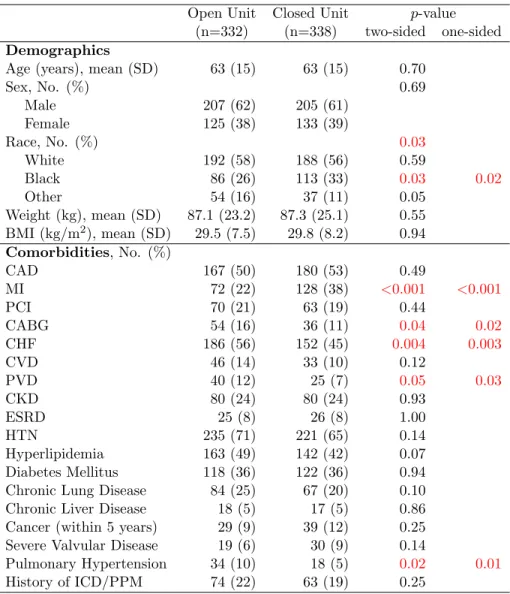
2.1 Baseline characteristics of the study population . . . 11
2.2 Primary admission source, disease severity, and diagnoses . . . 13
2.3 Resource utilization, No. (%) . . . 14
2.4 Primary outcomes and disposition . . . 15
2.5 Hazard ratio of the CICU mortality in open versus closed unit within each subgroup . 24 3.1 Hospital Summary Statistics . . . 34
3.2 8 Israeli Holidays within The Study Period . . . 37
3.3 Effect of System-level Factors on ED Boarding Times . . . 37
3.4 Effect of System-level Factors on ED Boarding Times . . . 40
3.5 Notes. Standard errors are in parentheses. ** 0.01 statistical significance; *** 0.001 statistical significance. . . 40
3.6 Estimated Values ofλpw,p∈ {1,2},w∈ {1,· · · ,7} . . . 49
4.1 λfw,h,f ∈ {1,2}, w∈ {1,2,· · ·,7}, h∈ {0,1,· · · ,23} . . . 83
4.2 Demographics . . . 84
4.3 Patient-level Summary Statistics . . . 85
4.4 System-level Summary Statistics . . . 87
LIST OF FIGURES
2.1 Kaplan-Meier survival curve for the CICU mortality . . . 15
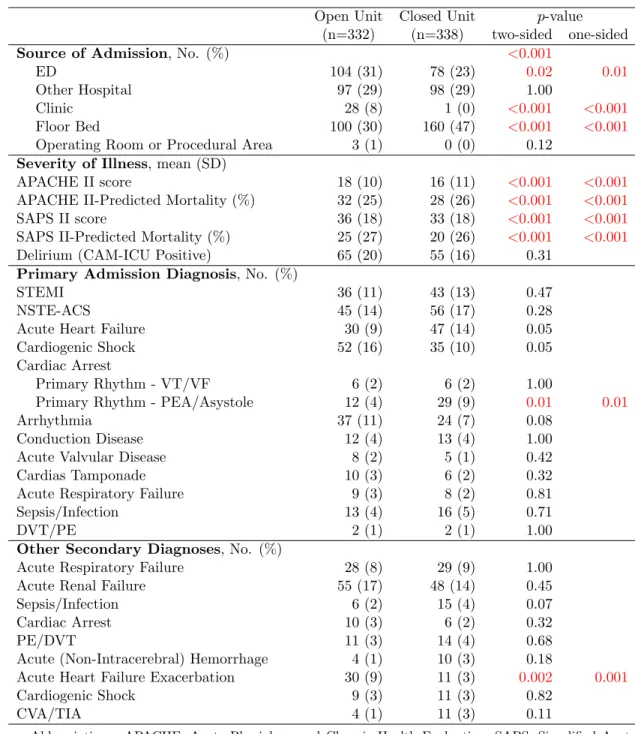
2.2 Hazard ratio for CICU mortality among pre-specified patient subgroups . . . 16
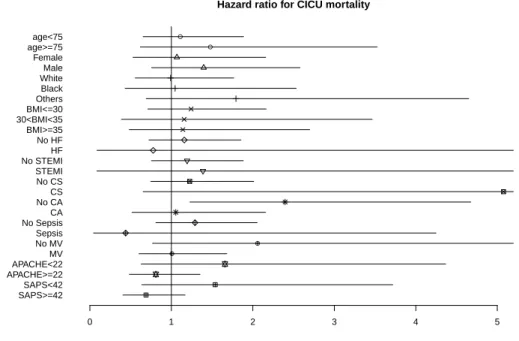
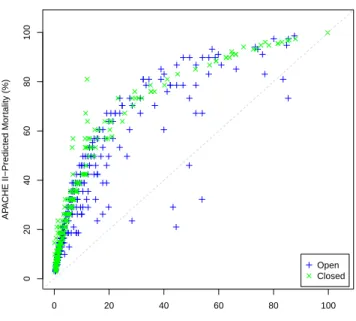
2.3 Mortality rates predicted by Model (2.1) versus APACHE II score predicted mortality rates . . . 21
3.1 Patient Flows within ED+IW Subnetwork . . . 32
3.2 Distribution of ED Boarding Time . . . 35
3.3 Mean of Log-transformed ED Boarding Time against: (a) Initial IW Occu-pancy, (b) Daily Arrivals to IW, and (c) Daily Discharges from IW . . . 36
3.4 Standard Deviation of Log-transformed ED Boarding Time against: (a) Initial IW Occupancy, (b) Daily Arrivals to IW, and (c) Daily Discharges from IW. . . 36
3.5 Residual Plots of Model (3.1) and (3.2) . . . 39
3.6 Normal Quantile Plots of Residuals of Model (3.1) and (3.2) . . . 39
3.7 Comparison of IW Occupancy Level (%) between Real Hospital and IW Model in Terms of: (a) Histogram, and (b) Boxplot for Each Day-of-week . . . 50
3.8 Comparison of IW Discharges between Real Hospital and IW Model in Terms of: (a) Histogram, and (b) Boxplot for Each Day-of-week . . . 51
3.9 95% Confidence Intervals of Fractions of Patients Whose Boarding Times Exceed the Predetermined Level of 4 Hours Under Different Policies . . . 53
3.10 Fraction of Patients Whose Boarding Times Exceed 4 Hours Against: (a) Average Number of Early Discharges per Day, (b) Average Number of Admissions per Day, and (c) Average Number of Early Discharges per Day for Only Dominating Scenarios . . . 55
3.11 95% Confidence Interval of the Fractions of Patients Whose Boarding Times Exceed 4 Hours Within a Day in the IW Model Under the Baseline Scenario for Different Arrival Rates . . . 56
3.12 Trade-off Plots for Different Arrival Rates . . . 57
4.1 Regular Bed Request . . . 68
4.2 Histogram of ED Total Census . . . 81
4.3 Hourly Average Number of (a) ED Arrivals, and (b) nonED-to-IW Arrivals . . . 82
4.5 IW Discharges . . . 86
4.6 Quantile-Quantile Plots . . . 89
4.7 Model Validation: Hourly Census Variables . . . 90
4.8 Model Validation: Distribution of ED Boarding Time and NonED-to-IW
Waiting Time . . . 92
4.9 Simulation Results . . . 94
CHAPTER 1 Introduction
In recent years, there has been an increasing amount of attention on effectively and efficiently delivering healthcare services. Besides hospital administrators and medical prac-titioners (physicians, nurses, ...), academic researchers have joined forces in this exciting and important endeavor. Among them are queueing and operations management researchers who have taken the queueing-network perspective of patient flows in the healthcare delivery systems in general, and hospitals in particular, aiming at ways that appropriately balance quality and efficiency to streamline operations, reduce congestion and delay, increase system throughput, while providing better quality of service to patients.
This dissertation continues a recent popular research thread in this area and makes contributions through three projects. The research combines detailed hospital patient-flow data with queueing-theoretical perspectives, and uses data-driven approaches to better match hospital resources with demand for healthcare services (Armony et al., 2011; Shi et al., 2014). The three projects share a unique and common novelty: they effectively combine tools from statistics, stochastic modeling, and optimization. Modern hospitals consist of many medical units, among which our research considers efficient operations in the following three such units: cardiac intensive care unit (CICU), emergency departments (ED), and hospital internal wards (IWs). All studies take advantage of real patient flow data collected at two hospitals: the UNC Hospital and the Rambam Hospital in Israel.
1.1 Cardiac Intensive Care Unit (CICU)
of hospital beds in the US (Chalfin et al., 1995). CICU is the one dedicating to criti-cally ill cardiovascular patients. A growing evidence supports that patients now occupying CICU have become increasingly susceptible to multisystem organ injury and more frequent consumers of costly critical care resources (Katz et al., 2010; Morrow et al., 2012).
Care models in the ICU have classically been described as either closed or open, depend-ing upon the presence or absence of a dedicated critical care team. While a closed model has been shown to improve patient outcomes in medical and surgical ICUs, the merits of various care models have not been previously explored in the CICU setting. Given the complexity and expenditure in the CICU, there is a compelling need to better understand and develop optimal practice models for the effective and efficient care delivery in the CICU.
Chapter 2 investigates patient conditions and compare the two care models in the cur-rent CICU in many ways. The data that support this study is prospectively collected from the UNC Hospital. We identify and describe variations among demographics, comorbidities and admission diagnoses, along with variability in the use of both cardiac and non-cardiac critical care resources. To thoroughly compare the two care models in the CICU from both clinical and fiscal perspectives, we evaluate patient outcomes in terms of CICU and hospi-tal morhospi-tality, resource utilization, and length of stay. We find no significant impact of the CICU structure on either CICU or hospital mortality. Although some significant differences in the resource utilizations are found, it is not the case that one model is consistently more resource-conservative than the other. We do find that patients have shorter length of stay in the closed unit. This study sheds lights for the first time on understanding the pros and cons of such operational models in the CICU.
1.2 Emergency Departments (ED) and Internal Wards (IW)
a key contributor (Asplin et al., 2003; Trzeciak and Rivers, 2003; Institute of Medicine, 2007; Abraham and Reddy, 2010; National Center for Health Statistics, 2013). The time of waiting for admission to an inpatient bed, known as the ED boarding time, refers to the duration between the time when doctors decide to admit a patient and the time when the patient is physically transferred to an inpatient bed. Prolonged ED boarding times not only prevent the admitted patients from getting proper level of care in inpatient units, but also result in ED congestion and decrease the hospital throughput, as such patients still occupy ED resources that otherwise could have been used for the current and incoming ED patients. Therefore, effective inpatient flow management is essential to proved better quality of care to patients.
Chapters 3 and 4 focus on the patient flow from the ED to one of the inpatient units – internal ward (IW), and aim to develop insights into effective inpatient flow management from the perspective of the availability of inpatient beds and the timeliness of admission decision, respectively. The data that support these two studies are from the Rambam Hospital in Israel, which have been analyzed in detail in Armony et al. (2011). The data are inter-departmental, in that they record patient flows from ED to IW, while ignoring detailed time stamps within each unit (ED or IW). Our work and contributions in each chapter are briefly summarized below.
Active Bed Management through Patient Early Discharges
It is important to understand the inpatient flow problem from a strict bed demand and supply perspective. Demand for beds on any given day can simply exceed the available bed capacity even after daily patient discharges are completed. Even if the number of available beds post-discharge is enough to meet the daily bed demand, the bulk of bed requests can occur before most of the discharges are complete, which results in a temporary bed shortage during the day. This “misalignment” of bed requests (demand) and patient discharges (supply), which is very common in practice, is one of the main causes of the prolonged ED boarding times.
time has been demonstrated. However, the realization of this potential benefit in practice requires some efforts, which are not cost-free. In addition, because of daily fluctuations in patient arrival and discharge, the severity of the bed shortage problem also changes from day to day. Therefore, it would be essential that hospitals could be provided with a clear guidance on how to manage patient discharges, in order to achieve the pre-specified service target at the beginning of each day.
The main objective of Chapter 3 is to provide a data-driven patient early discharge plan. We investigate the effects of active bed management within IW, through anticipating needs for IW beds and freeing up bed capacity by early discharging IW patients who are medically feasible. We demonstrate that it can reduce ED boarding times by early discharging feasible patients in IW, which matches the finding in the literature. Our main contribution is to provide hospitals a data-driven solution to the bed shortage problem through the following framework.
To begin with, we identify that the initial IW occupancy, the number of arrivals to IW, and the number of discharges from IW are three leading factors to the ED boarding time; we then build a statistical model to characterize the relationship. Secondly, we consider two approaches for discharging patients early: the first one is to discharge patients earlier in the same day, while the other one is to discharge patients one day ahead; we then formulate two discharge policies through math programming to determine the smallest number of early discharges necessary in order to meet a particular target level for boarding times. Finally, we build a discrete event simulation model and carry out a wide range of simulation studies to illustrate potential benefits of our proposed approaches and the corresponding policies. To the best of our knowledge, our work is the first to provide a practical guideline for hospitals to implement early discharge based on their particular needs.
Active Bed Management via Early Bed Requests
possible. If the decision of needing a bed can be made for an ED patient while he is still in the course of ED service, then it is expected that by the time when this patient is ready for the transfer, one bed will have been made available or in preparation, so that the transfer can happen smoothly without much delay.
There are studies considering the early bed request option for each individual ED patient one by one, which demonstrate that a significant amount of time waiting for admission can be saved. However, making early bed request decision for each individual patient is too sensitive to the prediction accuracy. Therefore, it is meaningful to investigate the aggregated bed demand in the near future and request inpatient beds in a batch in advance to take care of that aggregated demand.
CHAPTER 2
Investigating the Benefits of Closed Unit Structure in the Cardiac Inten-sive Care Unit
2.1 Introduction
The coronary care unit (CCU), with its inception dating back to the 1960s, has been credited with significantly improving the care and survival of patients hospitalized with acute myocardial infarction (e.g., Braunwald, 1998). Until recently, however, little is known about the modern CCU and its influence on contemporary patient outcomes. In spite of a limited evidence-base, these specialized units have nonetheless become pervasively embed-ded within today’s healthcare systems – particularly those within academic medical centers. What has been more recently acknowledged is that the CCU has evolved considerably over the last several decades (e.g., Katz et al., 2007), underscored by a growing patient pop-ulation admitted with increasing illness severity, for a myriad of cardiovascular maladies, and with advancing critical illness (e.g., Katz et al., 2010). At the same time, patients now occupying cardiac intensive care units (CICUs) have become increasingly susceptible to multisystem organ injury and more frequent consumers of costly critical care resources (e.g., Katz et al., 2010; Morrow et al., 2012).
all primary management decisions. In the closed model, on the other hand, all patients are managed by a single practitioner or team who is responsible for directing clinical care while the patient is in the ICU.
In the critical care literature, a lot of evidence suggests that the closed model of ICU care can both improve patient outcomes and reduce critical care expenditures (e.g., Carson et al., 1996; Multz et al., 1998; Ghorra et al., 1999). Though a recent survey of medical directors has provided some clarity on the contemporary CICU landscape, and described a predominance of closed care units within the United States (OMalley et al., 2013), or-ganizational models have never been directly studied in the cardiovascular critical care population.
In order to prospectively describe admissions and care practices within the CICU of a large, tertiary care, academic hospital, and also to evaluate the influence of an open versus closed model of care on patient outcomes and resource consumption, the following study is conducted.
2.2 Description of Models of Care and Data
2.2.1 Patient Population and Models of Care
medical students, and each team followed only patients that had been admitted directly by them. Each night, one of the teams was “on-call” and responsible for hospital admissions in addition to providing medical support to all other hospitalized cardiac patients as needed. In July 2013, as part of a planned structural transition, care delivery in the CICU was changed from an open to a closed model. In the closed model, one physician-led team was tasked with caring primarily for all cardiology patients requiring intensive care. This team was composed of an attending-level faculty cardiologist, two cardiology fellows and two residents paired to work alternating 12-hour shifts, along with 1-2 interns and medical students present only during the daytime hours. When a patient was deemed stable enough to transfer out of the CICU they were then received by a separate cardiology floor/intermediate-care team who managed these individuals until hospital discharge.
There was no difference in training or expertise between attending physicians who par-ticipated in the open or closed CICU; however, only a small cohort of these cardiologists (10 out of 25) was ultimately required to staff the closed unit. The remainder of the inpatient staff cardiologists directed the care of cardiovascular patients needing floor or stepdown beds. Only 1 cardiologist had advanced critical care training, and he attended during both the open and closed CICU periods for an equal amount of time.
2.2.2 Data
Baseline demographic and clinical variables, admission and discharge diagnoses, medical comorbidities, resource use, and outcomes were recorded for all patients. Trained abstrac-tors were used for data collection, and serial assessments of data quality and completeness were performed throughout the process. Disease severity at presentation was assessed using the modified Acute Physiology and Chronic Health Evaluation II (APACHE II) Score and the Simplified Acute Physiology Score II (SAPS II), both of which were initially derived and have been subsequently validated for use in the intensive care setting (e.g., Knaus et al., 1985; Le Gall et al., 1993). APACHE II and SAPS II scores for all eligible patients were determined from clinical information obtained during the first 24 hours of admission to the CICU. In each case, a higher score is indicative of greater illness. In addition, admis-sion source was captured for all patients, and discharge disposition was recorded for those individuals who ultimately left the hospital alive.
2.3 Data Analysis
inva-sive mechanical ventilation. All reportedp-values are two-sided and one-sided if necessary and considered statistically significant forp <0.05. This study was reviewed and approved by our institutions Office of Human Research Ethics.
2.3.1 Demographics and Comorbidities
The entire study population consisted of 670 patients, 332 (49.6%) of whom were ad-mitted to the open model CICU and 338 (50.4%) of whom were adad-mitted during the closed model of care. Baseline characteristics are shown in Table 2.1. Demographic variables were largely similar between the two groups, although there were more Black patients admit-ted during the closed CICU study period. Medical comorbidities were also quite similar between the two cohorts, with the exception of prior MI which was more common among closed model patients and history of pulmonary hypertension and previous CABG which were both more commonly found during the open model of care.
2.3.2 Admission Source
Patients placed in the CICU during the open model study period were more often admit-ted from the Emergency Department (ED), while transfers to the CICU from a floor/general ward bed were more common in the closed model of care. Additional admission sources can be seen in Table 2.2.
2.3.3 Admission Diagnoses and Severity-of-Illness
Table 2.1: Baseline characteristics of the study population
Open Unit Closed Unit p-value
(n=332) (n=338) two-sided one-sided
Demographics
Age (years), mean (SD) 63 (15) 63 (15) 0.70
Sex, No. (%) 0.69
Male 207 (62) 205 (61)
Female 125 (38) 133 (39)
Race, No. (%) 0.03
White 192 (58) 188 (56) 0.59
Black 86 (26) 113 (33) 0.03 0.02
Other 54 (16) 37 (11) 0.05
Weight (kg), mean (SD) 87.1 (23.2) 87.3 (25.1) 0.55
BMI (kg/m2), mean (SD) 29.5 (7.5) 29.8 (8.2) 0.94
Comorbidities, No. (%)
CAD 167 (50) 180 (53) 0.49
MI 72 (22) 128 (38) <0.001 <0.001
PCI 70 (21) 63 (19) 0.44
CABG 54 (16) 36 (11) 0.04 0.02
CHF 186 (56) 152 (45) 0.004 0.003
CVD 46 (14) 33 (10) 0.12
PVD 40 (12) 25 (7) 0.05 0.03
CKD 80 (24) 80 (24) 0.93
ESRD 25 (8) 26 (8) 1.00
HTN 235 (71) 221 (65) 0.14
Hyperlipidemia 163 (49) 142 (42) 0.07
Diabetes Mellitus 118 (36) 122 (36) 0.94
Chronic Lung Disease 84 (25) 67 (20) 0.10
Chronic Liver Disease 18 (5) 17 (5) 0.86
Cancer (within 5 years) 29 (9) 39 (12) 0.25
Severe Valvular Disease 19 (6) 30 (9) 0.14
Pulmonary Hypertension 34 (10) 18 (5) 0.02 0.01
History of ICD/PPM 74 (22) 63 (19) 0.25
Abbreviations: BMI: Body Mass Index, CAD: Coronary Artery Disease, MI: My-ocardial Infarction, PCI: Percutaneous Coronary Intervention, CABG: Coronary Artery Bypass Graft, CHF: Congestive Heart Failure, CVD: Cerebrovascular Dis-ease, PVD: Peripheral Vascular DisDis-ease, CKD: Chronic Kidney DisDis-ease, ESRD: End-Stage Renal Disease, HTN: Hypertension, ICD/PPM: Implantable Cardioverter-Defibrillator/Permanent Pacemaker
model CICU and 33 +/− 18 during the closed model of care. These scores would predict an average anticipated ICU mortality of 25% and 20%, respectively. In aggregate, these results suggest that less ill patients may have been admitted during the closed CICU study period as determined by previously validated ICU severity-of-illness measures. Finally, con-sistent with these findings, but not reaching statistical significance, more delirious patients (CAM-ICU positive) were admitted to the open compared to the closed CICU (Table 2.2).
2.3.4 Resource Consumption and Procedures
There was considerable variability in the use of both cardiovascular and non-cardiovascular critical care resources throughout the study. In aggregate, over 1/3 of pa-tients treated in the CICU underwent coronary angiography, 25% had a central venous catheter and intra-arterial line, and more than 20% required invasive mechanical venti-lation (Table 2.3). In the open model of CICU care, patients utilized significantly more inotropic agents (p < 0.001), non-invasive positive-pressure ventilation (p < 0.001), anti-arrhythmic medications (p <0.001), and pericardiocentesis (p= 0.03). On the other hand, patients in the closed model CICU utilized significantly more intra-arterial lines (p <0.001), vasopressor agents (p= 0.01), transthoracic echocardiography (p= 0.02), and veno-arterial extracorporeal membrane oxygenation (VA-ECMO) (p= 0.02).
2.3.5 Patient Outcomes
Table 2.2: Primary admission source, disease severity, and diagnoses
Open Unit Closed Unit p-value
(n=332) (n=338) two-sided one-sided
Source of Admission, No. (%) <0.001
ED 104 (31) 78 (23) 0.02 0.01
Other Hospital 97 (29) 98 (29) 1.00
Clinic 28 (8) 1 (0) <0.001 <0.001
Floor Bed 100 (30) 160 (47) <0.001 <0.001
Operating Room or Procedural Area 3 (1) 0 (0) 0.12
Severity of Illness, mean (SD)
APACHE II score 18 (10) 16 (11) <0.001 <0.001
APACHE II-Predicted Mortality (%) 32 (25) 28 (26) <0.001 <0.001
SAPS II score 36 (18) 33 (18) <0.001 <0.001
SAPS II-Predicted Mortality (%) 25 (27) 20 (26) <0.001 <0.001
Delirium (CAM-ICU Positive) 65 (20) 55 (16) 0.31
Primary Admission Diagnosis, No. (%)
STEMI 36 (11) 43 (13) 0.47
NSTE-ACS 45 (14) 56 (17) 0.28
Acute Heart Failure 30 (9) 47 (14) 0.05
Cardiogenic Shock 52 (16) 35 (10) 0.05
Cardiac Arrest
Primary Rhythm - VT/VF 6 (2) 6 (2) 1.00
Primary Rhythm - PEA/Asystole 12 (4) 29 (9) 0.01 0.01
Arrhythmia 37 (11) 24 (7) 0.08
Conduction Disease 12 (4) 13 (4) 1.00
Acute Valvular Disease 8 (2) 5 (1) 0.42
Cardias Tamponade 10 (3) 6 (2) 0.32
Acute Respiratory Failure 9 (3) 8 (2) 0.81
Sepsis/Infection 13 (4) 16 (5) 0.71
DVT/PE 2 (1) 2 (1) 1.00
Other Secondary Diagnoses, No. (%)
Acute Respiratory Failure 28 (8) 29 (9) 1.00
Acute Renal Failure 55 (17) 48 (14) 0.45
Sepsis/Infection 6 (2) 15 (4) 0.07
Cardiac Arrest 10 (3) 6 (2) 0.32
PE/DVT 11 (3) 14 (4) 0.68
Acute (Non-Intracerebral) Hemorrhage 4 (1) 10 (3) 0.18
Acute Heart Failure Exacerbation 30 (9) 11 (3) 0.002 0.001
Cardiogenic Shock 9 (3) 11 (3) 0.82
CVA/TIA 4 (1) 11 (3) 0.11
Abbreviations: APACHE: Acute Physiology and Chronic Health Evaluation, SAPS: Simplified Acute Physiology Score, CAM-ICU: Confusion Assessment Method for the ICU, STEMI: ST-segment Elevation Myocardial Infarction, NSTE-ACS: Non-ST-segment Elevation Acute Coronary Syndrome, VT/VF: Ventricular Tachycardia/Ventricular Fibrillation, PEA: Pulseless Electrical Activity, DVT/PE: Deep Vein Thrombosis/Pulmonary Embolus, CVA/TIA: Cerebrovascular Accident/Transient Ischemic Attack
Table 2.3: Resource utilization, No. (%)
Open Unit Closed Unit p-value
(n=332) (n=338) two-sided one-sided
Coronary Angiography 119 (36) 130 (38) 0.52
PCI 72 (22) 76 (22) 0.85
Central Venous catheter 77 (23) 68 (20) 0.35
Intra-arterial Line 48 (14) 121 (36) <0.001 <0.001
Vasopressor Use 58 (17) 84 (25) 0.02 0.01
Inotrope Use 70 (21) 36 (11) <0.001 <0.001
Mechanical Ventilation
Invasive 64 (19) 85 (25) 0.08 0.04
Non-Invasive 41 (12) 9 (3) <0.001 <0.001
Transthoracic Echocardiogram (TTE) 255 (77) 283 (84) 0.03 0.02
Transesophageal Echocardiogram (TEE) 8 (2) 10 (3) 0.81
IABP 14 (4) 20 (6) 0.38
VA-ECMO 0 (0) 6 (2) 0.03 0.02
Anti-arrhythmic Therapy 86 (26) 47 (14) 0.0001 <0.001
TH/TTM 14 (4) 7 (2) 0.12
Temporary Pacer 3 (1) 1 (0) 0.37
PPM Implantation 15 (5) 15 (4) 1.00
ICD 10 (3) 17 (5) 0.24
Ablation 16 (5) 15 (4) 0.86
DCCV/Defibrillation 21 (6) 19 (6) 0.75
Bronchoscopy 3 (1) 2 (1) 0.68
Thoracentesis 6 (2) 5 (1) 0.77
Paracentesis 0 (0) 2 (1) 0.50
Pericardiocentesis 14 (4) 5 (1) 0.04 0.03
Lumbar Puncture 1 (0) 1 (0) 1.00
Endoscopy 10 (3) 6 (2) 0.32
Abbreviations: PCI: Percutaneous Coronary Intervention, IABP: Intraaortic Balloon Pump,
VA-ECMO: Veno-Arterial Extracorporeal Membrane Oxygenation, TH/TTM: Therapeutic Hy-pothermia/Targeted Temperature Management, PPM: Permanent Pacemaker, ICD: Implantable Cardioverter-Defibrillator
difference in the CICU mortality between two unit structures when comparing a number of pre-specified patient subgroups (Figure 2.2), though more point estimates consistently favor the closed model structure. The analysis detail is left in Section 2.5.3.
Table 2.4: Primary outcomes and disposition
Open Unit Closed Unit p-value
(n=332) (n=338) two-sided one-sided
Clinical Outcomes
Mortality, No. (%)
In CICU 43 (13) 34 (10) 0.28
In Hospital 47 (14) 51 (15) 0.74
LOS (days), median (IQR)
In CICU 3 (1, 5) 2 (1, 5) 0.04 0.02
In Hospital 5 (3, 11) 5 (3, 10) 0.77
Patient Disposition∗, No. (%) 0.06
Home 239 (84) 227 (79) 0.19
Rehab/SNF 35 (12) 38 (13) 0.80
Hospice 10 (4) 13 (5) 0.67
Transferred to Another Acute Care Hospital 0 (0) 7 (2) 0.02 0.01
Other Transfer 1 (0) 1 (0) 0.75
∗For patients who survived index hospitalization (open, n=285; closed, n=286)
Abbreviations: LOS: Length of Stay, SNF: Skilled Nursing Facility
0 10 20 30 40 50 60
0.0
0.2
0.4
0.6
0.8
1.0
Days in CICU
CICU sur
viv
al
Closed Open
Figure 2.1: Kaplan-Meier survival curve for the CICU mortality
2.4 Discussion
●
Hazard ratio for CICU mortality
●
● ●
0 1 2 3 4 5
SAPS>=42 SAPS<42 APACHE>=22 APACHE<22 MV No MV Sepsis No Sepsis CA No CA CS No CS STEMI No STEMI HF No HF BMI>=35 30<BMI<35 BMI<=30 Others Black White Male Female age>=75 age<75
Figure 2.2: Hazard ratio for CICU mortality among pre-specified patient subgroups
patients presenting with a wide variety of cardiac and non-cardiac critical illnesses (e.g., Katz et al., 2007; Katz et al., 2010). We report similar findings in what we believe to be the first prospective evaluation focusing on unselected patients hospitalized in an academic, ter-tiary care CICU. Confirming other observational reports, we describe a heterogeneous group of patients, admitted with a variety of primary diagnoses, who require frequent critical care resources and long-term care support.
2.4.1 Is the CICU Beneficial?
notion that the CICU is a beneficial tool (e.g., Braunwald, 1998). We found that overall CICU mortality at our institution was slightly greater than 11%. Well-studied ICU calcu-lators tell us that we should have expected a mortality rate in the range of 25-30% based upon presenting illness severity. While the APACHE II and SAPS II models may be poor predictors of outcome in cardiovascular critical care cohorts - and admittedly have not been validated among such populations - this finding should be interpreted with cautious opti-mism. Whether this is the direct result of CICU care, the result of other non-ICU related processes, or a combination of the two remains unclear. However, given the pervasive nature of the CICU within contemporary healthcare systems, there is little presented here which should undermine the enthusiasm for this care delivery platform.
2.4.2 What is the Best Way to Deliver CICU Care?
Accepting then that the CICU is an important component of cardiovascular care, the next question to ask is how best to use the CICU. While we have a wealth of data helping to inform care practices for specific disease states - including STEMI (e.g., O’Gara et al., 2013; Jernberg et al., 2011) and cardiogenic shock (e.g., Hochman et al., 1999) - we know very little about optimal models and structures of care for aggregate CICU patient populations. We believe our study is, in fact, the first to address this topic. This is not to suggest that care models have not been previously examined in general ICU settings; on the contrary, there is indeed a fairly substantial body of evidence supporting closed models of ICU care in a variety of non-cardiac critical care units (e.g., Carson et al., 1996; Multz et al., 1998; Ghorra et al., 1999). No data, however, exists among today’s CICU patients.
curves begin to substantially diverge after a little over a week. This might suggest that the true benefit of a closed unit in the CICU might exist predominantly for patients with pro-tracted critical illness. Perhaps patients that are discharged early from the CICU may be too well to benefit from the comprehensive critical care that may result from a closed ICU model, while those requiring longer stays in the CICU may have a more complex dis-ease phenotype that warrants more structured critical care delivery. While all of this is speculative, it should stimulate additional investigation.
Critical care resource utilization, while variable among CICU models, was certainly substantial in this contemporary cohort of critically ill cardiovascular patients. This mirrors other retrospective and observational series (e.g., Katz et al., 2010; OMalley et al., 2013). While it is unclear if one unit model is more resource-conservative than the other, it is prudent to point out that patients were more quickly discharged with shorter lengths-of-stay in the closed CICU. Although length-lengths-of-stay is undoubtedly a complex and often confounded metric of critical care, this observation is nonetheless important. ICUs are exceedingly costly, consuming greater than 20% of total hospital costs despite constituting less than 10% of hospital beds in the US (e.g., Chalfin et al., 1995). Future analyses of models within the contemporary CICU must be able to address these costs-of-care, and resource consumption certainly plays a major role. Other fiscally relevant topics to examine will include professional fees, critical care documentation and billing, and ICU recidivism, among others.
2.4.3 Limitations
practice patterns that could have influenced our findings. This confounding should have been minimized, at least in part, by the rather short timeline for investigation and the consistency in care team members promoted throughout the study period. Additionally, we must also acknowledge that this study does not specifically address the benefit or liability of having critical care-trained physicians as part of the CICU. This has often been linked with structural studies advocating for closed units in other ICU settings, but was not assessed here. Undoubtedly, given that recommendations for additional training in cardiac intensive care have found their way into recent guidelines and scientific statements (e.g., Morrow et al., 2012; OGara et al., 2015), future study would be prudent in order to better under-stand the optimal role of cardiac intensivists. Finally, cost of care was not described in this study. Given the enormous expenditures associated with ICU admissions (e.g., Hochman et al., 1999), this will be an important subject for further investigation.
2.4.4 Conclusions
fo-cus on how to develop individualized CICUs that can appropriately cater to an institutions specific needs.
2.5 Additional Statistical Analysis
2.5.1 CICU Mortality
We use the logistic regression to model the CICU mortality, which is denoted byp. The model structure indicator (open= 0, closed= 1) and important clinical variables are used as the covariates, including gender, race, age, BMI, APACHE II score, and CICU LOS. The fitted model is
log p
1−p = −5.60 + 0.15×APACHE II score + 0.04×LOS in CICU, (2.1)
where covariates are significant at the level of 0.05. Patient’s APACHE II score and LOS in CICU have positive effects on the mortality rate. In other words, severer patients and patients who have longer stays in CICU are more likely to die in CICU than other patients. The scatter plot of the mortality rate predicted by Equation (2.1) and the score based mortality rate for each individual patient is depicted in Figure 2.3, where different colors are used to distinguish different unit structures. The mortality rates predicted by Model (2.1) are consistently lower than what predicted by the the APACHE II scoring system. Previously, in Section 2.3.5, we find that actual mortality rates are also lower than what predicted by the the APACHE II scoring system. This finding suggests that it is worthwhile to develop new models for the severity-of-illness score and the corresponding predicted mortality rate for CICU patients in the future study.
2.5.2 Model of Length of stays
We are interested in length of stays (LOSs) within the following three stages: ICU, hospital post-CICU, and hospital since CICU admission. Each LOS is in the unit of one day and is defined as follows:
0 20 40 60 80 100
0
20
40
60
80
100
Mortality rate in CICU predicted from logistic regression model
AP
A
CHE II−Predicted Mor
tality (%)
Open Closed
Figure 2.3: Mortality rates predicted by Model (2.1) versus APACHE II score predicted mortality rates
• LOS in hospital post-CICU = Date of hospital discharge− Date of CICU discharge + 1,
• LOS in hospital since CICU admission = Date of hospital discharge−Date of CICU admission + 1.
were implemented with STEMI consistently have shorter LOSs in all three stages; patients who had CA have shorter LOSs in hospital post-CICU and hospital since CICU admission; patients who were admitted in the closed unit have longer LOSs in hospital post-CICU than those who were admitted in the open unit, but not significantly different LOSs in CICU or the LOSs in hospital since CICU admission.
log{LOS in CICU + 1} = 1.054 + 0.011×APACHE II + 0.227×HF + 0.902×CS −0.228×STEMI
(2.2)
log{LOS in post-CICU + 1} = 1.068 + 0.206×Unit + 0.261×HF + 0.449×CS −0.280×STEMI−0.614×CA
(2.3)
log{LOS in hospital + 1} = 1.678 + 0.010×APACHE II + 0.272×HF
+ 0.869×CS−0.334×STEMI−0.452×CA
(2.4)
2.5.3 Subgroup Analysis
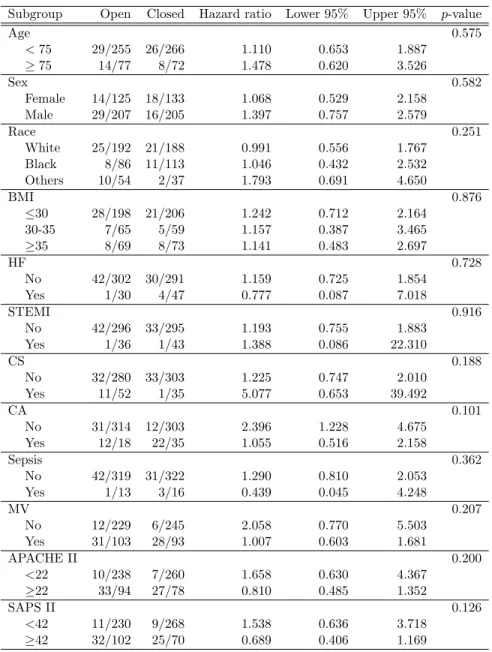
In this section, we explain how the subgroup studies visualized in Figure 2.2 are con-ducted. By comparing the CICU mortality for patients who were admitted into the open and closed units, we do not find any significant difference, as shown in Table 2.4. We doubt that impacts of unit structure on the CICU mortality might be different within finely strat-ified subgroups (e.g., female versus male). We divide each suspected characteristic into two or three subgroups, the detailed partitions are shown in Table 2.5.
We model the hazard function of the CICU mortality using the Cox regression. For each characteristic, we include the unit indicator (Unit= 0 stands for the open unit, and Unit= 1 stands for the closed unit), the subgroup indicator (Z), and the interaction term of the unit indicator and the subgroup indicator as covariates in the Cox regression. The regression model can be expressed as follows:
where λi(t) is the hazard of the ith patient at time t, and λ0(t) is the baseline hazard at timet. Uniti is the indicator of whether patientiwas admitted in the closed (Uniti = 0) or
the open (Uniti = 1) unit; Zi is the subgroup value of the study characteristic for patient
i. If the interaction term is significant, then we can conclude that impacts of unit structure on the CICU mortality are different for among patient subgroups.
As
exp{β1×1 +β2×j+β3×1×j} exp{β1×0 +β2×j+β3×0×j}
= exp{β1+β3j}, (2.6)
exp{β1+β3j}is the hazard ratio of the open unit to the closed unit within subgroupZi =j,
listed in Table 2.5. The value of the hazard ratio means that, within the corresponding subgroup, the hazard of the open unit is that number of times of the closed unit. For example, 1.068 in the second row of Table 2.5 means that, for females, the hazard in the open unit is 1.0683 times of that in the closed unit, which implies that the closed unit is better for females than the open unit. Therefore, a hazard ratio that is larger than 1 supports that the closed unit is better for that subgroup of patients. The hazard ratio for each subgroup together with the 95% confidence interval are plotted in Figure 2.2.
Table 2.5: Hazard ratio of the CICU mortality in open versus closed unit within each subgroup
Subgroup Open Closed Hazard ratio Lower 95% Upper 95% p-value
Age 0.575
<75 29/255 26/266 1.110 0.653 1.887
≥75 14/77 8/72 1.478 0.620 3.526
Sex 0.582
Female 14/125 18/133 1.068 0.529 2.158
Male 29/207 16/205 1.397 0.757 2.579
Race 0.251
White 25/192 21/188 0.991 0.556 1.767
Black 8/86 11/113 1.046 0.432 2.532
Others 10/54 2/37 1.793 0.691 4.650
BMI 0.876
≤30 28/198 21/206 1.242 0.712 2.164
30-35 7/65 5/59 1.157 0.387 3.465
≥35 8/69 8/73 1.141 0.483 2.697
HF 0.728
No 42/302 30/291 1.159 0.725 1.854
Yes 1/30 4/47 0.777 0.087 7.018
STEMI 0.916
No 42/296 33/295 1.193 0.755 1.883
Yes 1/36 1/43 1.388 0.086 22.310
CS 0.188
No 32/280 33/303 1.225 0.747 2.010
Yes 11/52 1/35 5.077 0.653 39.492
CA 0.101
No 31/314 12/303 2.396 1.228 4.675
Yes 12/18 22/35 1.055 0.516 2.158
Sepsis 0.362
No 42/319 31/322 1.290 0.810 2.053
Yes 1/13 3/16 0.439 0.045 4.248
MV 0.207
No 12/229 6/245 2.058 0.770 5.503
Yes 31/103 28/93 1.007 0.603 1.681
APACHE II 0.200
<22 10/238 7/260 1.658 0.630 4.367
≥22 33/94 27/78 0.810 0.485 1.352
SAPS II 0.126
<42 11/230 9/268 1.538 0.636 3.718
CHAPTER 3
Controlling Emergency Department Boarding Times via Active Bed Man-agement
3.1 Introduction
Long waiting times and length of stays in ED are ubiquitous in many parts of the world. In ED, a long waiting time is more than an inconvenience as it can lead to many adverse outcomes including death (Bernstein et al., 2009; Sun et al., 2013). Numerous studies have investigated the reasons behind extended ED stays and waiting times. While there are a number of contributing factors, most of these studies identified long ED boarding times, i.e., the times that ED patients spend waiting to be transferred to an inpatient unit, as one of the primary reasons behind ED crowding (Asplin et al., 2003; Trzeciak and Rivers, 2003; National Center for Health Statistics, 2013). In this chapter, we consider the sub-network consisting of the ED and IW at the daily level, and identify primary factors that affect ED boarding times. To reduce ED boarding times, we investigate the effects of active bed management within IW, through anticipating needs for IW beds and freeing up bed capacity by early discharging IW patients that are medically feasible.
of the patient flow problem: the bed bottleneck in the hospital (e.g., Asplin et al., 2003; Japsen, 2003; Olshaker and Rathlev, 2006; Howell et al., 2008; Hoot and Aronsky, 2008).
To better understand the patient flow problem from a strict bed demand and supply perspective, it is useful to highlight the various ways that the hospital admission can become a bottleneck. First of all, demand for beds on any given day can simply exceed the available bed capacity even after daily patient discharges are completed. Second, even if the number of available beds post-discharges is enough to meet the daily bed demand, the bulk of the bed requests can occur before most of the discharges complete, which results in a temporary bed unavailability during the day. This “misalignment” of bed requests (demand) and patient discharges (supply), which is very common in practice, is one of the main causes of the prolonged ED boarding times.
means that it would take the staff in any particular unit longer to prepare newly vacated beds for new admissions, longer to respond to a transfer request from ED, and generally be more reluctant to admit new patients, which would further increase their workload. Finally, there are multiple decision makers when it comes to transferring a patient from ED to one of the internal units within the hospital. As a result, hospitals, concerned with both efficiency and fairness, end up adopting rather elaborate patient transfer processes, which tend to take longer when the occupancy level is higher.
Partially motivated by the close relationship between the hospital occupancy level and ED crowding, hospitals are paying more and more attention to utilizing their bed capacities efficiently by adopting different forms of active bed management. As Powell et al. (2012) and Shi et al. (2014) discuss in details, some hospitals focus their efforts on patient discharges, specifically, changing their operations/staffing so that patients are discharged as early in the day as possible and thereby the bed crunch problem typically felt in the middle of the day (i.e., busier periods) is partially averted. Others have been initiating broader efficiency improvement efforts that aim for better bed management. According to reports by Institute of Medicine (2007) and Vicellio et al. (2008) on the state of hospital-based emergency medicine delivery, some hospitals have created “bed czars” or “bed teams” whose job is essentially to achieve the most efficient use of hospital beds in coordination with various units in the hospital. Among the responsibilities of a bed czar is to account for all the inpatient beds and “ensure rapid bed turnaround”. Hospital beds are frequently occupied by patients who in fact no longer need the level of services provided for patients in those beds. A report by Audit Commission (2003) finds that the median percentage of such beds to be 5% with some trusts reporting more than 20%. This suggests that there is significant potential for improving bed management without sacrificing the quality of care provided to the patients.
For a severely overcrowded hospital which has a bed bottleneck problem around the clock every day of the week, the cost of putting in a constant effort to identify available beds can be perfectly justified. For many hospitals, however, because of daily fluctuations in patient arrivals and discharges, the severity of the bed bottleneck problem also changes from day to day. For some days, there may be no need to aggressively seek space for new patients, while for some other days, there can be a significant bed shortage. Such hospitals may adopt more of a dynamic policy for allocating resources to the task of creating new bed space. Every day, by taking into account the number of available beds, the number of patients who are expected to be discharged over the next 24 to 48 hours, and the prediction for the number of new bed requests to the internal wards, the hospital can determine whether or not a bed bottleneck problem is likely to occur on that day and if yes how severe it will be. This can then guide decisions regarding how aggressive the hospital needs to be (if at all) when speeding up the discharge process of patients who are already medically safe to be discharged.
The main objective of this study is to develop a framework, which can be used to make this determination and investigate the potential benefits of adopting it. Specifically, the study makes the following three contributions.
1. Using data from an Israeli hospital, we investigate how ED boarding times depend on the hospital occupancy level, the number of new arrivals, and the number of discharges for every day of the week, and quantify this relationship for this particular hospital.
target level of boarding time it aims to provide for its patients. The second problem is meant to be solved by the hospital one day in advance to realize an ideal initial occupancy target based on the historical experience.
3. We carry out an extensive simulation study to demonstrate the potential benefits of using either early-discharge approach, in comparison with the baseline scenario under which no early discharge is allowed. We also carry out a sensitivity analysis with respect to the bed request rates to IW.
3.2 Literature Review
There is an extensive literature on methods improving the patient flow from ED to IW. Here we focus on the discharge process for patients in IW. Rubino et al. (2007) and Vicellio et al. (2008) point out the importance of adopting the “discharge by noon” target in freeing up the occupied inpatient beds and improving patient throughput.
Armony et al. (2011) provide broad exploratory data analyses on the patient flow inside ED, IW, and transfer process from ED to IW in the Rambam Hospital, which is also the source of the data supporting our study. In the Rambam Hospital, a patient who is decided to be hospitalized in IW by an ED physician is assigned and transferred to one of the five IWs based on a certain routing policy. Although IW tries to admit patients within four hours from the decision of hospitalization, significantly longer delays exist. Therefore, they propose that reducing the waiting times in ED is essential to prevent the clinical consequences of long delays. They identify a series of causes for the delays, e.g., the ward occupancy, bed capacity, delayed IW discharges and so on. They observe that the longest delay happens in the early morning, and follows with a consistent decline up until noon, due to the fact that the physicians’ morning round is performed in the early morning but completed in the afternoon. These findings motivate that it is meaningful to investigate the ways to speed up the discharge process in IW, and convince us about potential subsequent benefits.
over a day. Powell et al. (2012) test three alternative discharge polices having the same total volume as the original policy, but different distributions from the original one with peak around 3pm in the model capturing the patient flow into and out of the inpatient beds at the hourly level. The first tested discharge policy is shifting the original discharge distribution 1, 2, 3 and 4 hours earlier; the second one is uniformly discharging 75% patients from 7am to noon and the remaining 25% from noon to 8pm; and the third one is uniformly discharging all patients from 7am to 4pm. For the performance measure, they sum all the number of patients who board during each hour over a day and get the total daily admitted patient boarding hours. All the three alternatives are proved to be able to decrease the total daily admitted patient boarding hours by various degrees.
The original discharge policy in the general wards of the hospital studied by Shi et al. (2014) has a slim and high peak between 2-3pm and only 12.7% of patients are discharged by noon. At one point, this hospital pushes forward the discharge process moderately, which results in an additional peak earlier than the original 2-3pm peak, and around 26% of the patients are discharged before noon. They observe slight reductions in two performance measures: the average boarding times and the fraction of patients whose boarding times are longer than 6 hours. To study the effect of the timing of discharge on relieving the bed problem thoroughly, they propose to push forward the discharge process in a more aggressive way to make that additional peak appear as early as 8-9am. To evaluate the performance of this progressive policy, they simulate the inpatient operations in the real hospital at the hourly level by building a stochastic network. The simulation results show that this more aggressive discharge policy almost stabilizes the two performance measures. We extend the idea in the above two papers, and consider moving tomorrow’s discharges to today afternoon, in addition, moving discharges in the afternoon to the morning of the same day.
waiting for an inpatient unit bed post treatment in ED is above a specified threshold. They evaluate the performance of various strategies by building a discrete-event simulation model of patient pathway through a hospital that comprises of an ED and several inpatient units at the hourly resolution. Based on the simulation results, they conclude that, compared with the static early discharge strategy, the two proactive ones can significantly reduce ED waiting and boarding times, ambulance diversion duration, and percentage of leave without treatment. In addition, the performance improvements of the proactive early discharge strategies are sensitive to the patient arrival rates.
Besides trying different ways for early discharge and demonstrate the effects as the above literature did, this study goes one step beyond - given the effects of reducing ED boarding times of the various approaches, we start with a pre-specified ED boarding time target, and suggest specific numbers of early discharges in order to achieve that target.
3.3 A Short Description of the Patient Flow
In this chapter, in order to study the delays in the transfer from the ED to IW, we focus on patient flow within the subnetwork consisting of the ED, IW and the transfers of patients from the ED to IW, which is referred to as ED+IW. In the hospital that we are studying, a very high percentage of the patients visiting hospital stay within this subnet-work. Among patients who enter hospital from ED, 13% of those are hospitalized in IW. Switching attention to the IW, 96% of the internal patients come from ED, who are referred to as ED-to-IW patients. The other 4% of the patients in IW are from other units inside hospital, who are referred to as In-to-IW patients. These two incoming streams to IW are shown as red solid and dashed line in Figure 3.1. We will concentrate on ED-to-IW patients and their delays within the transfer process in the rest of the chapter.
IW
ED
Other unitsinside hospital Routing
Treatment
Figure 3.1: Patient Flows within ED+IW Subnetwork
this patient is refused by the first assigned IW, he will be waiting for the reassignment to another IW. When this patient is eventually accepted by an IW, preparation for his arrival begins. In order to complete the transfer, a bed, medical equipment and staff must be ready for the transfer. Even if there is an available (empty) bed in this particular IW, this patient might still suffer delay caused by the lack of either equipment or staff or both. For detailed procedures that happen in the routing process, readers could refer to Armony et al. (2011). Up to the point that all the requirements are ready, this patient will remain in the ED and receive care from ED staff.
As we don’t have detailed data regarding the transfer process, we put the routing mechanism inside a “black box”, as shown in Figure 3.1, to investigate the transfer delays at the daily level. Of interest is the total amount of time that a transfer patient is held within the “black box”. Once the patient spends necessary time inside the “black box”, then the transfer is completed and he can enter IW. The total amount of time that an ED-to-IW patient spends in the “black box”, from the time of assignment to IW to the time of admission into IW, is often referred to as the ED boarding time in the literature.
impacting factors will be provided in the following sections. Moreover, we propose policies to reduce the prolonged ED boarding time and investigate their benefits.
3.4 ED Boarding Times and Internal Ward Occupancy
In this section, we analyze the department-level patient flow data from the Rambam Hospital, and identify system-level factors that can affect ED boarding times. We first describe in Section 3.4.1 various variables in the hospital data, and how we process them to obtain factors that are potentially related to ED boarding times. Section 3.4.2 then demonstrates the lognormality of the ED boarding times. Finally, Section 3.4.3 builds regression models to characterize how the mean and standard deviation of the lognormal ED boarding time depend on various hospital factors.
3.4.1 Rambam Hospital Data and Processing
The Rambam Hospital is a large hospital in Israel that operates one ED treating on average 247 patients every day, and five IWs hospitalizing on average 1,000 patients every month. The data are provided to us through the courtesy of the Technion SEE Lab. The data include the following time stamps for the ith patient’s stay within the ED+IW subnetwork:
• EDRi — time that an IW bed request is sent out for an ED-to-IW patient;
• IN Ri — time that an IW bed request is sent out for an In-to-IW patient;
• ADMi — time of admission to IW;
• F IRSTi — time that the first procedure is performed in IW;
• DISi — time of discharge from IW.
• Nt — initial IW occupancy level of Day t, the number of patients whose times of
admission to IW (ADMi) are earlier than 00:00 of Daytand times of discharge from
IW (DISi) are later than 0:00 of Dayt;
• At — daily arrivals to IW on Dayt, the number of patients whose times of admission
to IW (ADMi) are later than 00:00 of Daytbut no later than 23:59 of Day t;
• Dt — daily discharges from IW on Day t, the number of patients whose times of
discharge from IW (DISi) are later than 00:00 of Day t but no later than 23:59 of
Dayt.
Summary statistics of these three factors are provided below in Table 3.1.
Table 3.1: Hospital Summary Statistics
Standard First Third
Variable Mean deviation quantile Median quantile
Initial IW occupancy level (#) 179.6 14.9 170.0 181.0 188.8 Initial IW occupancy level (%) 85.5 7.1 81.0 86.2 89.9
Daily arrivals to IW 33.6 8.0 28.0 34.0 39.8
Daily discharges from IW 33.6 14.1 27.3 37.0 43.0
Notes. N= 306 days between October 2006 to October 2007 (excluding the months January to March in 2007, when
one of the IWs was in charge of an additional sub-ward).
In addition, for the ith ED-to-IW patient, we use the difference between the time that the first procedure is performed in IW (F IRSTi) and the time that an IW bed request
is sent out (EDRi) as the proxy of the ED boarding time of that patient. This can be
an overestimation for the actual delay time in the transfer process. However, as shown by Elkin and Rozenberg (2007), a significant portion of this time period is indeed spent within ED, so this is a reasonable estimate for the ED boarding time.
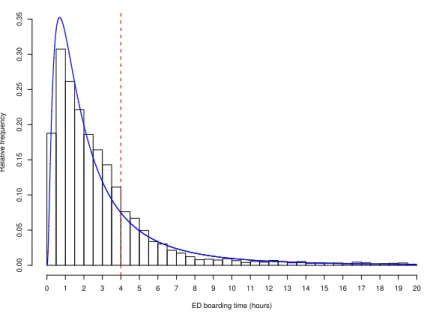
3.4.2 Lognormal ED Boarding Times
hour. The operational goal of the hospital is to board patients within 4 hours (the vertical dash line); however, 21% of the ED-to-IW patients have to wait for more than 4 hours!
ED boarding time (hours)
Relativ
e frequency
0.00
0.05
0.10
0.15
0.20
0.25
0.30
0.35
0 1 2 3 4 5 6 7 8 9 10 11 12 13 14 15 16 17 18 19 20
Figure 3.2: Distribution of ED Boarding Time
To aid the hospital decision at the beginning of each day, it helps to know the distri-bution of ED boarding times within that day. For each day, we perform the Kolmogorov-Smirnov test to check whether the ED boarding times follow a lognormal distribution. Only one day (out of the 306 days) failed the test at the significance level of 0.05. Therefore, the ED boarding times within a day can be well approximated as lognormally distributed. Thompson et al. (2009) have also demonstrated the lognormallity of ED boarding times. In other service systems such as telephone contact centers, Brown et al. (2005) find that lognormal distributions are reasonable to model service times there (i.e. durations of con-versations between callers and service representatives.)
3.4.3 System-level Factors and ED Boarding Times
Lognormal distributions are characterized by two parameters: the mean and the stan-dard deviation on the log scale. Let Bt denote a random ED boarding time on Day t;
therefore logBt is normally distributed. Below we investigate how the system-level factors
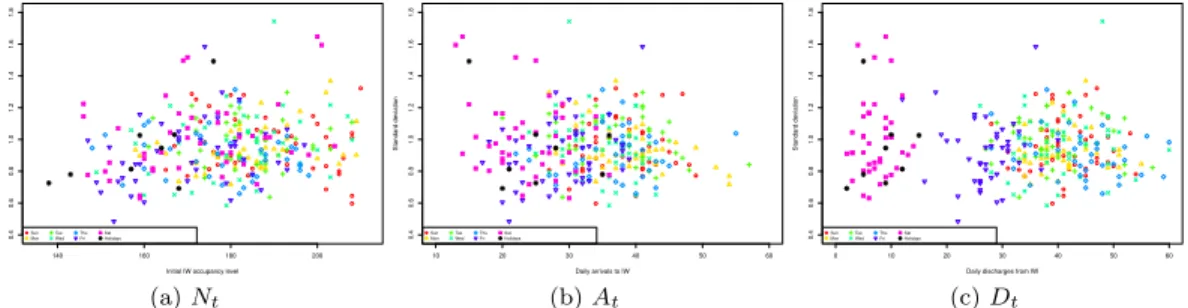
Figures 3.3 and 3.4 plotmtandstagainst the three system-level factors, respectively. To
highlight the day-of-the-week effect, the points are coded using different colors and symbols according to their corresponding day of the week as shown in the legend. In addition, Israeli holidays are shown as black asterisks. In both figures, there exists no clear day-of-the-week effect in Panels (a) and (b). Interestingly in Panel (c) of both figures, there are approximately three clusters related to day-of-the-week and holiday. From left to right, the first cluster, with the lowest number of discharges, consists of points from Saturdays and holidays; the second cluster is in the middle and corresponds to Fridays; while the third cluster has the highest number of discharges and includes all weekdays. Note that in Israel, Sunday is the first weekday; Friday is a half-day weekend; and Saturday is a whole-day weekend. Therefore, we conjecture that the variability in the number of discharges is due to lower staffing levels in weekends than those in weekdays.
140 160 180 200
−0.5
0.0
0.5
1.0
1.5
Initial IW occupancy level
Mean Sun Mon Tue Wed Thu Fri Sat Holidays (a)Nt
10 20 30 40 50 60
−0.5
0.0
0.5
1.0
1.5
Daily arrivals to IW
Mean Sun Mon Tue Wed Thu Fri Sat Holidays (b)At
0 10 20 30 40 50 60
−0.5
0.0
0.5
1.0
1.5
Daily discharges from IW
Mean Sun Mon Tue Wed Thu Fri Sat Holidays (c)Dt
Figure 3.3: Mean of Log-transformed ED Boarding Time against: (a) Initial IW Occu-pancy, (b) Daily Arrivals to IW, and (c) Daily Discharges from IW
140 160 180 200
0.4 0.6 0.8 1.0 1.2 1.4 1.6 1.8
Initial IW occupancy level
Standard de viation Sun Mon Tue Wed Thu Fri Sat Holidays (a)Nt
10 20 30 40 50 60
0.4 0.6 0.8 1.0 1.2 1.4 1.6 1.8
Daily arrivals to IW
Standard de viation Sun Mon Tue Wed Thu Fri Sat Holidays (b)At
0 10 20 30 40 50 60
0.4 0.6 0.8 1.0 1.2 1.4 1.6 1.8
Daily discharges from IW
Standard de viation Sun Mon Tue Wed Thu Fri Sat Holidays (c)Dt
Figure 3.4: Standard Deviation of Log-transformed ED Boarding Time against: (a) Initial IW Occupancy, (b) Daily Arrivals to IW, and (c) Daily Discharges from IW
clustering supports our previous conjecture that the number of discharges is low when the staffing level is low. As shown in Panels (a) and (b), these holidays do not systematically differ from the other days in terms of initial IW occupancy level and number of daily arrivals to IW. Therefore, we label and treat these days as Saturdays when we build regression models formtand st later on.
Table 3.2: 8 Israeli Holidays within The Study Period
Date Reason Date Reason
Oct. 2, 2006 Yom Kippur May 23, 2007 Pentecost Apr. 3, 2007 First day of Passover Sep. 13, 2007 New Year Apr. 9, 2007 Last day of Passover Sep. 27, 2007 Sukkot I Apr. 24, 2007 Independence Day Oct. 4, 2007 Shmini Atzeret
Figures 3.3 and 3.4 suggest that we can predict mt and st using IW occupancy level
(Nt), number of arrivals to IW (At), and number of discharges from IW (Dt). Based on
Panel (c) in both figures, we include day-of-the-week indicators for weekdays, Fridays and Saturdays, when modeling the effect of Dt on mt and st. We perform model selection to
identify the final model, the parameter estimates of which are provided in Table 3.3 for the mean and the standard deviation of the log-transformed ED boarding time, respectively.
Table 3.3: Effect of System-level Factors on ED Boarding Times
mt st
Intercept -1.4974 (0.1902)*** 0.5165 (0.1316)***
Initial IW occupancy (Nt) 0.0101 (0.0010)*** 0.0028 (0.0008)***
Arrivals (At) 0.0124 (0.0021)***
Discharge (Weekdays & Friday) (Dt) -0.0034 (0.0011)** -0.0019 (0.0007)**
Friday Only -0.1227 (0.0414)**
Model fit F-test (Pr> F) <0.001 <0.001
AdjustedR-squared 0.3721 0.0413
Notes. Standard errors are in parentheses. ** 0.01 significance; *** 0.001 significance.
Based on the above coefficients, the fitted models for mt and st are shown below in
Models (3.1) and (3.2), respectively:
mt =
−1.4974 + 0.0101Nt+ 0.0124At−0.0034Dt+mt , Weekdays,
−1.6202 + 0.0101Nt+ 0.0124At−0.0034Dt+mt , Friday,
−1.4974 + 0.0101Nt+ 0.0124At+mt , Saturday,
st =
0.5165 + 0.0028Nt−0.0019Dt+st, Weekdays & Friday,
0.5165 + 0.0028Nt+st, Saturday.
(3.2)
We can make the following observations based on the fitted models. The coefficient estimates for the initial IW occupancy level are significantly positive (0.0101, p < 0.001) and (0.0028, p < 0.001), respectively, indicating that IW occupancy increases the mean and the standard deviation of the log-transformed ED boarding time. The number of arrivals to IW has a significant positive effect for mt (0.0124, p < 0.001), although it is
not significant for st. Daily discharge is generally associated with reduction in both the
mean and standard deviation of the (log) ED boarding time on Weekdays and Fridays, as indicated by the negative coefficients of the discharge terms inmt(-0.0034,p <0.01) and in
st(-0.0019, p <0.01), while discharge on Saturday does not significantly affect neither the
mean nor the standard deviation of the log-transformed ED boarding time. The coefficient estimate for the indicator of Fridays inmtis negative (-0.1227, p <0.01), indicating lower
number of discharges on average than other days of a week.
We now perform residual diagnostics on the two fitted models. Figure 3.5 shows the residual plots (mt and st) with the day-of-the-week highlighted by symbols and colors, revealing randomness among the residuals. The normal quantile plots in Figure 3.6 suggest that the residuals are normally distributed. In addition, we test the independence between mt and st and find that they are significantly dependent (p <0.001), with a correlation of −0.3. Hence, we can model the residuals using the following bivariate normal distribution:
mt st
∼N
0 0 ,
0.0560 −0.0140 −0.0140 0.0339
.
For any given day t, we introduce a day-of-week indicator wt, where wt ∈ {1 :
Sunday,· · · ,7 : Saturday}. At the beginning of any day t, the above fitted Model (3.1) and (3.2) suggest that, given the initial IW occupancy level (Nt), the number of arrivals to
0 50 100 150 200 250 300 −0.5 0.0 0.5 Day index Residual Sun Mon Tue Wed Thu Fri Sat Holidays
(a) Model (3.1)
0 50 100 150 200 250 300
−0.5 0.0 0.5 Day index Residual Sun Mon Tue Wed Thu Fri Sat Holidays
(b) Model (3.2)
Figure 3.5: Residual Plots of Model (3.1) and (3.2)
−3 −2 −1 0 1 2 3
−0.6 −0.4 −0.2 0.0 0.2 0.4 0.6 Norm quantiles Residuals
(a) Model (3.1)
−3 −2 −1 0 1 2 3
−0.4 −0.2 0.0 0.2 0.4 0.6 0.8 Norm quantiles Residuals
(b) Model (3.2)
Figure 3.6: Normal Quantile Plots of Residuals of Model (3.1) and (3.2)
can predict the distribution of the log-transformed ED boarding times on Dayt as:
log{Bt wt, Nt, At, Dt
} ∼ Nmt wt, Nt, At, Dt
, s2t Nt, Dt
, (3.3)
where mt and st are specified in Models (3.1) and (3.2). This distribution will be used to
guide our proposal for early-discharge policies in Section 3.5.
congested, the effect of the initial IW occupancy level on the ED boarding time is larger. For the other system-level factors, the coefficient estimates are similar to those in Models (3.1) and (3.2).
Table 3.4: Effect of System-level Factors on ED Boarding Times
mt st
Intercept -0.6173 (0.1088)*** 0.7713 (0.0657)***
Initial IW occupancy square (Nt2) 0.00003 (0.000003)*** 0.00001 (0.000002)***
Arrivals (At) 0.0125 (0.0021)***
Discharge (Weekdays & Friday) (Dt) -0.0033 (0.0011)** -0.0019 (0.0007)**
Friday Only -0.1227 (0.0414)**
Model fitF-test (Pr> F) <0.001 <0.001
AdjustedR-squared 0.3756 0.0387
Table 3.5: Notes. Standard errors are in parentheses. ** 0.01 statistical significance; *** 0.001 statistical significance.
mt =
−0.6173 + 0.00003Nt2+ 0.0125At−0.0033Dt+mqt , Weekdays
−1.6201 + 0.00003Nt2+ 0.0125At−0.0033Dt+mqt , Friday
−1.4974 + 0.00003Nt2+ 0.0125At+mqt , Saturday
(3.4)
st =
0.7713 + 0.00001Nt2−0.0019Dt+sqt , Weekdays & Friday
0.7713 + 0.00001Nt2+sqt , Saturday
(3.5)
3.5 Determining the target number for early discharges or internal ward oc-cupancy