MODULATION OF NETWORK OSCILLATIONS BY BRAIN STIMULATION
Stephen L. Schmidt
A dissertation submitted to the faculty of the University of North Carolina at Chapel Hill in partial fulfillment of the requirements for the degree of Doctor of Philosophy in the Biomedical Engineering Department.
Chapel Hill 2016
ABSTRACT
Stephen L. Schmidt: Modulation of network oscillations by brain stimulation (Under the direction of Flavio Frohlich)
Finding new and effective treatments for mental illness represents one of the largest challenges of our time due the large number of people affected. Despite long and careful study there have been few recent breakthroughs in pharmacological treatments of mental illness. To address this, the National Institute of Mental Health (NIMH) has recently begun to focus on the investigation of network level correlates of mental illnesses. Patients with mental illness often exhibit aberrant neural oscillatory activity, thus making the network level a promising scale for the identification of measureable neural correlates of mental illnesses. At the network level, neural activity is primarily in the form of cortical oscillations which may be recorded noninvasively with electroencephalography (EEG). Such EEG oscillations are the result of synchronized activity from many cells in the neocortex. However the exact mechanisms of how
oscillations arise and spread throughout the brain remain unknown. Non-invasive brain stimulation is a promising treatment modality because it specifically targets activity of brain networks. Unlike
pharmacological treatments, stimulation with electric and magnetic fields directly targets electrical activity of many cells in a network. In particular, transcranial alternating current stimulation appears to be
especially suited for targeting oscillations in brain networks. Despite the promise of these brain stimulation techniques, the underlying mechanisms remain unknown.
ACKNOWLEDGEMENTS
First I would like to thank my mentor and advisor, Flavio Frohlich who taught me many things including how to perform scientific experiments and how to make bananas flambé. Flavio took a chance on someone with a questionable academic record; I like to think it has turned out pretty well for both of us.
I would like to thank my committee: Angel Peterchev, Anne Taylor, Hae Won Shin and Shawn Gomez for their valuable input. Charlene Santos and Mark Ross have provided countless hours of managing the animal colony, Vladimir Ghukasyan for providing the microscopy core, and Hyung Kim for genotyping results in less than 48 hours.
I also thank all current and past members of the Frohlich Lab for their scientific input and making the lab a fun place to work. In particular I would like to thank Apoorva Iyengar, Alban Foulser, Chris Dorsett, Davis Bennet, Erin Chew, Ehsan Negahbani, Mohammad Hammad, Nadia Mishal and Sarah Schoenrock who performed many of the in vitro experiments. Also I want to thank Sankar Alagapan who took some ECoG recordings from the beginning of a project and turned it into something really special.
I also thank my parents for teaching me the value of hard work. Finally I thank Elizabeth
PREFACE
All the work presented here was part of a group effort. I have been extremely lucky to work with capable and affable colleagues. In this preface I list the work performed by each contributor. Chapter 2: Flavio Frohlich and Stephen L. Schmidt designed experiments, analyzed the data and wrote the paper; Davis V. Bennet, Erin Y. Chew, Mohamad A. Hammad and Flavio Frohlich performed the experiments. Chapter 3: Flavio Frohlich and Stephen L. Schmidt designed the experiments and wrote the paper. Stephen L. Schmidt analyzed the data. Apoorva K. Iyengar, Christopher R. Dorsett, and Stephen L. Schmidt performed the experiments. Chapter 4: Flavio Frohlich and Stephen L. Schmidt designed the experiments and wrote the paper. A. Alban Foulser, Apoorva K Iyengar and Stephen L. Schmidt performed the experiments. Stephen L. Schmidt analyzed the data. Michael R. Boyle validated the analysis code. Chapter 5: Flavio Frohlich, Hae Won Shin, Sankaraleengam Alagapan and Stephen L. Schmidt designed the experiments. Eldad Hadar, Hae Won Shin, Sankaraleengam Alagapan, and Stephen L. Schmidt performed the experiments. Sankaraleengam Alagapan analyzed the data. Flavio Frohlich, Hae Won Shin, Jeremie Lefebvre, Sankaraleengam Alagapan and Stephen L Schmidt wrote the paper. Jeremie Lefebvre developed and analyzed the network model. Flavio Frohlich and
TABLE OF CONTENTS
LIST OF TABLES ... x
LIST OF FIGURES ... xi
LIST OF ABBREVIATIONS... xiii
CHAPTER 1: INTRODUCTION ... 1
REFERENCES ... 9
CHAPTER 2: DIFFERENTIAL EFFECTS OF CHOLINERGIC AND NORADRENERGIC NEUROMODULATIONON SPONTANEOUS CORTICAL NETWORK DYNAMICS ... 17
INTRODUCTION ... 17
METHODS ... 18
Ethical Statement ... 18
Solutions ... 18
Slice Preparation ... 19
Drug Application and Experiment Design ... 19
Histology and Electrode Locations ... 20
Multiunit and Single Unit Data Acquisition ... 20
Data Analysis ... 21
Statistics ... 23
RESULTS ... 23
Neuromodulators CCh and NE Increase Spontaneous Activity ... 23
Temporal Response Profile ... 24
Concentration Dependent Modulation of Spatial Spread of Spontaneous Activity ... 25
Magnitude of Neuromodulator and Plasticity Effects ... 26
Effects of Neuromodulators by Cortical Depth ... 28
Network Dynamics ... 29
DISCUSSION ... 33
Summary of Findings ... 33
Studying Network Dynamics In Vitro with Multielectrode Arrays ... 34
Neuromodulation in Acute Cortical Slices ... 35
Response Dynamics ... 36
Plasticity... 37
Conclusions and Outlook... 38
FIGURES AND TABLES ... 39
REFERENCES ... 53
CHAPTER 3: INTERACTION OF INTRINSIC AND SYNAPTIC CURRENTS MEDIATE NETWORK RESONANCE DRIVEN BY LAYER V PYRAMIDAL CELLS... 61
INTRODUCTION ... 61
METHODS ... 63
Solutions ... 63
Slice Preparation ... 63
Wide Field Fluorescence Imaging ... 64
Patch Experimental Design ... 64
Multi-electrode Array Experimental Design ... 65
Data Analysis ... 65
RESULTS ... 67
Networks Activated by L5 PYs Exhibited Resonance ... 67
A Subset of eYFP labeled L5 PYs Exhibited Subthreshold Resonance ... 68
Resonant Frequency Shifted to Lower Frequencies with Synaptic Transmission Suppressed ... 69
The Network Level Effect of IM Was Largely Independent of Synaptic Transmission ... 70
The Network Level Effect of Ih Was Dependent on Synaptic Transmission ... 72
DISCUSSION ... 75
FIGURES AND TABLES ... 79
REFERENCES ... 94
INTRODUCTION ... 100
METHODS ... 101
Slice Preparation and Data Acquisition ... 101
Experimental Design ... 102
Data Analysis ... 103
RESULTS ... 104
Optogenetic in Vitro Model of Slow Cortical Oscillations ... 104
Neocortex Responds to Weak EF stimulation with Network Resonance ... 105
EF Stimulation Increases Neuronal Activity Levels ... 106
Conditions That Limit Occurrence of Network Resonance ... 108
DISCUSSION ... 111
FIGURES AND TABLES ... 115
REFERENCES ... 130
CHAPTER 5: MODULATION OF CORTICAL OSCILLATIONS BY LOW- FREQUENCY DIRECT CORTICAL STIMULATION IS STATE-DEPENDENT ... 134
INTRODUCTION ... 134
METHODS ... 136
ECoG Data Collection and Direct Cortical Stimulation ... 136
Behavioral Tasks ... 137
Data Analysis ... 137
Statistics ... 138
Stimulation Artifact Removal ... 138
Extraction of Electrode Location from Neuroimaging Data ... 139
Computational Model ... 140
RESULTS ... 141
DISCUSSION ... 147
FIGURES AND TABLES ... 153
REFERENCES ... 162
CHAPTER 6: TARGET ENGAGEMENT WITH TRANSCRANIAL CURRENT STIMULATION ... 168
EFFECT OF ELECTRIC FIELDS ON INDIVIDUAL NEURONS ... 168
INTERACTIONS OF NETWORK OSCILLATIONS AND ELECTRIC FIELDS ... 169
OUTLASTING EFFECTS OF ELECTRIC FIELDS ... 172
INTERACTION OF CELLULAR AND NETWORK MECHANISMS ... 173
FIGURES ... 174
REFERENCES ... 175
CHAPTER 7: DISCUSSION ... 178
LIST OF TABLES
Table 2.1. Neuromodulator effect and plasticity by Cortical Depth. ... 52
Table 3.1. ANOVA p values for MU within L5 for increasing frequency chirps. ... 90
Table 3.2. ANOVA p values for MU within L5 for decreasing frequency chirps ... 91
Table 3.3. ANOVA p values MU outside L5 for increasing frequency chirps. ... 92
Table 3.4. ANOVA p values MU outside L5 for decreasing frequency chirps. ... 93
Table 4.1. Frequency preference for EF Stimulation Frequency. ... 123
Table 4.2. Frequency Preference for 1 Hz. ... 124
Table 4.3. Change in UP state FR. ... 125
Table 4.4. Change in DOWN state FR. ... 126
Table 4.5. Change in Total FR. ... 127
Table 4.6. Change in Correlation. ... 128
Table 4.7. Normalized Optogenetic Response ... 129
Table 5.1. Clinical Information of Participants... 160
LIST OF FIGURES
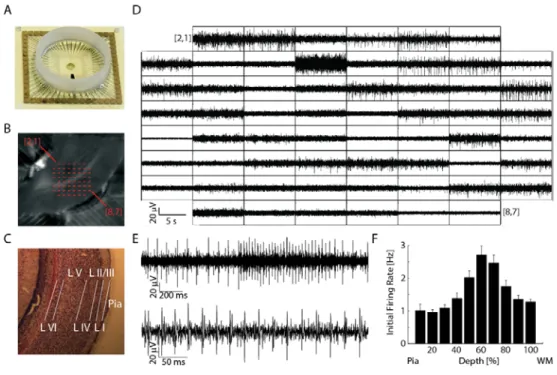
Figure 2.1. Use of a multielectrode array (MEA) allows simultaneous readings of
neuronal activity on 59 channels. ... 39
Figure 2.2. Single Units ... 41
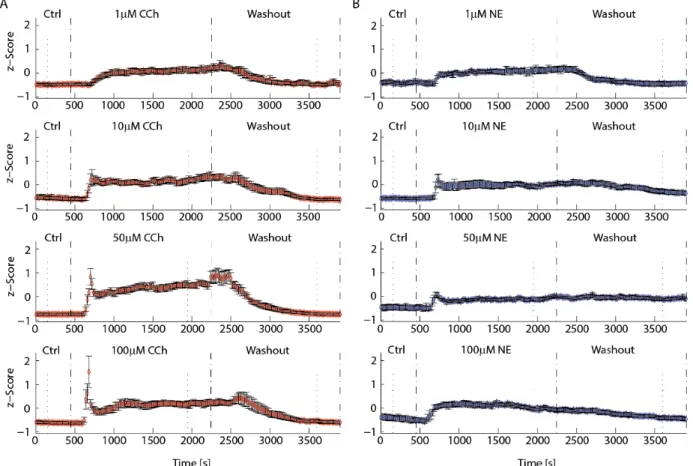
Figure 2.3 Time-courses of spontaneous activity in response to neuromodulator application. ... 42
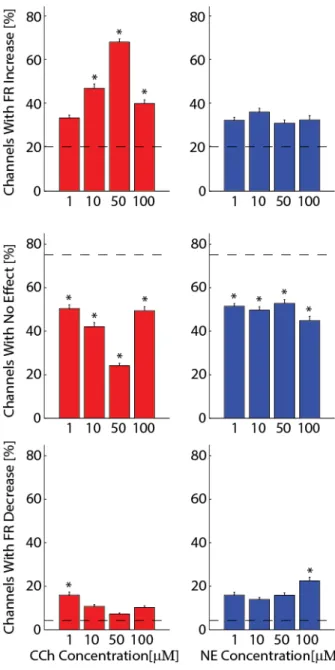
Figure 2.4. Effect types. ... 43
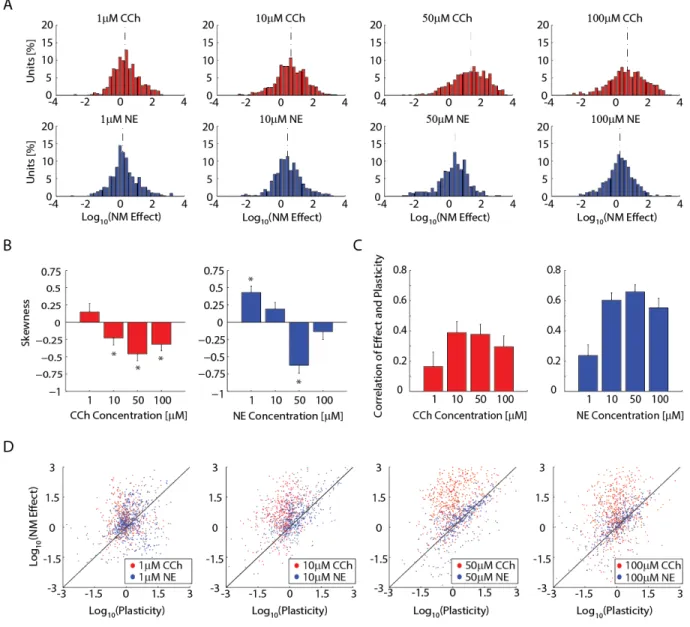
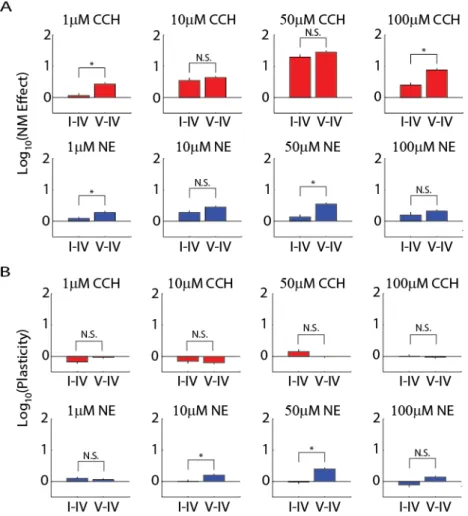
Figure 2.5. Neuromodulator effect and plasticity ... 44
Figure 2.6. Effect by cortical depth. ... 46
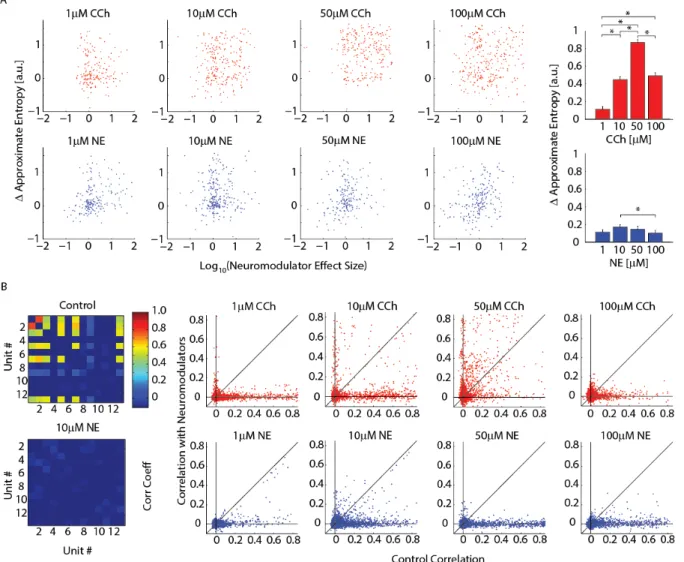
Figure 2.7. Network dynamics... 47
Figure 2.8. Frequency Analysis and PCA. ... 49
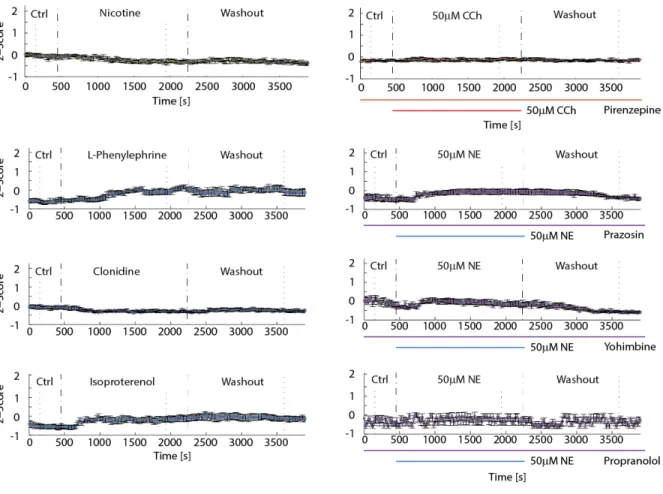
Figure 2.9. Time-course of response by receptor subtype. ... 51
Figure 3.1. Network resonance by optogenetic activation of L5 PYs. ... 80
Figure 3.2. Patch recordings of eYFP/ChR2 labelled cells. ... 82
Figure 3.3. Suppression of synaptic transmission favors slower stimuli. ... 83
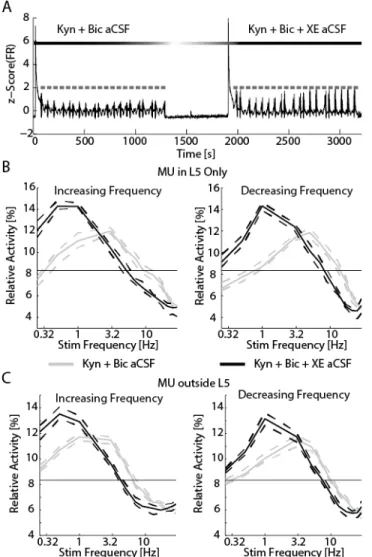
Figure 3.4 Addition of XE-991 reduced the resonant frequency of networks. ... 84
Figure 3.5. XE-991 remained effective in the presence of suppressed synaptic transmission. ... 85
Figure 3.6. Blockade of Ih reduced the resonant frequency of networks. ... 86
Figure 3.7. Ih played a limited role in resonance when synaptic transmission was suppressed. ... 87
Figure 3.8. The effect of Ih depended on synaptic transmission. ... 89
Figure 4.1. Optogenetic stimulation activates cortical networks in vitro. ... 115
Figure 4.2. Interaction dynamics between endogenous oscillation and EF stimulation. ... 116
Figure 4.3. Firing rate modulation by EF stimulation. ... 117
Figure 4.4. Modulation of frequency structure in absence of an endogenous oscillation... 119
Figure 4.6. EF stimulation of networks exhibiting cortical oscillations with
variable UP and DOWN state duration. ... 121
Figure 4.7. High amplitude EF stimulation. ... 122
Figure 5.1. Simple Static Model Explains State-Dependence. ... 153
Figure 5.2. Computational Model Explains Outlasting Effects of Periodic Stimulation. ... 155
Figure 5.3. Electrode Locations and Artifact Suppression. ... 157
Figure 5.4. State-Dependent Modulation by Periodic Stimulation ... 159
LIST OF ABBREVIATIONS
AC Alternating current
ACh Acetylcholine
aCSF Artificial cerebral spinal fluid
AMPA α-amino-3-hydroxy-5-methyl-4-isoxazolepropionic acid ANOVA Analysis of variance
ApEn Approximate entropy
BDNF Brain-derived neurotropic factor CA3 Cornu Ammonis region 3 CCEP Cortico-cortical evoked potential
CCh Carbachol
ChR2 Channelrhodopsin 2
DC Direct current
DSM Diagnostic and Statistical Manual of Mental Disorders ECoG Electrocorticography
EEG Electroencephalogram
EF Electric Field
eYFP Enhanced yellow fluorescent protein FDA Food and Drug Administration
FR Firing rate
GABA γ-aminobutyric acid
HCN Hyperpolarization-activated cyclic nucleotide-gated IAF Individualized alpha frequency
Kv7 Voltage-gated slowly inactivating potassium LTD Long term depression
MEA Multi-electrode array
MI Modulation index
mPFC Medial prefrontal cortex
MU Multiunit
NE Norepinephrine
NIMH National Institute of Mental Health NMDA N-methyl-D-aspartic acid
PCA Principal component analysis PPF Paired pulse facilitation PSD Power spectral density
PV Parvalbumin
RDoC Research Domain Criteria
SU Single unit
tACS Transcranial alternating current stimulation tCS Transcranial current stimulation
tDCS Transcranial direct current stimulation Thy1 Thy-1 cell surface antigen
TMS Transcranial magnetic stimulation V1 Primary visual cortex
CHAPTER 1: INTRODUCTION
In the US, mental illness affects as much as 32.4 percent of the population (Bagalman & Napili, 2015). The cost of treatment, disability benefits, and lost wages total in the US $317.6 billion annually (T. R. Insel, 2008). Despite the large sum spent on mental health, patients with mental illness have a higher mortality rate; 1.2 to 4.9 times that of healthy individuals (Colton & Manderscheid, 2006). Together these data demonstrate that mental health is widely recognized issue but that there is a need for improved treatment of disease. The lack of clear diagnoses is a large contributing factor to the state of mental health treatment. A recent study found that nine of twenty-three types of mental illnesses were diagnosed with questionable or unacceptable consistency between clinicians in the same academic center (Regier et al., 2013). Incorrect diagnosis often results in ineffective treatment. Such variability in diagnoses is due in part to the lack of defined measureable indicators of disease, for most mental illnesses. To address this issue, the National Institute of Mental Health has recently adopted the research domain criteria (RDoC) project. Using RDoC, network brain activity correlates of disease may be identified using
electrophysiological or functional neuroimaging methods (T. Insel et al., 2010). The use of quantifiable measures in disease identification should reduce diagnostic variability between clinicians, limiting dollars spent on ineffective treatments and improving patient health. This new paradigm of diagnosis and treatments based on aberrant network activity rather than behavioral criteria alone is still in its early stages.
organize into networks comprised of a few to hundreds of cells (Buzsáki, 2006). Small networks can control the most rudimentary of behaviors such as automatic breath expiration control. However for complex behaviors, networks organize into brain areas which work together to integrate multi-sensory stimuli and memory into responses (Prabhakaran, Smith, Desmond, Glover, & Gabrieli, 1997). In addition to the broad spatial scale of neural activity, the brain functions both as an electrical and chemical system. For example, molecules which bind to the receptors in cell membrane may simply open a channel allowing ions to flow down their concentration gradient causing a change in the voltage across the cell membrane or start a signaling cascade which alters the biochemistry within the cell. Such complexity means that fully described disease pathology and treatment should be understood at the levels of genes and proteins through biomolecular and electrical activities of cells to electrical activities of networks and brain areas finally to output behaviors. The RDoC framework specifically aims to find correlates of disease at the level of networks, particularly those which can be measured with non-invasive measures. Such network activity may represent a middle ground to bridge the gap between behavior and
biomolecular activity. In addition to aiding diagnosis in future versions of the DSM, the RDoC approach aims to relate aberrant network-level activity to the underlying biomolecular changes.
activity and recruit more cells to the oscillation. Such oscillations facilitate neuronal interaction by bringing neurons closer to action potential threshold simultaneously (Steriade, Nunez, & Amzica, 1993), which allows communication between the cells in the network (Womelsdorf, Valiante, Sahin, Miller, & Tiesinga, 2014). Network oscillations therefore synchronize cells within a network and between networks to facilitate information transfer.
To date, most interventions for mental illness have focused on behavioral therapy or
pharmacological interventions. Behavioral therapy can help patients change pathological behavior but does not directly address the underlying brain activity causing the behaviors. Conversely,
frequency for the targeted manipulation of cortical oscillations. TACS has been shown to modulate such complex behaviors as creativity (Lustenberger, Boyle, Foulser, Mellin, & Frohlich, 2015) and lucid dreaming (Voss et al., 2014). While behavioral effects can be seen in human participants, recording EEG during tACS stimulation is difficult. The current from tACS produces voltages across the scalp which are then recorded by the EEG. If the neural activity is entrained by the stimulation, the artifact from tACS should be frequency matched to the underlying neural activity. Due to this and to the modulation of the stimulation artifact by physiological signals such as heartbeat and breathing (Noury, Hipp, & Siegel, 2016) the stimulation artifact may not be easily removed by filtering. Therefore invasive electrophysiological and neuroimaging studies using animal models have provided insights into the mechanism of action of transcranial current stimulation. The tACS artifact may be removed from invasive electrophysiological recordings because action potentials may be recorded. Action potentials lie in a different frequency band from most frequencies used in most tACS paradigms and therefore the artifact may be removed by high pass filtering. By removal of the tACS artifact, invasive electrophysiology may elucidate the mechanism by which weak electric fields influence neural activity.
Work conducted using in vitro electrophysiology has provided a putative mechanism of action for stimulation with weak electric fields. When applied in parallel to the somato-dendritic axis of a cell, the cell membrane becomes slightly depolarized making the cell more likely to fire (Chan, Hounsgaard, &
transcranial current stimulation entrains networks. In this case several criteria must be met (Thut, Schyns, & Gross, 2011). First the stimulation must directly affect the network. Secondly, the stimulation must not instantaneously reset the phase of the ongoing oscillation but subtly change it to match the frequency of the stimulation over time. Once entrained, the network will match the frequency of the stimulation with some constant phase delay. Computational models have suggested that sinusoidal stimulation results in entrainment of networks by demonstrating an Arnold tongue response (Ali, Sellers, & Frohlich, 2013). An Arnold tongue is a property of coupled harmonic oscillators where an oscillator can become entrained to a periodic stimulus based on the amplitude and frequency of the stimulus. For small amplitude stimuli, entrainment occurs only when the frequency is matched to the endogenous frequency of the oscillator. As stimulus amplitude increases, the range of frequencies which entrain the oscillator become larger. Very high amplitude stimuli are therefore able to entrain the network to any frequency, but this amplitude is likely much greater than the subthreshold stimulus given by tACS. When tACS is applied it is generally assumed that the stimulus is near enough to the endogenous oscillation to entrain it to match the frequency of the stimulation. To date the hypothesis that tACS can entrain the ongoing neural oscillation has only been tested with visual stimulus (Notbohm, Kurths, & Herrmann, 2016) or indirectly with tACS by comparing short bursts of stimulation to stimulation with longer duration (Vossen, Gross, & Thut, 2015).
In addition to identification of pathological network level activity, the RDoC framework places value on relating network phenomena to the underlying cellular mechanisms and ultimately to the genetic and epigenetic underpinnings of disease. By regulation of translation the number and location of
receptors, many of which have unknown functions in the central nervous system (Jassal et al., 2010). Metabotropic receptors are the targets of roughly half of all prescription drugs (Gudermann, Nurnberg, & Schultz, 1995). Conversely, ion channels (including ionotropic receptors) allow ions to pass through the cell membrane along their concentration gradient. Ion channels can be voltage gated, opening and closing based on the voltage across the cell membrane; ligand gated, opening only when a molecule is bound to the channel; or both. For example the hyperpolarization activated cyclic nucleotide gated (HCN) channel requires the binding of cyclic adenosine monophosphate (cAMP) and a sufficiently
hyperpolarized membrane potential to allow the flow of K+ ions into the cell (Robinson & Siegelbaum, 2003). Such ion channel and receptor activity sets the state of the neurons in a network. For example noradrenergic activation can set network activity to awake state activity from resting state activity (Constantinople & Bruno, 2011).
Much of the work I present here was performed in cortical slices. In this method, live sections of neocortex are isolated and the supra-threshold spiking activity recorded. The slices are provided nutrients through a continuous flow of artificial cerebral spinal fluid (aCSF) into the recording chamber.
Pharmacological agents may be added to the aCSF allowing the examination of the effect of the agent on neurons. Multielectrode array (MEA) recordings record spiking activity of cells within a short distance from the electrode. Technological advances have made it possible to record from acute cortical slices rather than cultures grown directly on electrodes (Egert, Heck, & Aertsen, 2002). Slices of extracted tissue offer an advantage over experiments with neuron cultures grown directly on the recording electrodes.
activity so that the dynamics of individual cells may be studied in isolation (Sanchez-Vives & McCormick, 2000). To overcome this lack of spontaneous activity, artificial cerebral spinal fluid (aCSF) which more closely resembles the ion concentrations found in the cerebral spinal fluid in vivo has been used. Critically, the magnesium and calcium ion concentrations are reduced from 2 mM in found in most slice preparations to 1 mM which has been shown to lead to spontaneous activity in the form of slow
oscillations (Sanchez-Vives & McCormick, 2000). Such spontaneous activity is critical for evaluation of the effect of stimulation on networks.
Optogenetic stimulation provides an interesting avenue to study the mechanisms of network activity and brain stimulation in animal models (Frohlich & Schmidt, 2013). With this technique, a gene is inserted into the genome of a specific type of neuron or specific region which cause the cells to express a light sensitive ion channel, Channelrhodopsin-2 (ChR2). When stimulated with blue light (460 nm), the ChR2 channel opens and allows ions to flow out of the cell, which depolarizes the cell (Zhang, Wang, Boyden, & Deisseroth, 2006). With sufficient light intensity at the cell soma, such depolarizations can be great enough to evoke supra-threshold spiking activity in the cells which are stimulated. Here, I have utilized Thy1-ChR2 mouse line which expresses ChR2 in a large portion of layer 5 pyramidal cells (L5 PYs) throughout the neocortex (Arenkiel et al., 2007). When stimulated with blue light, many L5 cells depolarize and fire spikes in response to the stimulation. Such cell type specificity allows the dissection of the role of individual cell types within the network. For example, L5 PYs are critical to slow oscillations in neocortex and have been shown to fire first during the UP (or depolarized) phase of the oscillation (Chauvette, Volgushev, & Timofeev, 2010; Sanchez-Vives & McCormick, 2000). However with
optogenetic activation of many of these cells, UP states may be triggered which are similar to naturally occurring UP states, demonstrating that stimulation of these cells is sufficient for the cortical UP state (Beltramo et al., 2013). This finding provided the basis for recruitment of network oscillations in vitro presented here. While the aCSF allowed for spontaneous activity, without optogenetic stimulation cells within the network remained relatively independent. However, with optogenetic stimulus many cells were recruited to the network oscillation which are often lacking from in vitro preparations.
REFERENCES
Ali, M. M., Sellers, K. K., & Frohlich, F. (2013). Transcranial alternating current stimulation modulates large-scale cortical network activity by network resonance. The Journal of neuroscience : the official journal of the Society for Neuroscience, 33(27), 11262-11275.
doi:10.1523/JNEUROSCI.5867-12.2013
Arenkiel, B. R., Peca, J., Davison, I. G., Feliciano, C., Deisseroth, K., Augustine, G. J., . . . Feng, G. (2007). In vivo light-induced activation of neural circuitry in transgenic mice expressing channelrhodopsin-2. Neuron, 54(2), 205-218. doi:10.1016/j.neuron.2007.03.005
Bagalman, E., & Napili, A. (2015). Prevalence of Mental Illness in the United States: Data Sources and Estimates. Retrieved from
Beltramo, R., D'Urso, G., Dal Maschio, M., Farisello, P., Bovetti, S., Clovis, Y., . . . Fellin, T. (2013). Layer-specific excitatory circuits differentially control recurrent network dynamics in the neocortex. Nature neuroscience, 16(2), 227-234. doi:10.1038/nn.3306
Berger, H. (1929). Über das Elektrenkephalogramm des Menschen. Archiv für Psychiatrie und Nervenkrankheiten, 87(1), 527-570.
Bikson, M., Inoue, M., Akiyama, H., Deans, J. K., Fox, J. E., Miyakawa, H., & Jefferys, J. G. (2004). Effects of uniform extracellular DC electric fields on excitability in rat hippocampal slices in vitro. The Journal of physiology, 557(Pt 1), 175-190. doi:10.1113/jphysiol.2003.055772
Brown, D. A., & Adams, P. R. (1980). Muscarinic suppression of a novel voltage-sensitive K+ current in a vertebrate neurone. Nature, 283(5748), 673-676.
Buzsáki, G. (2006). Rhythms of the brain. Oxford ; New York: Oxford University Press.
Buzsaki, G., Anastassiou, C. A., & Koch, C. (2012). The origin of extracellular fields and currents--EEG, ECoG, LFP and spikes. Nat Rev Neurosci, 13(6), 407-420. doi:10.1038/nrn3241
Chan, C. Y., Hounsgaard, J., & Nicholson, C. (1988). Effects of electric fields on transmembrane potential and excitability of turtle cerebellar Purkinje cells in vitro. The Journal of physiology, 402, 751-771.
Chauvette, S., Volgushev, M., & Timofeev, I. (2010). Origin of active states in local neocortical networks during slow sleep oscillation. Cerebral cortex, 20(11), 2660-2674. doi:10.1093/cercor/bhq009
Constantinople, C. M., & Bruno, R. M. (2011). Effects and mechanisms of wakefulness on local cortical networks. Neuron, 69(6), 1061-1068. doi:10.1016/j.neuron.2011.02.040
Deans, J. K., Powell, A. D., & Jefferys, J. G. (2007). Sensitivity of coherent oscillations in rat hippocampus to AC electric fields. The Journal of physiology, 583(Pt 2), 555-565.
doi:10.1113/jphysiol.2007.137711
Egert, U., Heck, D., & Aertsen, A. (2002). Two-dimensional monitoring of spiking networks in acute brain slices. Experimental brain research. Experimentelle Hirnforschung. Experimentation cerebrale, 142(2), 268-274. doi:10.1007/s00221-001-0932-5
Fava, M. (2003). Diagnosis and definition of treatment-resistant depression. Biological psychiatry, 53(8), 649-659.
Fee, M. S., Mitra, P. P., & Kleinfeld, D. (1996). Automatic sorting of multiple unit neuronal signals in the presence of anisotropic and non-Gaussian variability. Journal of neuroscience methods, 69(2), 175-188. doi:10.1016/S0165-0270(96)00050-7
Frohlich, F. (2014). Endogenous and exogenous electric fields as modifiers of brain activity: rational design of noninvasive brain stimulation with transcranial alternating current stimulation. Dialogues in clinical neuroscience, 16(1), 93-102.
Frohlich, F., & McCormick, D. A. (2010). Endogenous electric fields may guide neocortical network activity. Neuron, 67(1), 129-143. doi:10.1016/j.neuron.2010.06.005
Frohlich, F., & Schmidt, S. L. (2013). Rational design of transcranial current stimulation (TCS) through mechanistic insights into cortical network dynamics. Frontiers in human neuroscience, 7, 804. doi:10.3389/fnhum.2013.00804
Gluckman, B. J., Nguyen, H., Weinstein, S. L., & Schiff, S. J. (2001). Adaptive electric field control of epileptic seizures. The Journal of neuroscience : the official journal of the Society for
Neuroscience, 21(2), 590-600.
Gudermann, T., Nurnberg, B., & Schultz, G. (1995). Receptors and G proteins as primary components of transmembrane signal transduction. Part 1. G-protein-coupled receptors: structure and function. J Mol Med (Berl), 73(2), 51-63.
Horvath, J., Forte, C., & O, C. (2015). Quantitative Review Finds No Evidence of Cognitive Effects in Healthy Populations From Single-session Transcranial Direct Current Stimulation (tDCS). Brain stimulation. doi:10.1016/j.brs.2015.01.400
Insel, T. R. (2008). Assessing the economic costs of serious mental illness. The American journal of psychiatry, 165(6), 663-665. doi:10.1176/appi.ajp.2008.08030366
Jassal, B., Jupe, S., Caudy, M., Birney, E., Stein, L., Hermjakob, H., & D'Eustachio, P. (2010). The systematic annotation of the three main GPCR families in Reactome. Database (Oxford), 2010, baq018. doi:10.1093/database/baq018
Lustenberger, C., Boyle, M. R., Foulser, A. A., Mellin, J. M., & Frohlich, F. (2015). Functional role of frontal alpha oscillations in creativity. Cortex; a journal devoted to the study of the nervous system and behavior, 67, 74-82. doi:10.1016/j.cortex.2015.03.012
Monai, H., Ohkura, M., Tanaka, M., Oe, Y., Konno, A., Hirai, H., . . . Hirase, H. (2016). Calcium imaging reveals glial involvement in transcranial direct current stimulation-induced plasticity in mouse brain. Nat Commun, 7, 11100. doi:10.1038/ncomms11100
Nitsche, M. A., Fricke, K., Henschke, U., Schlitterlau, A., Liebetanz, D., Lang, N., . . . Paulus, W. (2003). Pharmacological modulation of cortical excitability shifts induced by transcranial direct current stimulation in humans. The Journal of physiology, 553(Pt 1), 293-301.
doi:10.1113/jphysiol.2003.049916
Nitsche, M. A., & Paulus, W. (2000). Excitability changes induced in the human motor cortex by weak transcranial direct current stimulation. The Journal of physiology, 527 Pt 3, 633-639.
Notbohm, A., Kurths, J., & Herrmann, C. S. (2016). Modification of Brain Oscillations via Rhythmic Light Stimulation Provides Evidence for Entrainment but Not for Superposition of Event-Related Responses. Frontiers in human neuroscience, 10, 10. doi:10.3389/fnhum.2016.00010
Noury, N., Hipp, J. F., & Siegel, M. (2016). Physiological processes non-linearly affect electrophysiological recordings during transcranial electric stimulation. NeuroImage. doi:10.1016/j.neuroimage.2016.03.065
O'Reardon, J. P., Solvason, H. B., Janicak, P. G., Sampson, S., Isenberg, K. E., Nahas, Z., . . . Sackeim, H. A. (2007). Efficacy and safety of transcranial magnetic stimulation in the acute treatment of major depression: a multisite randomized controlled trial. Biological psychiatry, 62(11), 1208-1216. doi:10.1016/j.biopsych.2007.01.018
Prabhakaran, V., Smith, J. A., Desmond, J. E., Glover, G. H., & Gabrieli, J. D. (1997). Neural substrates of fluid reasoning: an fMRI study of neocortical activation during performance of the Raven's Progressive Matrices Test. Cogn Psychol, 33(1), 43-63. doi:10.1006/cogp.1997.0659
Radman, T., Su, Y., An, J. H., Parra, L. C., & Bikson, M. (2007). Spike timing amplifies the effect of electric fields on neurons: implications for endogenous field effects. The Journal of neuroscience : the official journal of the Society for Neuroscience, 27(11), 3030-3036.
Rahman, A., Reato, D., Arlotti, M., Gasca, F., Datta, A., Parra, L. C., & Bikson, M. (2013). Cellular effects of acute direct current stimulation: somatic and synaptic terminal effects. The Journal of
physiology, 591(10), 2563-2578. doi:10.1113/jphysiol.2012.247171
Regier, D. A., Narrow, W. E., Clarke, D. E., Kraemer, H. C., Kuramoto, S. J., Kuhl, E. A., & Kupfer, D. J. (2013). DSM-5 field trials in the United States and Canada, Part II: test-retest reliability of selected categorical diagnoses. The American journal of psychiatry, 170(1), 59-70. doi:10.1176/appi.ajp.2012.12070999
Robinson, R. B., & Siegelbaum, S. A. (2003). Hyperpolarization-activated cation currents: from molecules to physiological function. Annual review of physiology, 65, 453-480.
doi:10.1146/annurev.physiol.65.092101.142734
Sanchez-Vives, M. V., & McCormick, D. A. (2000). Cellular and network mechanisms of rhythmic recurrent activity in neocortex. Nature neuroscience, 3(10), 1027-1034. doi:10.1038/79848
Snyder, S. M., Rugino, T. A., Hornig, M., & Stein, M. A. (2015). Integration of an EEG biomarker with a clinician's ADHD evaluation. Brain Behav, 5(4), e00330. doi:10.1002/brb3.330
Steriade, M., Nunez, A., & Amzica, F. (1993). Intracellular analysis of relations between the slow (< 1 Hz) neocortical oscillation and other sleep rhythms of the electroencephalogram. The Journal of neuroscience : the official journal of the Society for Neuroscience, 13(8), 3266-3283.
Thut, G., Schyns, P. G., & Gross, J. (2011). Entrainment of perceptually relevant brain oscillations by non-invasive rhythmic stimulation of the human brain. Frontiers in psychology, 2, 170.
doi:10.3389/fpsyg.2011.00170
Voss, U., Holzmann, R., Hobson, A., Paulus, W., Koppehele-Gossel, J., Klimke, A., & Nitsche, M. A. (2014). Induction of self awareness in dreams through frontal low current stimulation of gamma activity. Nature neuroscience, 17(6), 810-812. doi:10.1038/nn.3719
Vossen, A., Gross, J., & Thut, G. (2015). Alpha Power Increase After Transcranial Alternating Current Stimulation at Alpha Frequency (alpha-tACS) Reflects Plastic Changes Rather Than Entrainment. Brain stimulation, 8(3), 499-508. doi:10.1016/j.brs.2014.12.004
Wang, X. J. (2010). Neurophysiological and computational principles of cortical rhythms in cognition. Physiological reviews, 90(3), 1195-1268. doi:10.1152/physrev.00035.2008
Womelsdorf, T., Valiante, T. A., Sahin, N. T., Miller, K. J., & Tiesinga, P. (2014). Dynamic circuit motifs underlying rhythmic gain control, gating and integration. Nature neuroscience, 17(8), 1031-1039. doi:10.1038/nn.3764
Ali, M. M., Sellers, K. K., & Frohlich, F. (2013). Transcranial alternating current stimulation modulates large-scale cortical network activity by network resonance. The Journal of neuroscience : the official journal of the Society for Neuroscience, 33(27), 11262-11275.
doi:10.1523/JNEUROSCI.5867-12.2013
Arenkiel, B. R., Peca, J., Davison, I. G., Feliciano, C., Deisseroth, K., Augustine, G. J., . . . Feng, G. (2007). In vivo light-induced activation of neural circuitry in transgenic mice expressing channelrhodopsin-2. Neuron, 54(2), 205-218. doi:10.1016/j.neuron.2007.03.005
Bagalman, E., & Napili, A. (2015). Prevalence of Mental Illness in the United States: Data Sources and Estimates. Retrieved from
Beltramo, R., D'Urso, G., Dal Maschio, M., Farisello, P., Bovetti, S., Clovis, Y., . . . Fellin, T. (2013). Layer-specific excitatory circuits differentially control recurrent network dynamics in the neocortex. Nature neuroscience, 16(2), 227-234. doi:10.1038/nn.3306
Berger, H. (1929). Über das Elektrenkephalogramm des Menschen. Archiv für Psychiatrie und Nervenkrankheiten, 87(1), 527-570.
Bikson, M., Inoue, M., Akiyama, H., Deans, J. K., Fox, J. E., Miyakawa, H., & Jefferys, J. G. (2004). Effects of uniform extracellular DC electric fields on excitability in rat hippocampal slices in vitro. The Journal of physiology, 557(Pt 1), 175-190. doi:10.1113/jphysiol.2003.055772
Brown, D. A., & Adams, P. R. (1980). Muscarinic suppression of a novel voltage-sensitive K+ current in a vertebrate neurone. Nature, 283(5748), 673-676.
Buzsáki, G. (2006). Rhythms of the brain. Oxford ; New York: Oxford University Press.
Buzsaki, G., Anastassiou, C. A., & Koch, C. (2012). The origin of extracellular fields and currents--EEG, ECoG, LFP and spikes. Nat Rev Neurosci, 13(6), 407-420. doi:10.1038/nrn3241
Chan, C. Y., Hounsgaard, J., & Nicholson, C. (1988). Effects of electric fields on transmembrane potential and excitability of turtle cerebellar Purkinje cells in vitro. The Journal of physiology, 402, 751-771.
Chauvette, S., Volgushev, M., & Timofeev, I. (2010). Origin of active states in local neocortical networks during slow sleep oscillation. Cerebral cortex, 20(11), 2660-2674. doi:10.1093/cercor/bhq009
Colton, C. W., & Manderscheid, R. W. (2006). Congruencies in increased mortality rates, years of potential life lost, and causes of death among public mental health clients in eight states. Prev Chronic Dis, 3(2), A42.
Deans, J. K., Powell, A. D., & Jefferys, J. G. (2007). Sensitivity of coherent oscillations in rat hippocampus to AC electric fields. The Journal of physiology, 583(Pt 2), 555-565.
doi:10.1113/jphysiol.2007.137711
Egert, U., Heck, D., & Aertsen, A. (2002). Two-dimensional monitoring of spiking networks in acute brain slices. Experimental brain research. Experimentelle Hirnforschung. Experimentation cerebrale, 142(2), 268-274. doi:10.1007/s00221-001-0932-5
Fava, M. (2003). Diagnosis and definition of treatment-resistant depression. Biological psychiatry, 53(8), 649-659.
Fee, M. S., Mitra, P. P., & Kleinfeld, D. (1996). Automatic sorting of multiple unit neuronal signals in the presence of anisotropic and non-Gaussian variability. Journal of neuroscience methods, 69(2), 175-188. doi:10.1016/S0165-0270(96)00050-7
Frohlich, F. (2014). Endogenous and exogenous electric fields as modifiers of brain activity: rational design of noninvasive brain stimulation with transcranial alternating current stimulation. Dialogues in clinical neuroscience, 16(1), 93-102.
Frohlich, F., & McCormick, D. A. (2010). Endogenous electric fields may guide neocortical network activity. Neuron, 67(1), 129-143. doi:10.1016/j.neuron.2010.06.005
Frohlich, F., & Schmidt, S. L. (2013). Rational design of transcranial current stimulation (TCS) through mechanistic insights into cortical network dynamics. Frontiers in human neuroscience, 7, 804. doi:10.3389/fnhum.2013.00804
Gluckman, B. J., Nguyen, H., Weinstein, S. L., & Schiff, S. J. (2001). Adaptive electric field control of epileptic seizures. The Journal of neuroscience : the official journal of the Society for
Neuroscience, 21(2), 590-600.
Gudermann, T., Nurnberg, B., & Schultz, G. (1995). Receptors and G proteins as primary components of transmembrane signal transduction. Part 1. G-protein-coupled receptors: structure and function. J Mol Med (Berl), 73(2), 51-63.
Horvath, J., Forte, C., & O, C. (2015). Quantitative Review Finds No Evidence of Cognitive Effects in Healthy Populations From Single-session Transcranial Direct Current Stimulation (tDCS). Brain stimulation. doi:10.1016/j.brs.2015.01.400
Insel, T., Cuthbert, B., Garvey, M., Heinssen, R., Pine, D. S., Quinn, K., . . . Wang, P. (2010). Research domain criteria (RDoC): toward a new classification framework for research on mental disorders. The American journal of psychiatry, 167(7), 748-751. doi:10.1176/appi.ajp.2010.09091379
Jassal, B., Jupe, S., Caudy, M., Birney, E., Stein, L., Hermjakob, H., & D'Eustachio, P. (2010). The systematic annotation of the three main GPCR families in Reactome. Database (Oxford), 2010, baq018. doi:10.1093/database/baq018
Lustenberger, C., Boyle, M. R., Foulser, A. A., Mellin, J. M., & Frohlich, F. (2015). Functional role of frontal alpha oscillations in creativity. Cortex; a journal devoted to the study of the nervous system and behavior, 67, 74-82. doi:10.1016/j.cortex.2015.03.012
Monai, H., Ohkura, M., Tanaka, M., Oe, Y., Konno, A., Hirai, H., . . . Hirase, H. (2016). Calcium imaging reveals glial involvement in transcranial direct current stimulation-induced plasticity in mouse brain. Nat Commun, 7, 11100. doi:10.1038/ncomms11100
Nitsche, M. A., Fricke, K., Henschke, U., Schlitterlau, A., Liebetanz, D., Lang, N., . . . Paulus, W. (2003). Pharmacological modulation of cortical excitability shifts induced by transcranial direct current stimulation in humans. The Journal of physiology, 553(Pt 1), 293-301.
doi:10.1113/jphysiol.2003.049916
Nitsche, M. A., & Paulus, W. (2000). Excitability changes induced in the human motor cortex by weak transcranial direct current stimulation. The Journal of physiology, 527 Pt 3, 633-639.
Notbohm, A., Kurths, J., & Herrmann, C. S. (2016). Modification of Brain Oscillations via Rhythmic Light Stimulation Provides Evidence for Entrainment but Not for Superposition of Event-Related Responses. Frontiers in human neuroscience, 10, 10. doi:10.3389/fnhum.2016.00010
Noury, N., Hipp, J. F., & Siegel, M. (2016). Physiological processes non-linearly affect electrophysiological recordings during transcranial electric stimulation. NeuroImage. doi:10.1016/j.neuroimage.2016.03.065
O'Reardon, J. P., Solvason, H. B., Janicak, P. G., Sampson, S., Isenberg, K. E., Nahas, Z., . . . Sackeim, H. A. (2007). Efficacy and safety of transcranial magnetic stimulation in the acute treatment of major depression: a multisite randomized controlled trial. Biological psychiatry, 62(11), 1208-1216. doi:10.1016/j.biopsych.2007.01.018
Prabhakaran, V., Smith, J. A., Desmond, J. E., Glover, G. H., & Gabrieli, J. D. (1997). Neural substrates of fluid reasoning: an fMRI study of neocortical activation during performance of the Raven's Progressive Matrices Test. Cogn Psychol, 33(1), 43-63. doi:10.1006/cogp.1997.0659
Radman, T., Su, Y., An, J. H., Parra, L. C., & Bikson, M. (2007). Spike timing amplifies the effect of electric fields on neurons: implications for endogenous field effects. The Journal of neuroscience : the official journal of the Society for Neuroscience, 27(11), 3030-3036.
doi:10.1523/JNEUROSCI.0095-07.2007
Rahman, A., Reato, D., Arlotti, M., Gasca, F., Datta, A., Parra, L. C., & Bikson, M. (2013). Cellular effects of acute direct current stimulation: somatic and synaptic terminal effects. The Journal of
Regier, D. A., Narrow, W. E., Clarke, D. E., Kraemer, H. C., Kuramoto, S. J., Kuhl, E. A., & Kupfer, D. J. (2013). DSM-5 field trials in the United States and Canada, Part II: test-retest reliability of selected categorical diagnoses. The American journal of psychiatry, 170(1), 59-70. doi:10.1176/appi.ajp.2012.12070999
Robinson, R. B., & Siegelbaum, S. A. (2003). Hyperpolarization-activated cation currents: from molecules to physiological function. Annual review of physiology, 65, 453-480.
doi:10.1146/annurev.physiol.65.092101.142734
Sanchez-Vives, M. V., & McCormick, D. A. (2000). Cellular and network mechanisms of rhythmic recurrent activity in neocortex. Nature neuroscience, 3(10), 1027-1034. doi:10.1038/79848
Snyder, S. M., Rugino, T. A., Hornig, M., & Stein, M. A. (2015). Integration of an EEG biomarker with a clinician's ADHD evaluation. Brain Behav, 5(4), e00330. doi:10.1002/brb3.330
Steriade, M., Nunez, A., & Amzica, F. (1993). Intracellular analysis of relations between the slow (< 1 Hz) neocortical oscillation and other sleep rhythms of the electroencephalogram. The Journal of neuroscience : the official journal of the Society for Neuroscience, 13(8), 3266-3283.
Thut, G., Schyns, P. G., & Gross, J. (2011). Entrainment of perceptually relevant brain oscillations by non-invasive rhythmic stimulation of the human brain. Frontiers in psychology, 2, 170.
doi:10.3389/fpsyg.2011.00170
Voss, U., Holzmann, R., Hobson, A., Paulus, W., Koppehele-Gossel, J., Klimke, A., & Nitsche, M. A. (2014). Induction of self awareness in dreams through frontal low current stimulation of gamma activity. Nature neuroscience, 17(6), 810-812. doi:10.1038/nn.3719
Vossen, A., Gross, J., & Thut, G. (2015). Alpha Power Increase After Transcranial Alternating Current Stimulation at Alpha Frequency (alpha-tACS) Reflects Plastic Changes Rather Than Entrainment. Brain stimulation, 8(3), 499-508. doi:10.1016/j.brs.2014.12.004
Wang, X. J. (2010). Neurophysiological and computational principles of cortical rhythms in cognition. Physiological reviews, 90(3), 1195-1268. doi:10.1152/physrev.00035.2008
Womelsdorf, T., Valiante, T. A., Sahin, N. T., Miller, K. J., & Tiesinga, P. (2014). Dynamic circuit motifs underlying rhythmic gain control, gating and integration. Nature neuroscience, 17(8), 1031-1039. doi:10.1038/nn.3764
CHAPTER 2: DIFFERENTIAL EFFECTS OF CHOLINERGIC AND NORADRENERGIC NEUROMODULATIONON SPONTANEOUS CORTICAL NETWORK DYNAMICS1
INTRODUCTION
Cortical networks exhibit a broad range of different activity states that range from slow, rhythmic discharges during slow-wave sleep to fully desynchronized activity patterns during periods of behavioral arousal and focused attention (Steriade & Amzica, 1998; Steriade, Timofeev, & Grenier, 2001). The neuromodulators acetylcholine and norepinephrine play a key role in controlling this activation which leads to desynchronization of cortical network dynamics (Armitage, Hall, & Sellers, 1969; Celesia & Jasper, 1966; Constantinople & Bruno, 2011; Jouvet, 1969; Kalmbach, Hedrick, & Waters, 2012).
However, phasic release of these neuromodulators also occurs in the awake state in response to different behavioral triggers. Acetylcholine appears to be tightly linked to attentional processing and learning whereas norepinephrine is released under circumstances of substantial changes in the environment that need overall behavioral adjustment (Baxter & Chiba, 1999; Dalley et al., 2001; Vankov, Herve-Minvielle, & Sara, 1995; Yu & Dayan, 2005). Both neuromodulators target a wide-range of cellular targets that affect intrinsic and synaptic excitability in a complex way (Armstrong-James & Fox, 1983; Giocomo & Hasselmo, 2005; Hasselmo, Linster, Patil, Ma, & Cekic, 1997; Sato, Fox, & Daw, 1989; Sillito & Kemp, 1983).
Furthermore, both acetylcholine (ACh) and norepinephrine (NE) have the potential to introduce long-term circuit modification due to their ability to alter the rules by which synaptic weights are altered during experimentally-induced long-term potentiation (LTP) and long-term depression (LTD) (Huerta & Lisman, 1995; Kirkwood, Rozas, Kirkwood, Perez, & Bear, 1999; Seol et al., 2007; Thomas, Moody, Makhinson, & O'Dell, 1996). Despite this growing understanding of context-dependent release of ACh and NE and the
1
This chapter previously appeared as an article in Neuropharmacology; doi:10.1016/j.neuropharm.2013.04.045
corresponding cellular targets, very little is known about the direct effect of these neuromodulators on cortical network dynamics. We here examined what the net effects of neuromodulation on cortical networks are in absence of experimental and potentially unphysiological stimulation paradigms. To this purpose, we studied how spontaneous, desynchronized cortical network dynamics are modulated by using multichannel electrophysiology in acute cortical slices combined with quantitative strategies from information theory (Pincus & Goldberger, 1994) and network science (Tononi & Sporns, 2003) to elucidate the effects on the spatiotemporal network dynamics.
METHODS
Ethical Statement
All animal procedures were approved by the Institute of Animal Use and Care of the University of North Carolina – Chapel Hill and were in compliance with the National Institutes of Health guide for the care and use of Laboratory animals (NIH Publications No. 8023, revised 1978). All efforts were made to minimize animal suffering, to reduce the number of animals used, and to utilize alternative approaches where available.
Solutions
All chemicals were purchased from Sigma (St. Louis, MO). Sucrose solution: 83.0mM NaCl, 2.5mM KCl, 0.5mM CaCl2, 3.3mM MgSO4, 1.0mM NaH2PO4, 26.2mM NaHCO3, 22.0mM Dextrose Anhydrose, 72.0mM Sucrose. Artificial cerebral spinal fluid (aCSF): 119.0mM NaCl, 2.5mM KCl, 1.0mM NaH2PO4, 26.2mM NaHCO3, 22.0mM glucose, 1.0mM MgSO4, and 1.0mM CaCl2. Incubation solution: aCSF modified to contain 2.0mM MgsSO4 and 2.0mM CaCl2. Control aCSF: aCSF with added KCl to a final concentration of 3.5mM KCl. Nicotine aCSF: control aCSF with 10μM nicotine added. Pirenzipine aCSF: control aCSF with 50μM pirenzepine added. Phenylephrine aCSF: control aCSF with 50μM
Slice Preparation
Adolescent (p15-p36) C57BL/6J mice were deeply anesthetized with Euthasol and decapitated. Brains were removed and quickly placed in ice-cold sucrose solution bubbled with carbogen (95% O2, 5% CO2) and 200μm coronal slices were then cut from the primary visual cortex (V1) using a VT1000S (Leica Microsystems, Wetzlar, Germany). Slices recovered in incubation solution bubbled with carbogen for at least 45 minutes at 34°C before placement on the array.
Drug Application and Experiment Design
Slices were placed on a MEA 2100 (Multichannel Systems, Reutlingen, Germany) with perforated arrays of 59 electrodes of 30μm diameter and 200μm x 200μm spacing. The array was perfused from both sides with control aCSF bubbled with carbogen at 36°C (Figure 2.1A). After a 1800s control epoch the perfusion was switched to control aCSF with 1μM, 10μM, 50μM, or 100μM of carbachol (CCh) or NE which was then followed by a 1800s washout epoch with control aCSF. Providing oxygenated aCSF to both sides of the slice together with a high perfusion flow rate (>4 mL/min) in a relatively small chamber around the array enabled the occurrence of spontaneous activity without any pharmacological
manipulations in control conditions. Control aCSF differed from the aCSF commonly used in slice experiments by containing only 1mM Mg2+ and 1mM Ca2+. Reduced Mg2+ and Ca2+ concentration more closely resembles the concentration of CSF in vivo (Sanchez-Vives & McCormick, 2000). We found that switching to the higher, standard concentrations reduced spontaneous activity in our preparation (logarithm of firing-rate ratio: -0.29459 + 0.034543, n = 206).
To determine the receptor subtypes responsible for the effects studied here, we used specific receptor agonists and antagonists. The cholinergic signaling was dissected by nicotine as a selective agonist for nicotinic cholinergic receptors and M1-specific muscarinic antagonist pirenzepine. We isolated the three noradrenergic receptor subtypes ɑ1, ɑ2, and β by agonist L-phenylephrine, clonidine,
response was indeed mediated by the applied compound and not an artifact of the perfusion system or the experimental setup, we conducted control experiments where the perfusion was switched between two beakers of control aCSF (“placebo”).
Histology and Electrode Locations
Typically, about half of the electrodes (channels) were positioned over V1. Electrode locations were determined by superimposing the image of the slice on the array to that of the array alone (Figure 2.1B). Cortical layers were then mapped to the electrodes by measuring the relative position between pia and white matter and comparing to Nissl-stained reference sections of age-matched mice (
Figure 2.1
C).Multiunit and Single Unit Data Acquisition
Raw traces were recorded from 59 channels simultaneously, sampled at 25 kHz (Figure 2.1D-E, example traces for the entire array, many channels show robust action potential firing, enlarged individual traces show prototypic action potential waveforms, spikes) with MC_Rack (Multichannel Systems,
Reutlingen, Germany). The raw data was high-pass filtered with a 300Hz – 4th order Butterworth filter and the noise level determined by calculating the standard deviation of the recorded signal on each channel. Spikes were identified by crossing -4 times the noise level of that channel (with 1 ms dead time after each threshold crossing). As described in section 2.5, the location of each channel was determined by
representative subset of units from 8 channels (clusters from the same channel are displayed in the same color, different slice from Figure 2.2A). On average, 52 clusters were isolated from each slice or 2.97 units per channel.
Data Analysis
The data were analyzed using custom-written scripts in Matlab (Mathworks, Natick, MA). Only electrodes in V1 were spike-sorted and therefore data from other brain regions were not included in the single unit data. Raster plots were created by sorting units by their distance from pia and plotting the last 20s of each epoch (“control”, “drug application”, “washout”). Multiunit channels were identified as stable and included if 3 of 5 evenly spaced overlapping lines fitted to the firing-rate time-course had a slope of less than .006 spikes per second in the control epoch. Channels that had no spikes for a period of at least 600s were excluded. The time courses for each electrode were built by counting spikes in 3s bins for the duration of the experiment. The time-courses of each channel were then z-scored which removed biases from our calculations of medians due to different intrinsic firing rate levels across channels. Furthermore, the z-score also normalized the standard deviation. Then, the median of all channels in V1 was computed for each 3s bin. The last 300s of all three 1800s intervals (control, drug applied, and washout) were used for all subsequent analysis and discrete spike trains were constructed for each channel by binning spike times (1ms bins). To determine if the application of neuromodulators caused a significant increase or decrease of the firing rate (FR), respectively, we created a shuffle control in which the FRs of both the control and neuromodulator epochs were split into 5s windows and recombined randomly to make two new shuffled modulation indices. The modulation index was then calculated as follows:
Modulation Index = (FR(NM) – FR(Ctrl))/(FR(NM) + FR(Ctrl))
where FR(NM) denotes the FR during neuromodulator application and FR(Ctrl) denotes the FR during the preceding control epoch. The modulation index of the measured firing rate was compared to the
We calculated the average FR of each single unit for each epoch window. The effect of the neuromodulator was determined by dividing the neuromodulator epoch FR by the control epoch FR. Similar to the neuromodulator effect, the plasticity effect of each neuron was calculated by dividing the washout epoch FR by the control epoch FR. Single units where this ratio was either zero or undefined due to the complete absence of spikes in either of the epochs were excluded. These ratios are reported on a log10 scale (i.e. no effect corresponds to a value of zero). We determined skewness of effect distributions using the skewness function of Matlab. We calculated the standard error of skewness using SES = sqrt(6/n), any distribution with a skewness greater than 2*SES was considered significantly skewed. The correlation between effect and plasticity of was determined using the corrcoef function of Matlab on all cells that had a non-zero FR for all epochs. To examine the change caused by
neuromodulators as a function of cortical depth we then grouped units in layers I-IV and layers V-VI. Approximate entropy (ApEn) is a measure of signal irregularity based on how frequently individual temporal patterns reoccur in the data (Pincus & Goldberger, 1994). ApEn was calculated using an additional script for Matlab written by Kijoon Lee based on (Chon, Scully, & Lu, 2009). ApEn requires three input parameters: m, r, and N; the length of the pattern, a tolerance threshold, and the length of the data to be analyzed. Briefly, the algorithm that determines ApEn scans the data and looks for
average spectrum of 20 ISI shuffled versions of the spike train. Principal component analysis (PCA) was performed on z-scored 10ms binned spike trains and then broken into 5s non-overlapping windows using the princomp function in Matlab. PCA transformed the binned FR of all units in a slice to decorrelated component dimensions. We then sorted the component dimensions by percent variance accounted and determined the number of dimensions required to account for 50% of the total variance. Due to the discretization of this measure, we used bootstrapping on the windowed results to estimate the mean percent of total dimensions for each epoch. We then examined change in the percentage of total dimensions to account for 50% of the variance between neuromodulator applied and control epochs to assess the effect of the neuromodulators.
Statistics
All data are expressed as median values ± SEM unless otherwise noted. Medians of data shown on log10 scale were taken as the log10 of the median, while SEM for data on log10 scale was determined by
SEM = std(log10(data))/sqrt(n)
In general, FR data are typically not normally distributed (Shafi et al., 2007); we confirmed that effect size did not follow a normal distribution and therefore statistical significance was determined using Kruskal-Wallace tests in conjunction with Tukey’s multiple comparison tests at p < 0.05, unless otherwise noted. These test compute confidence intervals at p = 0.05, if the confidence intervals of two groups do not overlap then p < 0.05. However, exact p values for each comparison were not computed.
RESULTS
Neuromodulators CCh and NE Increase Spontaneous Activity
added either CCh or NE to the bath for an additional 1800s before switching back to control for another 1800s to probe for long-term network effects that outlast the presence of the neuromodulators. Raster plots of individual units (n = 726 units pooled from 13 slices for CCh, and n = 512 units from 10 slices for NE) for initial control, neuromodulator application, and subsequent washout showed that application of 50μM CCh increased the spontaneous activity which returned to baseline after washout (Figure 2.2B, Top, left to right). In the case of 50μM NE, activity also increased upon application but remained elevated after washout (Figure 2.2B, bottom, left to right). Given these distinct effects of CCh and NE on
spontaneous network dynamics, we next examined the concentration-dependence of the time-course of action of CCh and NE.
Temporal Response Profile
We determined the effect of the neuromodulators CCh and NE on network dynamics (z-scored time-course of average firing rate) as a function of time and concentration (1, 10, 50 and 100μM for both CCh and NE). For CCh experiments (Figure 2.3A 1, 10, 50 and 100μM CCh from top to bottom. n = 10, 13, 13 and 15 slices), the FR increased and remained elevated for the duration of CCh present in the bath. For higher concentrations (50 and 100μM CCh), the initial transient of the FR response to CCh became steeper and exhibited an overshoot in comparison to the steady-state response. In summary, application of CCh caused a pronounced, reversible increase in spontaneous activity.
Concentration Dependent Modulation of Spatial Spread of Spontaneous Activity
Based on the time-course plots (Figure 2.3), we next analyzed the last 300s before the end of each epoch to quantify the steady-state response to the neuromodulators. All subsequent analysis was limited to these analysis windows. We first asked if individual channels (locations in the slice) exhibited a significant FR increase or decrease with the application of neuromodulators as measure of the spatial spread of the effect. An increase in channels with altered FR indicated that a larger fraction/area of the network exhibited a response to the applied neuromodulator. The percentages of channels on each slice were then calculated for each of the three neuromodulator effect types (Figure 2.4, increase, no effect, decrease; CCh left, NE right). We first applied this measure to multiunit channels of control (“placebo”) slices where no neuromodulators were applied to exclude false positives (all values are mean % ± SEM): 20.5 ± 2.81% with significant increase and 4.2 ± 0.60% with significant decrease. As expected, the majority of channels failed to show a significant effect (75.2 ± 2.55 % for control slices; dotted horizontal lines in Figure 2.4; n = 8 slices). In contrast to the control slices, CCh mediated a
concentration-dependent effect where concentrations up to 50μM raised the percentage of channels with a significant FR increase, and only 100μM caused a lower percentage of channels to exhibit a FR increase in
comparison to 10 and 50μM (33.7 ± 1.37 for 1μM, 47.3 ± 2.06 for 10μM, 68.6 ± 1.42 for 50μM, and 40.3 ± 1.72 for 100μM; all values are mean % ± SEM; n = 10, 13, 13 and 15 slices). This
concentration-dependent increase of channels with elevated FR in response to CCh was likely mediated by recruitment of additional network locations that failed to exhibit a significant modulation by CCh for lower
concentrations (50.4 ± 1.75 for 1μM, 42.1 ± 1.86 for 10μM, 24.2 ± 1.07 for 50μM, and 49.4 ± 1.94 for 100μM, all values are mean % ± SEM). The percentage of channels with a FR increase was significantly larger than those of control slices for 10, 50 and 100μM CCh. All concentrations of CCh had significantly fewer channels with no effect than control slices (ANOVA and post-hoc Tukey’s test p < 0.05). Of the four concentrations of CCh used, only 1μM had significantly more channels with a FR decrease than control (15.9 ± 1.41 for 1μM, 10.7 ± 0.50 for 10μM, 07.2 ± 0.50 for 50μM, and 10.2 ± 0.67 for 100μM; all values are mean % ± SEM). Therefore, overall, CCh increased the spatial spread of the spontaneous activity by (1) increasing the number of locations in the network (i.e. channels) that exhibited activity and (2)
NE had a more complex effect on the spatial spread of activity; as for CCh, we found that for all concentrations NE had fewer channels with no effect than the control slices (51.5 ± 1.30 for 1μM, 49.6 ± 1.56 for 10μM, 52.8 ± 1.74 for 50μM, and 44.8 ± 1.90 for 100μM; n = 10, 13, 13 and 15 slices). However in contrast to the CCh experiments, slices did not exhibit significantly more channels with FR increases than the control slices (32.6 ± 1.44 for 1μM, 36.4 ± 1.72 for 10μM, 31.3 ± 1.49 for 50μM, and 32.7 ± 2.07 for 100μM). Only 100μM NE had significantly more channels with a FR decrease (15.9 ± 1.29 for 1μM, 13.9 ± 0.90 for 10μM, 15.9 ± 1.19 for 50μM, and 22.4 ± 1.73 for 100μM). Therefore, NE modulated the network dynamics compared to control yet the effects on the FR were bidirectional.
Magnitude of Neuromodulator and Plasticity Effects
The above analysis examined the effect of the neuromodulators on overall multiunit firing rate which consists of the action potential firing of all neurons close to the recording electrode site. We next sorted the action potential waveforms into single units (presumed individual neurons) to test for
concentration-dependent effects on the FR of individual neurons. We defined neuromodulator effect as the FR in presence of neuromodulator divided by the control FR for each single unit. The range of neuromodulator effect sizes covered six orders of magnitude since many units were very quiet during control. Figure 2.5A shows a histogram of the logarithmic effect size for increasing concentration from left to right. FR of cells in slices exposed to CCh exhibited large increases for all concentrations (0.327 ± 0.0407 for 1μM, 0.612 ± 0.0389 for 10μM, 1.39 ± 0.0433 for 50μM, and 0.730 ± 0.0450 for 100μM (all values log10); n = 395, 581, 635 and 655 units across 9, 13, 13 and 14 slices; all significantly different from each other with the exception of the comparison of 10μM to 100μM CCh). This result is in close agreement with the above-shown time course and multiunit FR data. Since the multiunit data for NE failed to show a significant increase in the number of channels with increased FR, we predicted that the effect of NE at the level of single units would be bidirectional such that some units had a FR increase whereas others had a FR decrease. Indeed, FR in units of NE-exposed slices displayed smaller median
logarithmic effect sizes (0.168 ± 0.0328 1μM, 0.398 ± 0.0342 for 10μM, 0.416 ± 0.0438 for 50μM, and 0.280 ± 0.0393 100μM; n = 685, 650, 472 and 470 units across 13, 11, 10 and 15 slices). Some
well as 10μM from 100μM NE. To determine the uniformity of the neuromodulator effects, we next examined the skewness of the effect distributions in Figure 2.5A. For this measure, if the effect of the neuromodulator increases the spontaneous activity by some factor (with some Gaussian noise) the effect size distribution is normal with a skewness of zero. We found that the effect size distributions of 10, 50 and 100μM concentrations of CCh had a significant negative skewness (0.148 ± 0.123 for 1μM, -0.228 ± 0.102 for 10μM, -0.459 ± 0.097 for 50μM, and -0.319 ± 0.096 for 100μM). Skewness of NE effect size distributions varied by concentration with significant positive skewness for the effect of 1μM NE and negative skewness for 50μM NE. (0.431 ± 0.094 for 1μM, 0.191 ± 0.096 for 10μM, -0.623 ± 0.113 for 50μM, and -0.137 ± 0.113 for 100μM). Therefore, a simple model of neuromodulator effect on cellular excitability cannot explain the experimentally determined effects.
responded to washout, we would expect the data to contain two groups; the first group would contain cells that increased their FR with NE but exhibited a FR decrease after wash-out (above unity line in Figure 2.5D) and the second group would contain cells that failed to directly respond to NE application with an increase in FR yet exhibited a delayed response after NE wash-out (below unity line). For the NE concentrations that appeared to have an outlasting effect as determined by the time-course data (Figure 2.3), we noted an increased number of cells on the unity line (blue dots, 3 rightmost panels), further supporting that the units which directly responded to NE were the ones to exhibit an outlasting FR increase.
After we determined that the FR of slices subjected to higher concentrations of NE remained elevated for the remaining 1800s of the experiments after washout of the drug, we wanted to determine how long this plasticity can remain in effect. To do so we performed 9000s experiments using 1800s of control, then 1800s with 100μM NE, followed by 5400s of washout. We then examined 300s windows at the end of control epoch (1800s), end of the NE epoch (3600s), and 5 washout epochs (5400s, 6000s, 7000s, 8000s, and 9000s). We compared the distribution of FRs of each of the washout epochs to that of the same channels in control. We found that the plasticity effect was detectable for least 40 minutes after switching to control aCSF (data not shown).
Effects of Neuromodulators by Cortical Depth
Having described the effects of both neuromodulators on average FR, we further divided the data to examine if these results depended on cortical depth. We used histological methods to determine the cortical layer of each electrode and by extension each cell recorded from that electrode. We separated cells into superficial (layers I to IV) and deep layers (V and VI) to examine the differential effect of CCh and NE between superficial and deep layers of cortex. In Figure 2.6A, we display the median
was significantly larger than that of superficial layers. As with CCh slices, all concentrations of NE trended towards a larger effect in deeper layers, however the bidirectional modulation of FR by NE obscured the results. Deeper layers of cortex exhibited a greater response to 1 and 50μM NE than those in superficial layers.
We were interested in examining both the neuromodulator and washout epochs of our experiment to determine if the response observed during the neuromodulator epoch was reversible by washout. We examined the median plasticity size of both CCh (top) and NE (bottom) for all concentrations (increasing from left to right) in Figure 2.6B. We found that when evaluating washout, single units for all CCh
concentrations return to, or undershoot baseline established by the control epoch (Table 2.1, two rightmost columns). The small difference between control and washout FR confirmed the return to baseline observed in Figure 2.2B and Figure 2.3A. Additionally, the layer dependence of the
neuromodulator effect observed in the neuromodulator epoch was not present during the washout epoch for all concentrations. After washout of CCh, there was no significant difference between superficial and deep layers for any of the concentrations studied. Having established that the same cells stay active during the plasticity epoch after washout of NE (Figure 2.5B), we expected to see one or both layer-groups remain at an elevated FR for higher concentrations of NE. Indeed, after washout of 10 or 50μM NE FR of neurons in deep layers remained significantly elevated in comparison to those in superficial layers. This indicates that the elevated spontaneous activity visible in the plasticity epoch of the time courses for these concentrations was mediated by cells in deeper layers of cortex.
Network Dynamics
spontaneous activity we examined the ApEn of each channel. ApEn is a nonlinear measure of variance that when applied to a spike train measures the amount of information that can be contained in that spike train. When we plotted the change in ApEn versus the neuromodulator effect size (the change in FR) (Figure 2.7A, CCh top, NE bottom, increasing concentration from left to right), we found that ApEn is not correlated with neuromodulator effect size and therefore indeed a measure for temporal structure and not simply of activity levels (-0.0114 for 1μM CCh, 0.212 for 10μM CCh, 0.0271 for 50μM CCh, 0.0742 for 100μM CCh, 0.290 for 1μM NE, 0.0553 for 10μM NE, 0.164 for 50μM NE and 0.319 for 100μM NE; n = 167, 225, 225, 283, 195, 272, 187 and 210 channels from 9, 13, 12, 14, 10, 11, 9 and 13 slices). We next examined the median change in ApEn (rightmost panel of Figure 2.7A for each concentration of CCh, top, and NE, bottom). We additionally validated our results against control slices (0.027 ± 0.0121, n = 150 from 6 slices) and confirm that with the exception of 100μM NE all concentrations tested significantly increased ApEn. Despite the lack of correlation between neuromodulator effect size and change in ApEn, the median change in ApEn was similar in shape to the neuromodulator effect size (0.113 ± 0.0348 for 1μM CCh, 0.449 ± 0.0353 for 10μM CCh, 0.869 ± 0.0321 for 50μM CCh, 0.492 ± 0.0355 for 100μM CCh, 0.113 ± 0.0293 for 1μM NE, 0.172 ± 0.0286 for 10μM NE, 0.146 ± 0.0332 for 50μM NE, and 0.103 ± 0.0320 for 100μM NE; n = 167, 226, 226, 285, 195, 272, 187 and 210 channels from 9, 13, 12, 14, 10, 11, 9 and 13 slices). These results imply that overall the information content of spontaneous activity
increases together with overall FR yet at the level of individual network locations the modulation of these two features (ApEn and FR) are uncorrelated and possibly mediated by distinct mechanisms.
After we determined that individual channels contain more information with application of neuromodulators, we examined the change in spatial network dynamics by measuring pairwise