Clinical Infectious Diseases
Clinical Infectious Diseases® 2017;64(4):459–67
First Occurrence of Diabetes, Chronic Kidney Disease,
and Hypertension Among North American HIV-Infected
Adults, 2000–2013
Cherise Wong,1 Stephen J. Gange,1 Kate Buchacz,2 Richard D. Moore,1 Amy C. Justice,3 Michael A. Horberg,4 M. John Gill,5 John R. Koethe,6 Peter F. Rebeiro,6 Michael J. Silverberg,7 Frank J. Palella,8 Pragna Patel,2 Mari M. Kitahata,9 Heidi M. Crane,9 Alison G. Abraham,1 Hasina Samji,10 Sonia Napravnik,11 Tareq Ahmed,10 Jennifer E. Thorne,1 Ronald J. Bosch,12 Angel M. Mayor,13 and Keri N. Althoff1; for the North American AIDS Cohort Collaboration on Research and Design (NA-ACCORD)a
1Johns Hopkins Bloomberg School of Public Health, Baltimore, Maryland; 2Centers for Disease Control and Prevention, Atlanta, Georgia; 3Veterans Affairs Connecticut Healthcare System, West Haven; 4Mid-Atlantic Permanente Research Institute, Kaiser Permanente Mid-Atlantic States, Rockville, Maryland; 5University of Calgary, Alberta, Canada; 6Vanderbilt University, Nashville, Tennessee; 7Kaiser Permanente Division of Research, Kaiser Permanente Northern California, Oakland; 8Northwestern University, Chicago, Illinois; 9University of Washington, Seattle; 10British Columbia Centre for Excellence in HIV/AIDS, Vancouver, Canada; 11University of North Carolina at Chapel Hill; 12Harvard School of Public Health, Boston, Massachusetts; and 13Universidad Central del Caribe, Bayamon, Puerto Rico
Background. There remains concern regarding the occurrence of noncommunicable diseases (NCDs) among individuals aging with human immunodeficiency virus (HIV), but few studies have described whether disparities between demographic subgroups are present among individuals on antiretroviral therapy (ART) with access to care.
Methods. We assessed the first documented occurrence of type 2 diabetes mellitus (DM), chronic kidney disease (CKD), and treated hypertension (HTN) by age, sex, and race within the North American AIDS Cohort Collaboration on Research and Design (NA-ACCORD). HIV-infected adults (≥18 years) who initiated ART were observed for first NCD occurrence between 1 January 2000 and 31 December 2013. Cumulative incidences as of age 70 were estimated accounting for the competing risk of death; Poisson regression was used to compare rates of NCD occurrence by demographic subgroup.
Results. We included >50 000 persons with >250 000 person-years of follow-up. Median follow-up was 4.7 (interquartile range, 2.4– 8.1) years. Rates of first occurrence (per 100 person-years) were 1.2 for DM, 0.6 for CKD, and 2.6 for HTN. Relative to non-black women, the cumulative incidences were increased in black women (68% vs 51% for HTN, 52% vs 41% for DM, and 38% vs 35% for CKD; all
P < .001); this disparity was also found among men (73% vs 60% for HTN, 44% vs 34% for DM, and 30% vs 25% for CKD; all P < .001). Conclusions. Racial disparities in the occurrence of DM, CKD, and HTN emphasize the need for prevention and treatment options for these HIV populations receiving care in North America.
Keywords. noncommunicable disease; disparities; aging; HIV.
Human immunodeficiency virus (HIV)–infected individu-als are living longer due to the use of effective antiretroviral therapy (ART) [1]. Principally because of this increased life expectancy, it is projected that by the end of 2017, 50% of the US population living with HIV/AIDS will be >50 years old [2]. This public health success is tempered by concerns for long-term health and quality of life. Noncommunicable diseases (NCDs) typically associated with aging in the gen-eral population have emerged as significant sources of clinical concern [3].
Type 2 diabetes mellitus (DM), chronic kidney disease (CKD), and hypertension (HTN) are important NCDs that result in significant morbidity. They have great implications on cardiovascular disease, a leading cause of death in those with HIV [4], having been identified as risk factors for atheroscle-rotic heart and other vascular diseases [5, 6]. However, whether and to what extent disparities of these NCDs exist in HIV patients receiving care is unclear. Prospective data are lacking among specific demographic subgroups with HIV previously identified as being differentially at risk for age-related diseases [7]. The objective of this study was to estimate the rates of first documented occurrence of HTN, DM, and CKD, by age, sex, and race, among ART-experienced adults living with HIV.
METHODS
Study Population
We analyzed data from the North American AIDS Cohort Collaboration on Research and Design (NA-ACCORD), a
M A J O R A R T I C L E
© The Author 2016. Published by Oxford University Press for the Infectious Diseases Soci-ety of America. All rights reserved. For permissions, e-mail: [email protected]. DOI: 10.1093/cid/ciw804
Received 22 July 2016; editorial decision 11 November 2016; accepted 29 November 2016; published online December 10, 2016.
aThe NA-ACCORD cohort and representatives are listed in the Appendix.
collaboration of single-site and multisite U.S. and Canadian cohorts of HIV-infected adults that has been described previ-ously [8]. In brief, cohort participants eligible for inclusion in NA-ACCORD were required to have at least 2 HIV care visits within 12 months. Each cohort has standardized methods of data collection and submits data on enrolled participant char-acteristics, diagnoses, laboratory measures, prescribed medica-tions, and vital status to the Data Management Core (University of Washington, Seattle). The completeness and accuracy of data are evaluated before data elements are harmonized across cohorts. Data are then sent to the Epidemiology/Biostatistics Core (Johns Hopkins University, Baltimore, Maryland), where additional quality control procedures are executed and analytic files are created.
For this analysis, clinical cohorts were included if data ele-ments to ascertain HTN, DM, and CKD were readily availa-ble. There were 16 cohorts that contributed data for HTN, 20 cohorts for DM, and 22 cohorts for CKD. Because our inter-est was in an ART-treated population, as these individuals are most likely to age with HIV and be susceptible to these NCDs, the study population was restricted to participants who were ART-experienced and contributed data at least twice between 1 January 2000 and 31 December 2013 (see Supplementary Figure 1 for more details on inclusion criteria).
Outcomes: Type 2 Diabetes Mellitus, Chronic Kidney Disease, and Treated Hypertension
The outcomes of interest were the first documented occurrence of DM, CKD, and HTN during the study period. Any DM was defined as having either a glycosylated hemoglobin (HgbA1c) level of ≥6.5%; documented use of a diabetes-specific medi-cation; or documented use of a diabetes-related medication in addition to a diagnosis of diabetes. CKD was laboratory-based, defined as 2 values of estimated glomerular filtration rate (eGFR) <60 mL/minute/1.73 m2 (>90 days apart without an intervening normal value) and calculated by the CKD-EPI (Chronic Kidney Disease Epidemiology Collaboration) equation [9]. HTN was defined as ever having a diagnosis of hypertension in conjunc-tion with documented use of antihypertensive medicaconjunc-tion, thus capturing treated hypertension.
We attempted to account for detection bias by excluding prevalent cases defined as evidence of these outcomes prior to, at, or within 9 months after study entry. For our CKD analysis, to account for a bias in the rate of CKD progression between individuals entering the study with low vs high renal function, participants were required to have an eGFR >90 mL/min-ute/1.73 m2 within 6 months prior to or after they began con-tributing person-time to the analysis.
Covariates
Sex, race (“black” for those reporting black or black Hispanic, and “non-black” otherwise, due to the small number of events that occur within more granular racial strata), and injection
drug use as a risk factor for HIV transmission (categorized as self-reported injection drug use, or injection drug use and men who have sex with men) were reported at enrollment into the NA-ACCORD. For our study, HIV transmission risk group was collapsed by injection drug use status because of previous evidence to suggest that injection drug users (IDUs) are more disadvantaged in terms of health, receiving less than optimal healthcare compared to other HIV subpopulations [10].
Smoking status was assigned based on all self-reported and medical record data contributed to NA-ACCORD. Any indi-viduals who reported using tobacco or had a clinician-doc-umented diagnosis of smoking were designated as smokers, individuals with no evidence of smoking were categorized as nonsmokers, and individuals with a missing report or diagno-sis were deemed missing. Body mass index (BMI), calculated as (kg) / [height (m)]2, was obtained no more than 6 months prior to when a participant began contributing data to the analysis. Calendar year at ART initiation was categorized as 1996–1999, 2000–2005, or 2006–2013. ART prescription was defined con-sistent with US guidelines as a regimen of ≥3 antiretroviral agents from at least 2 classes or a triple nucleoside/nucleotide reverse transcriptase inhibitor regimen containing abacavir or tenofovir [11]. A history of an AIDS diagnosis at entry into our study was defined according to 1993 criteria from the Centers for Disease Control and Prevention, excluding the CD4 T-lymphocyte count (CD4) <200 cells/µL criterion to avoid collinearity when adjusting for time-varying CD4 in our analysis [12].
CD4 was categorized as <200, 200–349, 350–499, and ≥500 cells/µL. A combined time-varying measure of viral suppression (HIV RNA value ≤400 copies/mL) and ART use was created due to the collinearity of these variables, and was categorized as (1) ART-experienced but not currently prescribed ART, (2) currently prescribed ART but not virally suppressed, and (3) currently prescribed ART and virally suppressed.
Statistical Analyses
Differences in demographic and clinical characteristics were explored with Pearson χ2 tests for categorical variables.
avoid skewed disease rates and cumulative incidence estimates as these individuals had small risk set sample sizes.
Cumulative incidence estimates as of age 70 were obtained for each disease outcome accounting for the competing risk of death [13]. We report our findings using age as the time met-ric to compare people of similar age, thus having the greatest possible control for age as a confounder [14]. In a supplement, we present our data using a scale that is comparable with other studies (time metric = time on study) [15–19]. The proportional subdistribution hazard assumption was assessed by including an interaction term between age and sex–race in our compet-ing risk regression model. Finally, to account for confoundcompet-ing by BMI, we conducted a subgroup analysis restricting to those with BMI measurements.
Analyses were performed using SAS software version 9.4 (SAS Institute, Cary, North Carolina) and Stata software version 12.1 (StataCorp, College Station, Texas). All statistical tests were 2-sided and a P value < .05 guided statistical interpretation. RESULTS
Study Population Characteristics
For each analysis, the majority of the study population was <50 years of age at study entry, male, non-black, did not report injection drug use, had not experienced AIDS, had a recent CD4 of <200 cells/µL, and was on ART but not virally sup-pressed (Table 1). Among participants with BMI measured at study entry, less than a fifth were overweight or obese for the HTN and DM analysis, but almost half were overweight or obese in the CKD analysis. Participants who developed any one of the NCDs during the study period differed by demographic and clinical characteristics at study entry compared with per-sons who remained event-free. Older age, black race, injection drug use, a history of smoking, and having initiated ART in ear-lier calendar periods were each associated with increased rates of first occurrence of HTN, DM, and CKD (Table 2).
Overall, rates of first occurrence for each disease were as follows: 2.6/100 PY for HTN (n = 9547 events; n = 4198 for non-Hispanic whites, n = 4711 for non-Hispanic blacks, n = 487 for Hispanics, and n = 151 for other), 1.2/100 PY for DM (n = 5881 events; n = 2275 for non-Hispanic whites, n = 2988 for non-Hispanic blacks, n = 498 for Hispanics, n = 120 for other), and 0.6/100 PY for CKD (n = 1785 events; n = 742 for non-Hispanic whites, n = 901 for non-Hispanic blacks, n = 100 for Hispanics, n = 42 for others). The median follow-up time for each analysis was 4.4 (interquartile range [IQR], 2.1–7.8) years, 4.8 (IQR, 2.8–8.0) years, and 5.0 (IQR, 2.5–8.5) years, respectively. Median age at diagnosis for HTN, DM, and CKD for the observed cases was 48 (IQR, 43–54), 49 (IQR, 43–55), and 51 (IQR, 45–57) years, respectively. Median follow-up for those with and without HTN was 3.6 (IQR, 2.0– 6.2) and 4.6 (IQR, 2.2–8.1) years, respectively; for those with and without DM was 3.3 (IQR, 1.5–6.0) and 5.0 (IQR, 2.4–8.1)
years, respectively; and for those with and without CKD was 5.3 (IQR, 3.2–8.0) and 5.1 (IQR, 2.5–8.5) years, respectively.
Estimation of Outcomes by Subgroup of Sex and Race
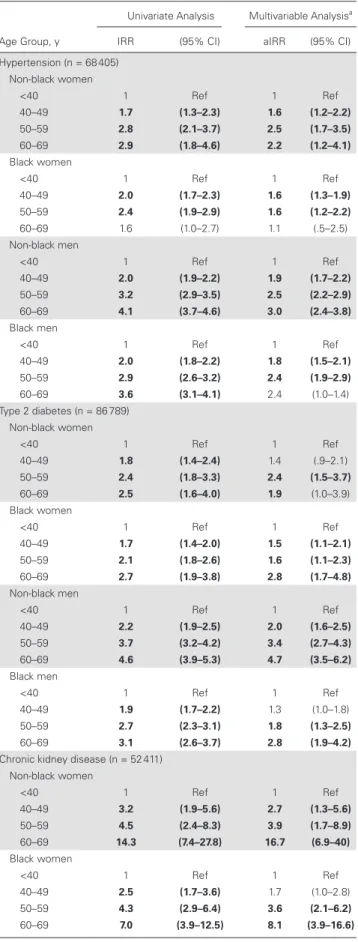
We observed disparities by sex and race after adjusting for age, risk behavior, and HIV-related factors in our Poisson analyses. Regardless of sex, black race was significantly associated with higher rates of HTN (relative to non-black men: aIRR, 1.8 [95% CI, 1.6–2.1] for black women and 1.5 [95% CI, 1.4–1.7] for black men). For DM, black men, black women, and non-black women experienced significantly higher rates of DM relative to non-black men (aIRRs, 1.4 [95% CI, 1.2–1.6], 2.0 [95% CI, 1.6–2.3], and 1.4 [95% CI, 1.2–1.7], respectively). Last, black and non-black women had significantly higher CKD rates com-pared with non-black men (aIRRs, 1.5 [95% CI, 1.2–1.9] and 1.5 [95% CI, 1.1–2.0], respectively). Study entry characteristics by sex–race subgroup are presented in Supplementary Table 1.
We also assessed whether the relationship between age and NCD was significantly different by sex–race subgroup (Figure 1). Adjusted rates of NCD occurrence increased with older age for each sex–race subgroup (Table 3), and was signif-icantly different between sex–race subgroups for HTN and DM (all P ≤ .02).
Evidence for disparities in the cumulative incidences between sex–race group was observed. Using age as the time metric, cumulative incidence estimates between sex–race groups for HTN by age 70 ranged from 51% to 73% (Figure 2A), from 34% to 52% for DM (Figure 2B), and from 25% to 38% for CKD (Figure 2C). As an example of interpreting an estimate from Figure 2A, among black men who have reached the age of 55, the probability of experiencing HTN is 51%, conditional on their surviving free of HTN up until that age. Disparities between groups of sex–race were also observed when using time on study as the time metric (results not shown; Supplementary Figure 2). The proportional hazards assumption was met (all
P ≥ .9).
Given the potential influence of BMI on NCD development, we conducted a subanalysis for the minority of participants for whom BMI data were available at study entry (n = 21 615 for HTN, n = 28 963 for DM, n = 18 996 for CKD). Sex–race dis-parities persisted after adjusting for BMI (results not shown).
DISCUSSION
CKD compared with non-black adults. Our findings are a call to action to (1) better understand the drivers of these disparities that persist in an environment with equal access to care in attempts to meet the Healthy People 2020 goals and (2) fill the gaps in NCD prevention services among adults aging with HIV [22].
Our study population experienced lower rates of HTN and CKD, and rates of DM within range of those reported in other
HIV-infected populations. In previous literature, HTN, DM, and CKD rates have been reported to range from 3.44 to 22/100 PY, from 0.31 to 2.6/100 PY, and from 0.88 to 1.12/100 PY, respectively; among HIV-uninfected individuals, ranges were 0.59–9.11/100 PY, 0.62–0.71/100 PY, and 1.04–4.46/100 PY, respectively [15–21, 23–28]. Heterogeneity in measurement of the outcomes is partially responsible for the large ranges Table 1. Characteristics of Antiretroviral Therapy–Experienced, HIV-Infected Adults at Study Entry During 2000–2013
HTN (n = 9547)
No HTN (n = 58 858)
DM (n = 5881)
No DM (n = 80 908)
CKD (n = 1785)
No CKD (n = 50 626)
Variable PY = 41 291 PY = 323 788 PY = 23 918 PY = 452 258 PY = 10 053 PY = 288 382
Age, y
<40 2734 29 27 002 46 1488 25 33 831 42 430 24 24 012 47
40–49 4201 44 21 555 37 2530 43 30 270 37 782 44 18 553 37
50–59 2234 23 8673 15 1601 27 13 789 17 480 27 7044 14
60–69 378 4 1628 3 262 4 3018 4 93 5 1017 2
Sex
Male 8464 89 48 908 83 4842 82 67 621 84 1481 83 42 200 83
Race
Non-black 4836 51 35 330 60 2893 49 47 838 59 884 50 28 592 56
Black 4711 49 23 528 40 2988 51 33 070 41 901 50 22 034 44
Injection drug use as HIV transmission risk
No 6829 72 47 617 81 4230 72 63 921 79 1191 67 39 948 79
Smokinga
Never 717 8 5927 10 397 7 9153 11 146 8 5653 11
Ever 2615 27 20 798 35 1565 27 30 142 37 646 36 19 692 39
Missing 6215 65 32 133 55 3919 67 41 613 51 993 56 25 281 50
BMI, kg/m2
<18.5 913 10 10 268 17 429 7 14 001 17 28 2 727 1
18.5–24.9 685 7 5961 10 408 7 8688 11 284 16 9293 18
25–29.9 334 3 2184 4 353 6 3401 4 150 8 5655 11
30–40 58 1 304 1 73 1 473 1 55 3 2391 5
>40 57 1 851 1 35 1 1102 1 12 1 401 1
Missing 7500 79 39 290 67 4583 78 53 243 66 1256 70 32 159 64
AIDS
No 7811 82 47 252 80 4668 79 65 016 80 1341 75 40 770 81
Calendar period of ART initiation
1996–1999 4651 49 17 707 30 2804 48 25 534 32 851 48 14 895 29
2000–2005 3669 38 21 231 36 2361 40 29 892 37 766 43 19 204 38
2006–2013 1101 12 17 595 30 638 11 22 624 28 138 8 14 962 30
CD4 count, cells/µL
>500 1684 18 10 208 17 1257 21 14 474 18 284 16 9345 18
350–499 1219 13 8223 14 852 14 11 790 15 197 11 7701 15
200–349 1772 19 11 964 20 1021 17 17 167 21 351 20 11 118 22
<200 4870 51 28 458 48 2751 47 37 471 46 953 53 22 459 44
ART and HIV RNA, copies/mL
≤400, on ART 2848 30 16 091 27 1933 33 23 031 28 439 25 14 279 28
>400, on ART 3620 38 26 026 44 2202 37 35 650 44 853 48 24 334 48
Off ART 207 2 1235 2 187 3 1936 2 60 3 1120 2
Missing 2872 30 15 506 26 1559 27 20 291 25 433 24 10 893 22
Data are presented as No. (%) unless otherwise indicated. Statistical differences were assessed comparing cases to noncases for each NCD. All covariates were statistically significant (P < .05) with the exception of sex and BMI for the CKD analysis.
Abbreviations: ART, antiretroviral therapy; BMI, body mass index; CKD, chronic kidney disease; DM, diabetes mellitus; HIV, human immunodeficiency virus; HTN, hypertension; NCD, noncommunicable diseases; PY, person-years.
Table 2. Noncommunicable Disease Rates (per 100 person-years) Among Antiretroviral Therapy–Experienced, HIV-Infected Adults, 2000–2013
Treated Hypertension (n = 68 405) Type 2 Diabetes (n = 86 789) Chronic Kidney Disease (n = 52 411)
Variable Events PY IR (95% CI) Events PY IR (95% CI) Events PY IR (95% CI)
Age, y
<40 1388 109 425 1.3 (1.2–1.3) 806 130 208 0.6 (.6–.7) 167 92 767 0.2 (.2–.2)
40–49 3804 148 131 2.6 (2.5–2.7) 2232 190 276 1.2 (1.1–1.2) 605 122 913 0.5 (.5–.5)
50–59 3407 87 322 3.9 (3.8–4.0) 2190 124 127 1.8 (1.7–1.8) 694 68 786 1.0 (.9–1.1)
60–69 948 20 202 4.7 (4.4–5.0) 653 31 565 2.1 (1.9–2.2) 319 13 968 2.3 (2.0–2.5)
Sex
Male 8464 310 127 2.7 (2.7–2.8) 4842 399 860 1.2 (1.2–1.2) 1481 248 835 0.6 (.6–.6)
Female 1083 54 953 2.0 (1.9–2.1) 1039 76 315 1.4 (1.3–1.4) 304 49 599 0.6 (.6–.7)
Race
Non-black 4836 220 407 2.2 (2.1–2.3) 2893 283 628 1.0 (1.0–1.1) 884 169 906 0.5 (.5–.6)
Black 4711 144 672 3.3 (3.2–3.4) 2988 192 547 1.6 (1.5–1.6) 901 128 529 0.7 (.7–.8)
Injection drug use as HIV transmission risk
No 6829 287 518 2.4 (2.3–2.4) 4230 370 127 1.1 (1.1–1.2) 1191 230 247 0.5 (.5–.6)
Yes 2718 77 562 3.5 (3.4–3.6) 1651 106 048 1.6 (1.5–1.6) 594 68 187 0.9 (.9–.9)
Smoking
Never 729 41 021 1.8 (1.7–1.9) 297 57 707 0.7 (.6–.8) 146 35 927 0.4 (.4–.5)
Ever 2636 125 111 2.1 (2.0–2.2) 1565 179 512 0.9 (.8–.9) 646 119 984 0.5 (.5–.6)
Missing 6365 212 274 3.0 (2.9–3.1) 3919 238 956 1.6 (1.6–1.7) 993 142 524 0.7 (.7–.7)
BMI at entry, kg/m2
<18.5 913 60 520 1.5 (1.4–1.6) 429 82 159 0.5 (.5–.6) 28 3834 0.7 (.5–1.1)
18.5–24.9 685 34 790 2.0 (1.8–2.1) 408 51 176 0.8 (.7–.9) 284 55 107 0.5 (.5–.6)
25–29.9 334 11 874 2.8 (2.5–3.1) 353 19 503 1.8 (1.6–2.0) 150 33 341 0.5 (.4–.5)
30–40 58 1533 3.8 (2.9–4.9) 73 2673 2.7 (2.2–3.4) 55 13 568 0.4 (.3–.5)
>40 57 4314 1.3 (1.0–1.7) 35 5606 0.6 (.4–.9) 12 2338 0.5 (.3–.9)
Missing 7500 252 049 3.0 (2.9–3.0) 4583 315 057 1.5 (1.4–1.5) 1256 190 246 0.7 (.6–.7)
AIDS at entry
No 7811 298 095 2.6 (2.6–2.7) 4668 383 941 1.2 (1.2–1.3) 1341 240 786 0.6 (.5–.6)
Yes 1736 66 984 2.6 (2.5–2.7) 1213 92 234 1.3 (1.2–1.4) 444 57 648 0.8 (.7–.9)
Calendar year at ART initiation
2006–2013 1101 67 973 1.6 (1.5–1.7) 638 80 535 0.8 (.7–.9) 138 53 031 0.3 (.2–.3)
2000–2005 3669 141 696 2.6 (2.5–2.7) 2361 189 319 1.3 (1.2–1.3) 766 123 619 0.6 (.6–.7)
1996–1999 4651 146 738 3.2 (3.1–3.3) 2804 195 250 1.4 (1.4–1.5) 851 116 228 0.7 (.7–.8)
ART and HIV RNA, copies/mL
≤400, on ART 5493 183 209 3.0 (2.9–3.1) 3387 251 583 1.4 (1.3–1.4) 1034 162 144 0.6 (.6–.7)
>400, on ART 1487 46 523 3.2 (3.0–3.4) 925 61 277 1.5 (1.4–1.6) 320 39 789 0.8 (.7–.9)
Off ART 2447 131 500 1.9 (1.8–1.9) 467 34 259 1.4 (1.2–1.5) 152 21 030 0.7 (.6–.8)
Missing 120 3847 3.1 (2.6–3.7) 1102 129 056 0.9 (.8–.9) 279 75 472 0.3 (.3–.4)
Abbreviations: ART, antiretroviral therapy; BMI, body mass index; CI, confidence interval; HIV, human immunodeficiency virus; IR, incidence rates per 100 person-years; PY, person-years.
Table 3. Crude and Adjusted Incidence Rate Ratios for Noncommunicable Diseases Among Antiretroviral Therapy–Experienced, HIV-Infected Adults by Age, Sex, and Race, 2000–2013
Age Group, y
Univariate Analysis Multivariable Analysisa
IRR (95% CI) aIRR (95% CI)
Hypertension (n = 68 405) Non-black women
<40 1 Ref 1 Ref
40–49 1.7 (1.3–2.3) 1.6 (1.2–2.2)
50–59 2.8 (2.1–3.7) 2.5 (1.7–3.5)
60–69 2.9 (1.8–4.6) 2.2 (1.2–4.1)
Black women
<40 1 Ref 1 Ref
40–49 2.0 (1.7–2.3) 1.6 (1.3–1.9)
50–59 2.4 (1.9–2.9) 1.6 (1.2–2.2)
60–69 1.6 (1.0–2.7) 1.1 (.5–2.5)
Non-black men
<40 1 Ref 1 Ref
40–49 2.0 (1.9–2.2) 1.9 (1.7–2.2)
50–59 3.2 (2.9–3.5) 2.5 (2.2–2.9)
60–69 4.1 (3.7–4.6) 3.0 (2.4–3.8)
Black men
<40 1 Ref 1 Ref
40–49 2.0 (1.8–2.2) 1.8 (1.5–2.1)
50–59 2.9 (2.6–3.2) 2.4 (1.9–2.9)
60–69 3.6 (3.1–4.1) 2.4 (1.0–1.4)
Type 2 diabetes (n = 86 789) Non-black women
<40 1 Ref 1 Ref
40–49 1.8 (1.4–2.4) 1.4 (.9–2.1)
50–59 2.4 (1.8–3.3) 2.4 (1.5–3.7)
60–69 2.5 (1.6–4.0) 1.9 (1.0–3.9)
Black women
<40 1 Ref 1 Ref
40–49 1.7 (1.4–2.0) 1.5 (1.1–2.1)
50–59 2.1 (1.8–2.6) 1.6 (1.1–2.3)
60–69 2.7 (1.9–3.8) 2.8 (1.7–4.8)
Non-black men
<40 1 Ref 1 Ref
40–49 2.2 (1.9–2.5) 2.0 (1.6–2.5)
50–59 3.7 (3.2–4.2) 3.4 (2.7–4.3)
60–69 4.6 (3.9–5.3) 4.7 (3.5–6.2)
Black men
<40 1 Ref 1 Ref
40–49 1.9 (1.7–2.2) 1.3 (1.0–1.8)
50–59 2.7 (2.3–3.1) 1.8 (1.3–2.5)
60–69 3.1 (2.6–3.7) 2.8 (1.9–4.2)
Chronic kidney disease (n = 52 411) Non-black women
<40 1 Ref 1 Ref
40–49 3.2 (1.9–5.6) 2.7 (1.3–5.6)
50–59 4.5 (2.4–8.3) 3.9 (1.7–8.9)
60–69 14.3 (7.4–27.8) 16.7 (6.9–40)
Black women
<40 1 Ref 1 Ref
40–49 2.5 (1.7–3.6) 1.7 (1.0–2.8)
50–59 4.3 (2.9–6.4) 3.6 (2.1–6.2)
60–69 7.0 (3.9–12.5) 8.1 (3.9–16.6)
Age Group, y
Univariate Analysis Multivariable Analysisa
IRR (95% CI) aIRR (95% CI)
Non-black men
<40 1 Ref 1 Ref
40–49 4.1 (3.0–5.5) 3.7 (2.4–5.5)
50–59 8.4 (6.2–11.4) 7.3 (4.8–11.1)
60–69 22.1 (16.1–30.4) 16.8 (10.4–26.9)
Black men
<40 1 Ref 1 Ref
40–49 2.0 (1.5–2.7) 1.6 (1.0–2.6)
50–59 4.5 (3.4–5.9) 4.0 (2.5–6.6)
60–69 8.8 (6.4–12.0) 9.6 (5.2–17.5)
Confidence intervals that do not overlap 1 are shown in bold.
Abbreviations: aIRR, adjusted incidence rate ratio; CI, confidence interval; IRR, incidence rate ratio; Ref = reference.
a Adjusted Poisson analyses controlled for injection drug use, history of smoking, calendar year at antiretroviral therapy (ART) initiation, cohort, AIDS at entry, time-updated CD4 count, and the combined variable for ART and viremia status (where viral suppression ≤400 copies/mL).
Table 3. Continued
of incidence estimates. We focused on treated HTN and did not include fasting glucose measures in our DM definition. Additionally, high eGFRs at study entry restricted the rate of decline.
Given our broad study period, temporal changes in the effec-tiveness, tolerability profiles, and convenience of ART regimens may play an important role in our observed outcome rates. In our population, a high proportion of individuals was prescribed ART but not virally suppressed at study entry. However, this was a function of our study entry definition, which allowed the inclusion of a heterogeneous population of individuals: (1) those initiating ART and who thus have unsuppressed viral load at initiation, and (2) those who may have been exposed to ear-lier ART formulations. Earear-lier ART regimens may predispose individuals to NCD development compared with contemporary regimens [11], underscoring the continued importance of mon-itoring HTN, DM, and CKD [28]. For this reason, in our study it is possible that rates of NCD occurrence were higher in ear-lier years, but declined following the introduction and uptake of newer ARTs. Potential differences in ART availability by calen-dar period, and therefore differences in risk of NCD occurrence due to type of ART exposure, were adjusted for in our analyses by controlling for era of ART initiation.
that disease preventive services are less common among dis-advantaged communities [32], suggest a need for primary and secondary disease prevention strategies directed at minorities.
Consistent with accumulating evidence identifying women at greater risk for several adverse health outcomes compared with men [7], women in our study experienced higher rates of DM and CKD. In the setting of HIV infection, reasons for sex disparities are likely multifactorial, and may include biological differences [33] and differences in care retention [34]. In light of this, women aging with HIV may require approaches to care that are distinct from those routinely used for men in terms of devising effective prevention and treatment plans for NCDs.
The foreseeable growth of NCDs among HIV-infected indi-viduals will have implications for clinical care and healthcare resources [20]. As HIV-infected individuals age, an increas-ing number of treatable NCDs may give rise to issues related to polypharmacy, with management of both ARTs and treat-ment of NCDs [35]. To date, there is a dearth of guidelines on how best to clinically manage older individuals with multiple diseases [36], and it is unclear whether undertaking earlier or intensified screening for specific age-related diseases is justi-fiable [37]. Appropriate healthcare delivery models that are diverse in medical expertise will be fundamental to the care of HIV-infected persons.
the disparities shown, the objective was not to examine the HIV effect, but rather to describe the epidemiology of NCDs among individuals with access to HIV clinical care.
In summary, we found increased rates of HTN, DM, and CKD, especially among HIV-infected black men and women. Minimizing sex–race health disparities through more proactive preventive care, such as smoking cessation, physical activity, and nutritional assistance programs, will shape the quality of extended life made possible by effective ART in this population engaged in medical care. Understanding North American rates of NCDs in HIV-infected persons, and sex–race disparities in NCD occurrence, is a necessary step for responding to the U.S. National HIV/AIDS Strategy’s call to improve long-term health outcomes among HIV-infected individuals and to prepare for the clinical and public health challenges that may lie ahead [38].
Supplementary Material
Supplementary materials are available at Clinical Infectious Diseases online. Consisting of data provided by the author to benefit the reader, the posted materials are not copyedited and are the sole responsibility of the author, so questions or com-ments should be addressed to the author.
Notes
Disclaimer. The findings and conclusions in this report are those of the
authors and do not necessarily represent the views of the US Centers for Disease Control and Prevention or the National Institutes of Health.
Financial support. This work was supported by the National Institutes
of Health (grant numbers U01AI069918, F31DA037788, G12MD007583, K01AI093197, K23EY013707, K24AI065298, K24AI118591, K24DA000432, KL2TR000421, M01RR000052, N01CP01004, N02CP055504, N02CP91027, P30AI027757, P30AI027763, P30AI027767, P30AI036219, P30AI050410, P30AI094189, P30AI110527, P30MH62246, R01AA016893, R01CA165937, R01DA011602, R01DA012568, R24AI067039, U01AA013566, U01AA020790, U01AI031834, U01AI034989, U01AI034993, U01AI034994, U01AI035004, U01AI035039, U01AI035040, U01AI035041, U01AI035042, U01AI037613, U01AI037984, U01AI038855, U01AI038858, U01AI042590, U01AI068634, U01AI068636, U01AI069432, U01AI069434, U01AI103390, U01AI103397, U01AI103401, U01AI103408, U01DA03629, U01DA036935, U01HD032632, U10EY008057, U10EY008052, U10EY008067,
U24AA020794,U54MD007587, UL1RR024131, UL1TR000004,
UL1TR000083, UL1TR000454, UM1AI035043, T32-AG000247,
Z01CP010214, Z01CP010176, and pilot grant R24AG044325); the Centers for Disease Control and Prevention (contract numbers CDC-200-2006-18797 and CDC-200-2015-63931); the Agency for Healthcare Research and Quality (contract number 90047713); the Health Resources and Services Administration (contract number 90051652); the Canadian Institutes of Health Research (grant numbers CBR-86906, CBR-94036, HCP-97105, and TGF-96118); the Ontario Ministry of Health and Long Term Care; the Government of Alberta, Canada; the National Cancer Institute; the National Institute of Mental Health; and the National Institute on Drug Abuse.
Potential conflicts of interest. J. T. has served on the scientific board with AbbVie and as a consultant for Gilead Sciences and NightstaRx, and has grants pending from National Eye Institute and Allergan, Inc. F. J. P. has received honoraria for advice or public speaking with Gilead Sciences Inc, Janssen Pharmaceuticals, Merck and Co, and Bristol-Myers Squibb. A. G. A. has received/pending grants from the National Institute on Aging, National Institutes of Health (NIH), has served as a consultant for Mount Sinai, lec-tured with the Johns Hopkins University Summer Institute, and has served on the advisory board for the National Institute of Diabetes and Digestive and
Kidney Diseases Observational Study Monitoring Board. K. N. A. has served on the medical advisory board for Gilead Sciences Inc. J. M. G. has served on national HIV advisory boards to Merck, Gilead, and ViiV Healthcare. M. J. S. has received research grants from Merck and Pfizer. H. C. has grants received/ pending from the Patient-Centered Outcomes Research Institute, NIH. P. F. R. has grants received/pending from the National Institute of Allergy and Infectious Diseases, NIH. R. D. M., R. B., C. W., S. N., S. J. G, A. J., J. K., M. A. H. have grants received/pending from the NIH. All other authors report no potential conflicts. All authors have submitted the ICMJE Form for Disclosure of Potential Conflicts of Interest. Conflicts that the editors consider relevant to the content of the manuscript have been disclosed.
References
1. Samji H, Cescon A, Hogg RS, et al; North American AIDS Cohort Collaboration on Research and Design (NA-ACCORD) of IeDEA. Closing the gap: increases in life expectancy among treated HIV-positive individuals in the United States and Canada. PLoS One 2013; 8:e81355.
2. Centers for Disease Control and Prevention. HIV surveillance report. Diagnoses of HIV infection in the United States and dependent areas, 2013. Atlanta, GA: CDC, 2015; 25.
3. High KP, Brennan-Ing M, Clifford DB, et al; OAR Working Group on HIV and Aging. HIV and aging: state of knowledge and areas of critical need for research. A report to the NIH office of AIDS research by the HIV and aging working group. J Acquir Immune Defic Syndr 2012; 60:S1–18.
4. Smith CJ, Ryom L, Weber R, et al; D:A:D Study Group. Trends in underlying causes of death in people with HIV from 1999 to 2011 (D:A:D): a multicohort collaboration. Lancet 2014; 384:241–8.
5. Triant VA, Lee H, Hadigan C, Grinspoon SK. Increased acute myocardial infarc-tion rates and cardiovascular risk factors among patients with human immuno-deficiency virus disease. J Clin Endocrinol Metab 2007; 92:2506–12.
6. Choi AI, Li Y, Parikh C, Volberding PA, Shlipak MG. Long-term clinical consequences of acute kidney injury in the HIV-infected. Kidney Int 2010; 78:478–85.
7. Buchacz K, Baker RK, Palella FJ Jr, et al; HIV Outpatient Study Investigators. Disparities in prevalence of key chronic diseases by gender and race/ethnicity among antiretroviral-treated HIV-infected adults in the US. Antivir Ther 2013; 18:65–75. 8. Gange SJ, Kitahata MM, Saag MS, et al. Cohort profile: the North American AIDS
Cohort Collaboration on Research and Design (NA-ACCORD). Int J Epidemiol 2007; 36:294–301.
9. Levey AS, Stevens LA, Schmid CH, et al; CKD-EPI (Chronic Kidney Disease Epidemiology Collaboration). A new equation to estimate glomerular filtration rate. Ann Intern Med 2009; 150:604–12.
10. Hanna DB, Buchacz K, Gebo KA, et al; North American AIDS Cohort Collaboration on Research and Design (NA-ACCORD) of the International Epidemiologic Databases to Evaluate AIDS. Trends and disparities in antiretroviral therapy initia-tion and virologic suppression among newly treatment-eligible HIV-infected indi-viduals in North America, 2001–2009. Clin Infect Dis 2013; 56:1174–82. 11. Panel on Antiretroviral Guidelines for Adults and Adolescents. Guidelines for the
use of antiretroviral agents in HIV-1-infected adults and adolescents. Available at:
http://www.aidsinfo.nih.gov/ContentFiles/AdultandAdolescentGL.pdf. Accessed 22 June 2015.
12. Centers for Disease Control and Prevention. 1993 revised classification system for HIV infection and expanded surveillance case definition for AIDS among adoles-cents and adults. MMWR Recomm Rep 1992; 41:1–19.
13. Fine JP, Gray RJ. A proportional hazards model for the subdistribution of a com-peting risk. J Am Stat Assoc 1999; 94:496–509.
14. Lamarca R, Alonso J, Gómez G, Muñoz A. Left-truncated data with age as time scale: an alternative for survival analysis in the elderly population. J Gerontol A Biol Sci Med Sci 1998; 53:M337–43.
15. Thiébaut R, El-Sadr WM, Friis-Møller N, et al; Data Collection of Adverse Events of Anti-HIV Drugs Study Group. Predictors of hypertension and changes of blood pressure in HIV-infected patients. Antivir Ther 2005; 10:811–23. 16. Factor SH, Lo Y, Schoenbaum E, Klein RS. Incident hypertension in older women
and men with or at risk for HIV infection. HIV Med 2013; 14:337–46. 17. Brown TT, Cole SR, Li X, et al. Antiretroviral therapy and the prevalence and
incidence of diabetes mellitus in the Multicenter AIDS Cohort Study. Arch Intern Med 2005; 165:1179–84.
18. Lucas GM, Lau B, Atta MG, Fine DM, Keruly J, Moore RD. Chronic kidney dis-ease incidence, and progression to end-stage renal disdis-ease, in HIV-infected indi-viduals: a tale of two races. J Infect Dis 2008; 197:1548–57.
20. Smit M, Brinkman K, Geerlings S, et al; ATHENA observational cohort. Future challenges for clinical care of an ageing population infected with HIV: a modelling study. Lancet Infect Dis 2015; 15:810–8.
21. Hasse B, Ledergerber B, Furrer H, et al; Swiss HIV Cohort Study. Morbidity and aging in HIV-infected persons: the Swiss HIV cohort study. Clin Infect Dis 2011; 53:1130–9.
22. US Department of Health and Human Services and Office of Disease Prevention and Promotion. Healthy People 2020. Available at: https://www.healthypeople. gov/2020/topics-objectives. Accessed 24 April 2016.
23. Vargas CM, Ingram DD, Gillum RF. Incidence of hypertension and educational attainment: the NHANES I epidemiologic followup study. First National Health and Nutrition Examination Survey. Am J Epidemiol 2000; 152:272–8.
24. Carson AP, Howard G, Burke GL, Shea S, Levitan EB, Muntner P. Ethnic differ-ences in hypertension incidence among middle-aged and older adults: the mul-ti-ethnic study of atherosclerosis. Hypertension 2011; 57:1101–7.
25. Bash LD, Coresh J, Köttgen A, et al. Defining incident chronic kidney disease in the research setting: the ARIC study. Am J Epidemiol 2009; 170:414–24. 26. Centers for Disease Control and Prevention. Diagnosed diabetes, age adjusted
rate (per 100), adults—2013. Available at: http://gis.cdc.gov/grasp/diabetes/ DiabetesAtlas.html. Accessed 5 October 2015.
27. Chronic Kidney Disease (CKD) Surveillance Project. Incidence of individual CKD stages/eGFR categories by stage, 2012. Available at: https://nccd.cdc.gov/ ckd/detail.aspx?Qnum=Q89. Accessed 2 December 2015.
28. Okeke NL, Davy T, Eron JJ, Napravnik S. Hypertension among HIV-infected patients in clinical care, 1996–2013. Clin Infect Dis 2016; 63:242–8.
29. De Wit S, Sabin CA, Weber R, et al; Data Collection on Adverse Events of Anti-HIV Drugs (D:A:D) study. Incidence and risk factors for new-onset diabetes in HIV-infected patients: the data collection on adverse events of anti-HIV drugs (D:A:D) study. Diabetes Care 2008; 31:1224–9.
30. Centers for Disease Control and Prevention. Estimated HIV incidence among adults and adolescents in the United States, 2007–2010. HIV surveillance supple-mental report. Atlanta, GA: CDC, 2012; 17.
31. Greene M, Justice AC, Lampiris HW, Valcour V. Management of human immuno-deficiency virus infection in advanced age. JAMA 2013; 309:1397–405. 32. Agency for Healthcare Research and Quality. 2014 national healthcare quality and
disparities report: key findings. Available at: http://www.ahrq.gov/research/find-ings/nhqrdr/nhqdr14/key1.html. Accessed 5 February 2016.
33. Womack JA, Brandt CA, Justice AC. Primary care of women aging with HIV. J Midwifery Womens Health 2015; 60:146–57.
34. Rebeiro P, Althoff KN, Buchacz K, et al. Retention among North American HIV-infected persons in clinical care, 2000–2008. J Acquir Immune Defic Syndr 2013; 62:356–62.
35. Krentz HB, Gill MJ. The impact of non-antiretroviral polypharmacy on the con-tinuity of antiretroviral therapy (ART) among HIV patients. AIDS Patient Care STDS 2016; 30:11–7.
36. Boyd C, Fortin M. Future of multimorbidity research: how should understand-ing of multimorbidity inform health system design? Public Health Rev 2011; 32:451–74.
37. Aberg JA, Gallant JE, Ghanem KG, Emmanuel P, Zingman BS, Horberg MA; Infectious Diseases Society of America. Primary care guidelines for the man-agement of persons infected with HIV: 2013 update by the HIV Medicine Association of the Infectious Diseases Society of America. Clin Infect Dis 2014; 58:e1–34.
38. White House Office of National AIDS Policy. National HIV/AIDS Strategy for the United States updated to 2020. Washington, DC: White House Office of National AIDS Policy, 2015.
39. Koethe JR, Jenkins CA, Lau B, et al; North American AIDS Cohort Collaboration on Research and Design (NA-ACCORD). Rising obesity prevalence and weight gain among adults starting antiretroviral therapy in the United States and Canada. AIDS Res Hum Retroviruses 2016; 32:50–8.
APPENDIX
NA-ACCORD Collaborating Cohorts and Representatives: AIDS Clinical Trials Group Longitudinal Linked Randomized Trials: Constance A. Benson and Ronald J. Bosch; AIDS Link
to the IntraVenous Experience: Gregory D. Kirk; Fenway Health HIV Cohort: Stephen Boswell, Kenneth H. Mayer, and Chris Grasso; HAART Observational Medical Evaluation and Research: Robert S. Hogg, P. Richard Harrigan, Julio S. G. Montaner, Angela Cescon, and Karyn Gabler; HIV Outpatient Study: Kate Buchacz and John T. Brooks; HIV Research Network: Kelly A. Gebo and Richard D. Moore; Johns Hopkins HIV Clinical Cohort: Richard D. Moore; John T. Carey Special Immunology Unit Patient Care and Research Database, Case Western Reserve University: Benigno Rodriguez; Kaiser Permanente Mid-Atlantic States: Michael A. Horberg; Kaiser Permanente Northern California: Michael J. Silverberg; Longitudinal Study of Ocular Complications of AIDS: Jennifer E. Thorne; Multicenter Hemophilia Cohort Study–II: Charles Rabkin; Multicenter AIDS Cohort Study: Lisa P. Jacobson and Gypsyamber D’Souza; Montreal Chest Institute Immunodeficiency Service Cohort: Marina B. Klein; Ontario HIV Treatment Network Cohort Study: Sean B. Rourke, Anita R. Rachlis, Jason Globerman, and Madison Kopansky-Giles; Retrovirus Research Center, Bayamon Puerto Rico: Robert F. Hunter-Mellado and Angel M. Mayor; Southern Alberta Clinic Cohort: M. John Gill; Study of the Consequences of the Protease Inhibitor Era: Steven G. Deeks and Jeffrey N. Martin; Study to Understand the Natural History of HIV/ AIDS in the Era of Effective Therapy: Pragna Patel and John T. Brooks; University of Alabama at Birmingham 1917 Clinic Cohort: Michael S. Saag, Michael J. Mugavero, and James Willig; University of North Carolina at Chapel Hill HIV Clinic Cohort: Joseph J. Eron and Sonia Napravnik; University of Washington HIV Cohort: Mari M. Kitahata, Heidi M. Crane, and Daniel R. Drozd; Vanderbilt Comprehensive Care Clinic HIV Cohort: Timothy R. Sterling, David Haas, Peter Rebeiro, Megan Turner, Sally Bebawy, and Ben Rogers; Veterans Aging Cohort Study: Amy C. Justice, Robert Dubrow, and David Fiellin; Women’s Interagency HIV Study: Stephen J. Gange and Kathryn Anastos.