EXPRESSION AND LOCALIZATION DYNAMICS OF THE AGING BIOMARKER P16INK4A IN RESPONSE TO CELLULAR STRESS, AUTOPHAGY, AND
EPIGENETIC MODULATORS
Philip Richard Coryell
A dissertation submitted to the faculty at the University of North Carolina at Chapel Hill in partial fulfillment of the requirements for the degree of Genetics and Molecular Biology in the Department of Biology in the School of Medicine.
Chapel Hill 2019
Approved by:
Jeremy Purvis Scott Bultman Yue Xiong
ii
© 2019
iii
ABSTRACT
Philip Coryell: Expression and localization dynamics of the aging biomarker p16INK4a in response to cellular stress, autophagy, and epigenetic modulators
(Under the direction of Jeremy Purvis)
The tumor suppressor protein p16INK4a (p16) is a well-established hallmark
iv
v
vi
ACKNOWLEDGEMENTS
vii
TABLE OF CONTENTS
LIST OF TABLES ... ix
LIST OF FIGURES ... x
LIST OF ABBREVIATIONS ... xi
CHAPTER 1: INTRODUCTION ... 1
p16INK4a is important for both aging and cancer ... 1
Epigenetic studies of p16 regulation are important and incomplete ... 2
p16 degradation and intracellular localization is not well described ... 3
Autophagy and p16 are linked by a shared association with cellular senescence and aging ... 4
Human retinal pigment epithelial cells as a model for studying p16 ... 5
Summary of findings ... 5
CHAPTER 2: DEVELOPMENT OF A P16INK4A REPORTER CELL LINE TO STUDY EXPRESSION AND LOCALIZATION DYNAMICS USING QUANTITATIVE FLUORESCENCE MICROSCOPY ... 8
Introduction ... 8
Creating a live-cell fluorescent p16 reporter using CRISPR ... 9
Dynamics of p16in response to autophagy and cellular stress ... 10
viii
Introduction ... 15
Immunofluorescence protocol for in situ visualization of proteins within endomembrane vesicles ... 16
Autophagy stimulates p16 recruitment to lysosomes where it is degraded... 17
Disrupting autophagosome-lysosome fusion causes p16 aggregation within autophagosomes ... 19
Autophagosome chaperone p62/SQSTM1 mediates p16 recruitment to lysosomes ... 21
CHAPTER 4: HIGH-CONTENT EPIGENETIC DRUG SCREEN FOR REGULATORS OF P16INK4A ... 32
Introduction ... 32
CpG island methylation ... 32
Polycomb repression complexes ... 33
Epigenetic drug screens can find novel targets for disease therapies ... 33
Epigenetic drug screening using RPE p16-mCherry cells ... 34
CHAPTER 5: CONCLUSIONS AND FUTURE DIRECTIONS ... 43
Conclusions and future directions for studying the effects of autophagy on p16 expression and localization ... 43
Conclusions and future directions for epigenetic screening for regulators of p16 ... 46
ix
LIST OF TABLES
Table
x
LIST OF FIGURES
Figure 1. Annotated p16-mCherry donor repair template plasmid ... 12 Figure 2. Development of a human RPE p16-mCherry reporter cell line ... 13 Figure 3. Dynamics of p16 localization in response to autophagy stimulation .... 14 Figure 4. Autophagy pathway model depicting molecular markers and inhibitors ... 24 Figure 5. Blocking autophagy using chemical inhibitors ... 25 Figure 6. Autophagy recruits p16 to lysosomes ... 26 Figure 7. Blocking autophagy results in p16 accumulation within
xi
LIST OF ABBREVIATIONS
5mC 5-methylcytosine
A Adenine
ACT Actin
ANOVA Analysis of variance
ANRIL Antisense non-coding RNA in the INK4 locus
ARF Alternate reading frame BAF Bafilomycin A1
BET Bromodomain and extra-terminal motif
BMI-1 B lymphoma Mo-MLV insertion region 1 homolog
bp Base pair
C Cytosine
Cas9 CRISPR associated protein 9
CDK Cyclin-dependent kinase
CDKN2A Cyclin-dependent kinase inhibitor 2A CHQ Chloroquine
xii
DAPI 4′,6-diamidino-2-phenylindole DMSO Dimethyl sulfoxide
DNA Deoxyribonucleic acid
EZH2 Enhancer of zeste 2 polycomb repressive complex 2 subunit FBS Fetal bovine serum
G Guanine
Gly Glycine
H2O2 Hydrogen peroxide
HAT Histone acetyltransferase HDAC Histone deacetylase
HMT Histone methyltransferase
INK4 Inhibitor of cyclin-dependent kinase 4
kD Kilodalton
LAMP1 Lysosomal-associated membrane protein 1 LC3 Microtubule-associated protein light chain 3
LEU Leupeptin
MLL Mixed lineage leukemia
xiii
mTOR Mammalian target of rapamycin NES Nuclear export signal
NH Ammonium chloride
NH4Cl Ammonium chloride NLS Nuclear localization signal
nM Nanomolar
PAM Protospacer adjacent motif
PBS Phosphate-buffered saline PCR Polymerase chain reaction PFA Paraformaldehyde
PRC1 Polycomb repressive complex 1 PRC2 Polycomb repressive complex 2
RNA Ribonucleic acid RPS9 Ribosomal Protein S9
RT-qPCR Quantitative reverse transcription PCR
Sc Scramble
Ser Serine
xiv
SQSTM1 Sequestosome 1
T Thymine
μm Micrometer
μM Micromolar
1
CHAPTER 1: INTRODUCTION
p16INK4a is important for both aging and cancer
The tumor suppressor protein p16INK4a (CDKN2A, p16) is a member of the
2
p16 should be of great interest to investigators developing anti-aging and rejuvenation therapies.
In addition to aging, p16 (or more accurately, the silencing of p16 expression) has been suggested as a cancer biomarker, given that its negative expression is correlated with both tumorigenesis and tumor progression (Rocco & Sidransky, 2001; Ruas & Peters, 1998; Sherr & McCormick, 2002). Mutations in p16 are associated with increased risk for a wide variety of cancers including esophageal, gastric, pancreatic, and skin cancer. In fact, loss of p16 has been recognized as one of the most common defects in all of human cancer, second only to p53 (Serra & Chetty, 2018). Despite this, repression of p16 has also been reported in cancer cell lines that contain a genetically normal p16 locus (Gonzalez-Zulueta et al., 1995). For this reason, studying p16 regulation at both the genetic and epigenetic levels is of great interest to researchers in the cancer field.
Epigenetic studies of p16 regulation are important and incomplete
3
p16 degradation and intracellular localization is not well described
4
Autophagy and p16 are linked by a shared association with cellular senescence and aging
One potential mechanism for regulation of p16 localization is vesicular trafficking via the lysosomal endomembrane system. Lysosomes are cytoplasmic organelles involved in autophagy-mediated protein degradation. Like p16, lysosomes are involved in senescence-associated signaling pathways, and lysosome dysfunction has been linked to a myriad of age-related pathologies and a decrease in lifespan (Carmona-Gutierrez, Hughes, Madeo, & Ruckenstuhl, 2016; Lee et al., 2006; Platt, Boland, & van der Spoel, 2012). Similarly, lysosomes have also been targeted for lifespan extension therapies, such as intervention with rapamycin (Carmona-Gutierrez et al., 2016). Recent studies have expanded beyond protein degradation and explored the role of lysosomes in subcellular localization of stress-response proteins and the regulation of cell fate. For example, the mechanistic target of rapamycin (mTOR) was found to not only be recruited and degraded by lysosomes, but also play an important role in lysosome formation and regulation of the entire autophagy pathway (Y. Hu et al., 2016).
5
exploring the links between autophagy, senescence, and p16 remain incomplete and further investigation could reveal potential novel pathways governing cellular senescence, aging, and cancer.
Human retinal pigment epithelial cells as a model for studying p16
Retinal pigment epithelial (RPE) cells are responsible for absorbing light, transporting nutrients to photoreceptors, and providing the tight junctions that compose the blood-retinal barrier of the eye (Strauss, 2005). Senescence and autophagy dysfunction in RPE cells are linked to a myriad of diseases related to the eye, including age-related macular degeneration (Blasiak et al., 2017; Golestaneh, Chu, Xiao, Stoleru, & Theos, 2017). Cultured RPE cells have been used as human cell models for studies on cellular stress, including oxidative stress, as well as drug development and epigenetic research (Culver-Cochran & Chadwick, 2012; Fragoso et al., 2012). Accordingly, we chose an RPE cell line (RPE-1) as our human model for studying p16 expression and localization in response to autophagy, cellular stress, and drug-targeted inhibition of epigenetic factors.
Summary of findings
6
To investigate p16 and autophagy, we subjected human RPE-1 cells to three cellular stresses that have previously been shown to induce both autophagy and cell-cycle arrest: nutrient deprivation via serum starvation, oxidative stress via hydrogen peroxide, and genotoxic stress via the chemotherapeutic drug etoposide (Katayama, Kawaguchi, Berger, & Pieper, 2007). By engineering a live-cell reporter for p16, we found that activation of autophagy caused p16 to accumulate in acidic cytoplasmic vesicles within 24 hours. RPE-1 cells treated with lysosomal protease inhibitors leupeptin and NH4Cl displayed strong co-localization between p16 and lysosomes and increased total p16 levels. Furthermore, blocking autophagosome-to-lysosome fusion led to increased levels of p16 within LC3-positive vesicles. Knockdown of autophagosome chaperone protein p62 diminished the ability of p16 to aggregate and colocalize with lysosomes. Taken together, these results show that p16 is localized and degraded through the autophagy/lysosomal pathway, implicating the autophagy pathway as a regulator of p16 and senescence.
Along with the localization and expression of p16 in response to cellular stress and autophagy, we also performed a high-content epigenetic screen for modulators of p16 expression. The screen revealed HDAC inhibitors to be potent repressors of p16 transcription. Targeting members of the polycomb repressor complex, BET family, and Menin-MLL resulted in p16 upregulation.
7
8
CHAPTER 2: DEVELOPMENT OF A P16INK4A REPORTER CELL LINE TO STUDY EXPRESSION AND LOCALIZATION DYNAMICS USING
QUANTITATIVE FLUORESCENCE MICROSCOPY
Introduction
Proteins should not be viewed as rigid structures sequestered to specific locations within the cell, but rather as dynamic entities that are assembled, translocated to different subcellular compartments, and degraded at different rates. Different proteins have different turnover rates, and these rates can change drastically in response to external perturbations. In fact, recent research has demonstrated that protein dynamics, rather than bulk accumulated protein levels, can be a better determinant of cell fate decisions, such as proliferation or senescence (Purvis et al., 2012; Purvis & Lahav, 2013). Accordingly, researchers seeking a holistic understanding of their protein of interest must employ new methods and technology to study protein expression and localization over time.
9
Chen, August, & Willingham, 1985). As an alternative approach, fluorescently tagged protein reporters have been employed to accurately visualize and track temporal changes of members of the autophagy pathway and proteins destined to this pathway for degradation (Loos et al., 2014; Yoshii & Mizushima, 2017).
Creating a live-cell fluorescent p16 reporter using CRISPR
10
validated to accurately measure p16 expression and localization for quantitative live-cell fluorescence experiments (Figure 2A-G).
Dynamics of p16in response to autophagy and cellular stress
11
12 Left homology arm
gagaagctaaagagtggtcggagaatctaatgcaagctacgggagaaagaaactcaagtgcaaatgctgcc tcaggaataaacgtaaaaagagactttcaagtgcaaatgctccctcaggaataaaataatcttgagactct caagtgtaaatgctgcctcgggagaaccgaacggcgagctggagcccatacgcaacgagattagagaggaa ggcagaagccagagcacatgaataaatgagcatccattttgtttcagaaatgatcggaaaccatttgtggg tttgtagaagcaggcatgcgtagggaagctacgggattccgccgaggagcgccagagcctgaggcgccctt tggttatcgcaagctggctggctcactccgcaccaggtgcaaaagatgcctggggatgcgggaagggaaag gccacatcttcacgccttcgcgcctggcattgtgagcaaccactgagactcattatataacactcgttttc ttcttgcaaccctgcgggccgcgcggtcgcgctttctctgccctccgccgggtggacctggagcgcttgag cggtcggcgcgcctggagcagccaggcgggcagtggactagctgctggaccagggaggtgtgggagagcgg tggcggcgggtacatgcacgtgaagccattgcgagaactttatccataagtatttcaatgccggtagggac ggcaagagaggagggcgggatgtgccacacatctttgacctcaggtttctaacgcctgttttctttctgcc ctctgcagACATCCCCGAT (GGGGGSGGGGGS linker)
GGC GGA GGG GGC GGA AGC GGC GGA GGG GGC GGA AGC
mCherry with Stop Codon
ATGGTGAGCAAGGGCGAGGAGGATAACATGGCCATCATCAAGGAGTTCATGCGCTTCAAGGTGCACATGGA GGGCTCCGTGAACGGCCACGAGTTCGAGATCGAGGGCGAGGGCGAGGGCCGCCCCTACGAGGGCACCCAGA CCGCCAAGCTGAAGGTGACCAAGGGTGGCCCCCTGCCCTTCGCCTGGGACATCCTGTCCCCTCAGTTCATG TACGGCTCCAAGGCCTACGTGAAGCACCCCGCCGACATCCCCGACTACTTGAAGCTGTCCTTCCCCGAGGG CTTCAAGTGGGAGCGCGTGATGAACTTCGAGGACGGCGGCGTGGTGACCGTGACCCAGGACTCCTCCCTGC AGGACGGCGAGTTCATCTACAAGGTGAAGCTGCGCGGCACCAACTTCCCCTCCGACGGCCCCGTAATGCAG AAGAAGACCATGGGCTGGGAGGCCTCCTCCGAGCGGATGTACCCCGAGGACGGCGCCCTGAAGGGCGAGAT CAAGCAGAGGCTGAAGCTGAAGGACGGCGGCCACTACGACGCTGAGGTCAAGACCACCTACAAGGCCAAGA AGCCCGTGCAGCTGCCCGGCGCCTACAACGTCAACATCAAGTTGGACATCACCTCCCACAACGAGGACTAC ACCATCGTGGAACAGTACGAACGCGCCGAGGGCCGCCACTCCACCGGCGGCATGGACGAGCTGTACAAGTG A
Right homology arm
AAGAACCAGAGAGGCTCTGAGAAACCTCCGTAAACTTAGATCATCAGTCACCGAAGGTCCTACAGGGCCAC AACTGCCCCCGCCACAACCCACCCCGCTTTCGTAGTTTTCATTTAGAAAATAGAGCTTTTAAAAATGTCCT GCCTTTTAACGTAGATATATGCCTTCCCCCACTACCGTAAATGTCCATTTATATCATTTTTTATATATTCT TATAAAAATGTAAAAAAGAAAAACACCGCTTCTGCCTTTTCACTGTGTTGGAGTTTTCTGGAGTGAGCACT CACGCCCTAAGCGCACATTCATGTGGGCATTTCTTGCGAGCCTCGCAGCCTCCGGAAGCTGTCGACTTCAT GACAAGCATTTTGTGAACTAGGGAAGCTCAGGGGGGTTACTGGCTTCTCTTGAGTCACACTGCTAGCAAAT GGCAGAACCAAAGCTCAAATAAAAATAAAATAATTTTCATTCATTCACTCATTTATTGTCAACATTTATTG AGCACCTATTACAACAATTTCATCGCATGGAAGACAGCATCGTTTCTGACACTGTTGTTTCATGTATCTCT TAGAAAAACGCTGCTATTAGACATCTAACACTATTTATCTTGAGGTGATAAAATATCAAAAGCCGTGTCTC AAGATCGATGAAATGCGGTTAAAATGATGAATAGAAACTCTAGGGGGACCTCATATCGATAGACTCGAGAC TGGCACATCTGGAGATCCGTATTTATCCGGCTTCCCCTTCCAGATCACGCGAGGTTTGGGATATTTTGCTC ACCAGGCCTCAGCCAGGTA
13
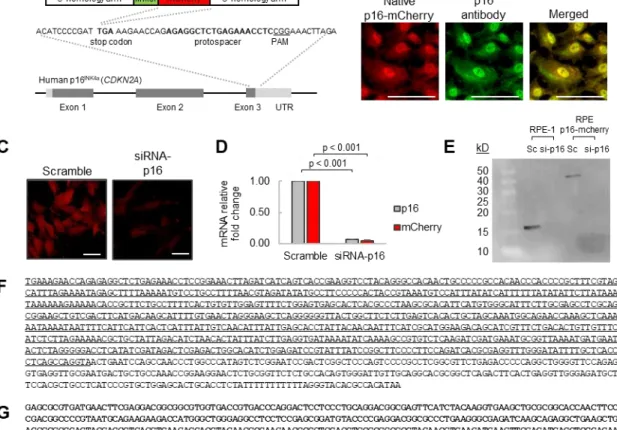
Figure 2. Development of a human RPE p16-mCherry reporter cell line.
A) Schematic for CRISPR-mediated incorporation of a (Gly/Ser)12 linker and mCherry fluorescent protein at the p16/CDKN2A stop codon of RPE-1 cells. B) Immunofluorescence staining of fixed RPE p16-mCherry cells. Native p16-mCherry in red. p16-antibody in green. Scale bars = 100 μm. C) Live RPE p16-mCherry cells transfected with siRNA-p16 or scramble control for 24 hours. Scale
bars = 100 μm. D) RT-qPCR of siRNA-transfected cells with primers for p16 or mCherry.
14
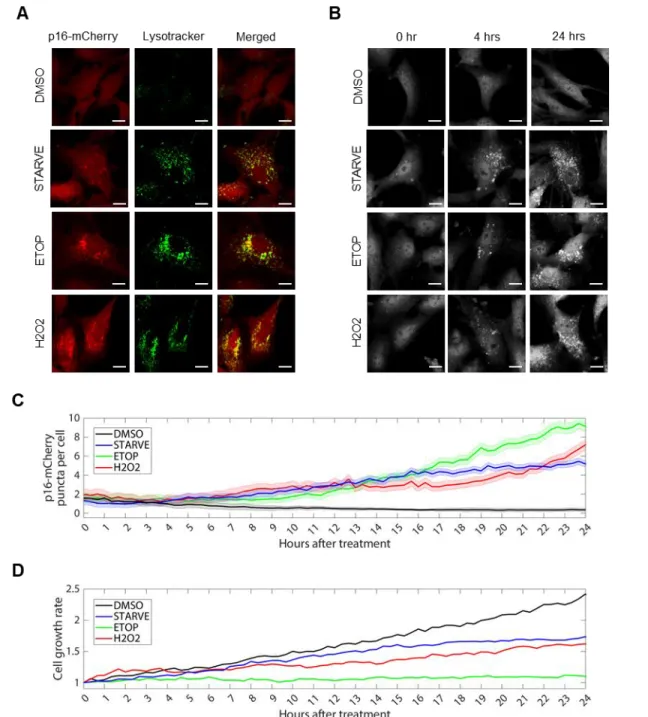
Figure 3. Dynamics of p16 localization in response to autophagy stimulation.
RPE p16-mCherry cells were treated with DMSO, etoposide (20 μM), H2O2 (200 μM), or serum
starved for 24 hours. A) Fluorescent p16-mCherry shown in red; Lysotracker staining of acidic
organelles shown in green. Scale bars = 10 μm. B) Time-lapse images of p16-mCherry cells after
treatments. C) Quantification of time-lapse images showing total mean per frame of mean
15
CHAPTER 3: EFFECTS OF CELLULAR STRESS, AUTOPHAGY, AND AUTOPHAGY DYSFUNCTION ON P16INK4A LOCALIZATION AND
DEGRADATION
Introduction
Here, we asked how disruption of autophagy affects the expression and subcellular localization dynamics of p16. The autophagy-mediated protein degradation pathway involves the acidification of lysosomes in order to activate low-pH dependent proteases within the lysosomal lumen. Live-cell experiments using a mCherry reporter cell line revealed co-localization between p16-mCherry and acidic organelles, which may be lysosomes. In order to confirm this finding in a non-reporter cell line, we tested if blocking lysosomal degradation in unmodified RPE-1 cells while stimulating autophagy resulted in the accumulation of p16 within lysosomes.
16
then fuse to lysosomes (identifiable by Lysosomal-associated membrane protein 1; LAMP1) containing low-pH dependent hydrolases, forming autolysosomes. The pH of these vesicles lowers throughout this process, provoking the degradation of proteins within the autolysosome, including p62 and LC3. Autophagic flux, or the rate at which proteins are degraded by this pathway, can change in response to cellular stress and nutrient availability. Moreover, changes in autophagic flux can rapidly affect the localization and expression of proteins involved in this pathway (Loos et al., 2014). Accordingly, measurements of autophagy often require the use of inhibitors to capture proteins in transit within this pathway. Examples of well-characterized autophagy inhibitors include leupeptin, a selective lysosomal protease inhibitor, ammonium chloride (NH4Cl), which raises vesicular pH, and bafilomycin A1 and chloroquine, which act by preventing the fusion of autophagosomes and lysosomes (Yang et al., 2013).
Immunofluorescence protocol for in situ visualization of proteins within endomembrane vesicles
Immunofluorescence is a common laboratory technique that involves the fixation, permeabilization, and antibody staining of cells to view proteins in situ
17
immunofluorescence protocol specifically designed to avoid the destruction of membrane-bound organelles. This protocol was based on a previous technique designed to permeabilize fixed cells with digitonin, a selective detergent that punctures the plasma membrane while leaving endomembrane vesicles intact (Jaattela & Nylandsted, 2015). The protocol was as follows:
Cells were washed with ice cold PBS supplemented with 40 mM NH4Cl to stop lysosomal protease activity and then fixed with PBS containing 3.4% paraformaldehyde and 0.1% glutaraldehyde for 5 minutes at room temperature. Cells were then permeabilized and blocked with 0.02% digitonin in LI-COR Odyssey Blocking Buffer containing 5% serum for 30 minutes at room temperature. The following steps were then performed in blocking buffer containing 0.02% digitonin and 5% serum: First, cells were incubated at room temperature for 1 hour in blocking buffer containing primary antibodies. Cells were then washed three times for five minutes with PBS and then incubated for 1 hour at room temperature in wash buffer containing secondary antibodies. Cells were then washed with PBS containing 1 µg/mL DAPI for five minutes at room temperature, followed by three washes with PBS before visualization.
Autophagy stimulates p16 recruitment to lysosomes where it is degraded
18
lysosomal protease inhibitor (Yang et al., 2013). Protein analysis of RPE-1 cells via western blot demonstrated that 24-hour exposure to leupeptin combined with NH4Cl increased the ratio of LC3-II to LC3-I, confirming that lysosomal degradation was sufficiently blocked by this treatment (Figure 5A-B).
To test if autophagy triggers p16 recruitment to lysosomes we performed immunofluorescence staining in RPE-1 cells and quantified the amount of p16 co-co-localized with lysosomes. Using leupeptin+NH4Cl, we blocked lysosomal degradation while stimulating autophagy via serum starvation, hydrogen peroxide, or etoposide treatment. For all treatments, stimulation of autophagy in cells with active lysosomes produced few cytoplasmic p16 puncta (Figure 6A and 6C). However, blocking lysosomal degradation with leupeptin and NH4Cl for 24 hours resulted in the accumulation of cytoplasmic p16 puncta that co-localized with LAMP1, suggesting that a proportion of p16 was recruited to lysosomes (Figure 6B and 6C). Stimulation of autophagy significantly increased the total number of p16 puncta per cell when lysosomal degradation was inhibited. Additionally, autophagy greatly increased the number of LAMP1 puncta per cell, suggesting an upregulation in lysosome production (Figure 6D). Although simultaneous autophagy activation and blocking increased the number of lysosomes per cell relative to blocking alone, the percentage of p16 puncta colocalized with lysosomes was not significantly changed, suggesting that most p16 aggregates that form were inside lysosomes (Figure 6E).
19
is always in autophagic flux. To test this, we performed protein analysis by western blot on cells treated with leupeptin and NH4Cl. Blocking lysosomal degradation for 24 hours increased total p16 protein levels (Figure 6F and Figure 5C). Additionally, RT-qPCR performed 4 and 24 hours after treatment revealed that increased p16 protein in response to lysosome inhibition was not the result of de novo p16 transcription (Figure 6G). These results confirm that p16 can be degraded by lysosomes and is always in autophagic flux in RPE-1 cells.
Together, these experiments demonstrate that stimulation of autophagy by serum starvation, hydrogen peroxide, or etoposide enhances p16 localization to lysosomes, and cells accumulate lysosomal p16 when autophagic degradation is disrupted. Furthermore, blocking lysosomal degradation increases total p16 protein levels within cells without upregulating p16 transcription, demonstrating that p16 is degraded by autophagy.
Disrupting autophagosome-lysosome fusion causes p16 aggregation within autophagosomes
20
autophagosomes (Bjorkoy et al., 2009). In Figure 6, we demonstrated that p16 localizes to lysosomes when autophagy is stimulated by nutrient deprivation or cellular stress. We therefore asked if p16 is targeted to lysosomes by autophagosomes in response to autophagy.
To test this, we first exposed RPE-1 cells to bafilomycin or chloroquine for 24 hours to test if autophagy was blocked by these treatments. Protein analysis via western blot revealed a significant increase in LC3-II/LC3-I, which confirmed that autophagy was sufficiently blocked (Figure 5A-B).
21
these cytoplasmic puncta were p16, and to test if p16 itself affects autophagosome formation, we silenced p16 via siRNA and performed immunostaining to detect p16 and LC3 accumulation in cells treated with chloroquine. Knockdown of p16 eliminated p16 puncta without disrupting LC3 expression and formation in response to chloroquine, demonstrating that p16 is not required for autophagosome formation (Figure 9A-C).
Finally, to test if p16 protein accumulates in cells with dysfunctional autophagy we treated RPE-1 cells with chloroquine or bafilomycin and performed protein analysis via western blot. Both chloroquine and bafilomycin were sufficient to increase total p16 protein levels after 24 hours (Figure 7F and Figure 5C). Additionally, RT-qPCR performed 4 and 24 hours after both treatments revealed that increased p16 protein in response to blocking autophagosome-lysosome fusion was not the result of de novo p16 transcription (Figure 7G).
Together these results validate that p16 is shuttled through the autophagy pathway by autophagosomes, which implicates this pathway as a potential regulator of p16 and senescence.
Autophagosome chaperone p62/SQSTM1 mediates p16 recruitment to lysosomes
22
tested if p16 is selectively targeted to the autophagy pathway via p62 by studying p16 localization in response to the silencing of p62 by siRNA.
First, we tested if p62 knockdown inhibited the autophagy pathway by silencing p62 and studying its effects on LC3 puncta formation. To do this, we co-treated RPE-1 cells with either siRNA targeting p62 or control scramble siRNA, as well as DMSO or the autophagy blocker chloroquine for 24 hours. Protein analysis via western blot confirmed robust knockdown of p62 24 hours after siRNA treatment (Figure 10A-B). Immunofluorescence revealed cytoplasmic LC3 and p62 puncta were present 24 hours after exposing cells to chloroquine and scramble siRNA, suggesting that these proteins accumulated within stalled autophagosomes (Figure 10C-D). Knockdown of p62 alone was not sufficient to induce LC3 puncta. Additionally, p62 knockdown ablated p62- but not LC3-puncta formation in response to chloroquine, suggesting that silencing p62 does not block LC3 expression or autophagy.
23
24
Figure 4. Autophagy pathway model depicting molecular markers and inhibitors.
25
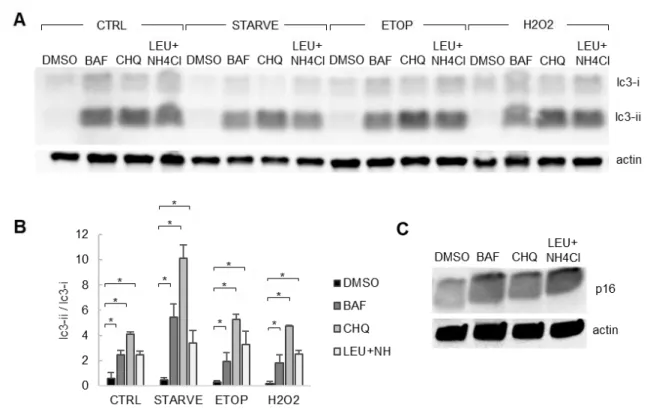
Figure 5. Blocking autophagy using chemical inhibitors.
RPE-1 cells were treated with etoposide (20 µM), H2O2 (200 µM), or serum starved for 24 hours. Additionally, each group was treated with DMSO or autophagy inhibitors bafilomycin (100 nM), chloroquine (40 µM), or leupeptin (100 µM) with NH4Cl (10 mM). Cells were then lysed for whole-cell protein analysis via western blot. A) Representative western blot. B) Quantification of western blot showing quantified LC3-II/LC3-I. Statistical significance determined using three-way ANOVA
(n = 3). * = p<0.05 relative to respective DMSO. All error bars = standard deviation. C)
26 Figure 6. Autophagy recruits p16 to lysosomes.
RPE-1 cells were treated with etoposide (20 μM), H2O2 (200 μM), or serum starved for 24 hours.
Additionally, each group was treated with DMSO or leupeptin (100 μM) and NH4Cl (10 mM). Cells were fixed and permeabilized with digitonin for immunofluorescence staining. A) Cells treated with DMSO, in addition to the treatments previously described. DAPI in blue; p16 in red; LAMP1 in green. Scale bars =
10 μm. B) Cells treated with leupeptin+NH4Cl, in addition to the treatments previously described. C)
Quantification of p16 puncta per cell. D) Quantification of LAMP1 puncta per cell. E) Quantification of % colocalization for LEU+NH4Cl treatment groups, calculated as the percent of total p16 puncta per cell co-localized with LAMP1 puncta. For C-E, results are the mean of sample means obtained from 9 images per group with at least 100 cells per image. Significance determined by two-way ANOVA and Bonferonni post-hoc (n = 9). ns = p>0.01 and * = p<0.01. F) Quantification of western blots for cells treated with
leupeptin (100 μM) and NH4Cl (10 mM) for 24 hours. Proteins normalized to actin. Significance
27
Figure 7. Blocking autophagy results in p16 accumulation within autophagosomes.
RPE-1 cells were treated with etoposide (20 µM), H2O2 (200 µM), or serum starved for 24 hours. Additionally, each group was treated with DMSO, bafilomycin (100 nM), or chloroquine (40 µM). Cells were then fixed and permeabilized with digitonin for immunofluorescence staining. A) Cells treated with DMSO, in addition to the treatments previously described. DAPI shown in blue; p16 shown in red; LC3 shown in green. Scale bars = 10 μm. B) Cells treated with chloroquine, in addition to the treatments previously described. C) Quantification of p16 puncta per cell. D) Quantification of LC3 puncta per cell. E) Quantification of % colocalization, calculated as the percent of total p16 puncta per cell co-localized with LC3 puncta. For C-E, results are the mean of sample means obtained from 10 images per group with at least 100 cells per image. Statistical significance determined by two-way ANOVA and Bonferonni correction (n = 10). ns = p>0.01 and * = p<0.01 relative to respective DMSO. F) Quantification of western blots for cells treated with bafilomycin (100 nM) or chloroquine (40 µM) for 24 hours. Proteins normalized
to actin. Statistical significance determined by one-way ANOVA (n = 3). * = p<0.05. G) RT-qPCR for
28
Figure 8. Representative immunofluorescence images for Figure 7C-E for cells treated with bafilomycin.
29
Figure 9. siRNA knockdown of p16 does not disrupt autophagasome formation.
30
Figure 10. siRNA knockdown of p62 does not induce or disrupt autophagasome formation.
RPE-1 cells were treated 40 µM chloroquine to block autophagy and transfected with siRNA-p62 or siRNA-scramble control for 24 hours. Whole cell lysates were then obtained and used for protein
analysis via western blot. A) Representative western blot for p62 knockdown via siRNA. B)
Quantification of p62 knockdown western blot. Statistical significance performed using two-tailed
student’s t-test. n = 3. C) RPE-1 cells were treated with DMSO or 40 µM chloroquine to block
31
Figure 11. p16-lysosome recruitment is mediated by p62.
RPE-1 cells transfected with siRNA-p62 or scramble control (Sc) were treated with etoposide (20 μM), H2O2 (200 μM), or serum starved for 24 hours. Additionally, each group was treated with leupeptin (100 μM) and NH4Cl (10 mM). Cells were then fixed and permeabilized with digitonin for immunofluorescence
staining. A) Cells treated with leupeptin+NH4Cl and scramble control, in addition to the treatments
previously described. DAPI shown in blue; p16 shown in red; LAMP1 shown in green. Scale bars = 10 μm. B) Cells treated with leupeptin+NH4Cl and siRNA targeting p62, in addition to the treatments previously described. C) Quantification of p16 puncta per cell. D) Quantification of LAMP1 puncta per
cell. E) Quantification of % colocalization, calculated as the percent of total p16 puncta per cell
32
CHAPTER 4: HIGH-CONTENT EPIGENETIC DRUG SCREEN FOR REGULATORS OF P16INK4A
Introduction
Modifications in the epigenetic profile of p16 have been linked to both repression and expression of p16. For example, two well-known modulators of p16 are CpG island methylation and histone methylation via Polycomb repression complexes. Both of these epigenetic modifiers play a role in p16 repression, which in turn prevents cellular senescence and contributes to tumor metastasis.
CpG island methylation
33
Polycomb repression complexes
Polycomb-group proteins form complexes that are linked to the epigenetic silencing of genes via histone methylation (Lund & van Lohuizen, 2004). Bmi-1 is transcription factor and member of the Polycomb repressor complex 1 (PRC1) that silences gene expression by inducing H3K27 methylation (Abdouh, Hanna, El Hajjar, Flamier, & Bernier, 2016). Bmi-1 was found to represses p16 directly by binding to a Bmi1-responding element (BRE) within the p16 promoter (Kotake et al., 2007). Knockout of Bmi-1 resulted in upregulation of p16 and decreased proliferation. Furthermore, silencing of EZH2, a catalytic subunit of Polycomb repressor complex 2 (PRC2) also significantly upregulated p16 transcription (Kotake et al., 2007).
Epigenetic drug screens can find novel targets for disease therapies
34
Unlike gene-therapies, in which diseases are treated by targeting mutations within a static DNA sequence, epigenetic-therapies require targeting a dynamic and complex system of interacting proteins and genes in order to obtain a specific chromatin state. Consequently, the ability to perform high-content screens for epigenetic regulators of a protein of interest is limited by the ability to identify changes in protein expression with temporal resolution. In response to the need for a dynamic readout of expression, researchers have begun to employ live-cell fluorescent protein reporter cell lines to perform high-content screens for epigenetic regulators (Headley et al., 2019). The development of an endogenous p16 fluorescent reporter cell line provides researchers with a useful tool to perform high-content drug screens for modulators of p16 expression and discover potential therapeutic targets for senescence, cancer, and aging-associated diseases.
Epigenetic drug screening using RPE p16-mCherry cells
35
expression by Z-factor testing for statistical significance relative to DMSO (Figure 12B). siRNA-p16 and 10 μM etoposide for 48 hours were determined to be adequate negative and positive controls for p16-mCherry expression, respectively (Z-factor > 0).
Next, RPE p16-mCherry cells were treated for 48 hours with 64 drugs that inhibit various epigenetic modifiers, including histone deacetylases (HDACs), methyltransferases (HMTs), and acetyltransferases (HATs), as well as specific inhibitors of polycomb repressor family proteins, including Bmi-1 and EZH2 (Table 1). These drugs were dispensed into a 384-well plate with concentrations ranging from 0.08-50 μM. Etoposide and siRNA knockdown of p16 were used as activator and repressor controls, respectively. Changes in p16 expression between treatments were detected by quantifying the overall mean per well of mean p16-mCherry fluorescence per cell using image analysis software. Potency as an epigenetic modulator of p16 was determined by Z-factor testing for statistical significance.
36
various members of the BET (Bromodomain and extraterminal domain) family resulted in both up- and downregulation of p16: OTX015 and I-BET151 caused a decrease in p16, whereas inhibiting Bromosporine and JQ1 induced p16 expression. Lastly, p16 expression increased in response to HCl-2509 (SP2509), an inhibitor of Lysine-specific demethylase 1 (LSD1).
37
Figure 12. Preliminary test for establishing controls for epigenetic drug screen
38
TABLE 1: Epigenetic compound reference
WELL COMMON NAME TARGET CLASS
A:3 Panobinostat HDACs HDAC
A:4 BAY-598 SMYD2 HMT
A:5 LLY-507 SMYD2 HMT
A:6 EPZ011989 EZH2 HMT
B:3 Cl-994 (Tacedinaline) HDAC1,2,3 HDAC
B:4 Romidepsin HDACs HDAC
B:5 OICR9429 WDR5 Kme Reader
B:6 SGC0946 DOT1L HMT
C:3 UNC0642 G9a/GLP HMT
C:4 UNC0638 G9a/GLP HMT
C:5 C646 p300 (HAT) Other
C:6 A-366 G9a/GLP HMT
D:3 I-CBP112 CREBBP/EP300 bromodomain
D:4 CAY10603 HDAC6 HDAC
D:5 Olaparib PARP (poly ADP ribose polymerase) Other
D:6 EPZ-6438 EZH2 HMT
E:3 LP99 BRD9/7 bromodomain
E:4 GSK591 PRMT5 HMT
E:5 Chidamide HDACs HDAC
E:6 OTX015 BET family bromodomain
F:3 I-BRD9 BRD9 bromodomain
F:4 GSK-LSD1 LSD1 Demethylase
F:5 Entinostat HDAC1,3 HDAC
F:6 MI-503 Menin-MLL Other
G:3 MS023 Type I PRMT HMT
G:4 GSK126 EZH2 HMT
G:5 IOX2 PHD (Prolyl hydroxylase) Other
G:6 EI1 EZH2 HMT
H:3 UNC3866 CBX4/7 (CBXs) Kme Reader
H:4 GSK484 PAD-4 (Protein Arg deiminase 4) Other
H:5 PFI-1 BET family bromodomain
H:6 BAZ2-ICR BAZ2A/B bromodomain
I:3 GSK2801 BAZ2A/B bromodomain
I:4 GSK-J4 (J1) JMJD3/UTX Demethylase
I:5 I-BET151 BET family bromodomain
I:6 KDOAM25 JARID1/KDM5 Demethylase
J:3 Bromosporine bromodomains bromodomain
J:4 Decitabine DNMTs Other
J:5 SGC-CBP30 CREBBP/EP300 bromodomain
39
TABLE 1: Epigenetic compound reference (continued)
WELL COMMON NAME TARGET CLASS
K:3 TSA HDACs (except 8) HDAC
K:4 I-BET762 (GSK525762A) BET family bromodomain
K:5 PFI-4 BRPF1 bromodomain
K:6 BI-9564 BRD9/7 bromodomain
L:3 A-196 SUV420H1/H2 HMT
L:4 IOX1 2-OG (OxoGlutarate oxygenases) Other
L:5 PFI-3 SMARCA2/4, PBI(5) bromodomain
L:6 SGC707 PRMT3 HMT
M:3 GSK343 EZH2 HMT
M:4 MS049 PRMT 4&6 HMT
M:5 (R)-PFI-2 SETD7 HMT
M:6 UNC1999 EZH2/EZH1 HMT
N:3 EPZ-5676 DOT1L HMT
N:4 LAQ824 (Dacinostat) HDACs HDAC
N:5 EPZ015666 PRMT5 HMT
N:6 (+)-JQ1 BET family bromodomain
O:3 OF-1 BRPF family bromodomain
O:4 SAHA (Vorinostat) HDAC1,2,3,6 HDAC
O:5 PTC-209 BMI-1 Other
O:6 BAY299 BRD1/TAF1 bromodomain
P:3 PCI-34051 HDAC8 HDAC
P:4 NI-57 BRPF family bromodomain
P:5 HCl-2509 (SP2509) LSD1 Demethylase
40
Figure 13. Epigenetic drug screen for modulators of p16 expression.
RPE p16-mCherry cells were treated with epigenetic targeting drugs, DMSO, siRNA-p16, or
etoposide for 48 hours. A) Heat map represents total mean per well of mean p16-mCherry
fluorescence per cell relative to DMSO control group (green = no change, yellow = higher fluorescence, blue = lower fluorescence). White wells = >50% cell death. Mean fluorescence =
integrated pixel intensity/total pixels per cell. Units in relative fluorescence units. B) Bar graph
41
TABLE 2: Modulators of p16 from epigenetic drug screen
WELL COMMON NAME TARGET CLASS EFFECT ON P16
A:3 Panobinostat HDACs HDAC INHIBITOR
B:4 Romidepsin HDACs HDAC INHIBITOR
D:4 CAY10603 HDAC6 HDAC INHIBITOR
E:5 Chidamide HDACs HDAC INHIBITOR
E:6 OTX015 BET family bromodomain INHIBITOR
I:5 I-BET151 BET family bromodomain INHIBITOR
F:5 Entinostat HDAC1,3 HDAC INHIBITOR
K:3 TSA HDACs (except 8) HDAC INHIBITOR
N:4 LAQ824 (Dacinostat) HDACs HDAC INHIBITOR
O:4 SAHA (Vorinostat) HDAC1,2,3,6 HDAC INHIBITOR
F:6 MI-503 Menin-MLL Other ACTIVATOR
G:4 GSK126 EZH2 HMT ACTIVATOR
J:3 Bromosporine bromodomains bromodomain ACTIVATOR
M:6 UNC1999 EZH2/EZH1 HMT ACTIVATOR
N:6 (+)-JQ1 BET family bromodomain ACTIVATOR
O:3 OF-1 BRPF family bromodomain ACTIVATOR
O:5 PTC-209 BMI-1 Other ACTIVATOR
42 Figure 14. Validation of epigenetic drug screen.
RPE-1 cells were treated with epigenetic targeting drugs, DMSO, siRNA-p16, or etoposide. RNA lysates were collected after 48 hours. Converted cDNA was then used for RT-qPCR. Results show quantified p16 transcript fold-change relative to DMSO control. Error bars = standard deviation from 3 independent experiments.
43
CHAPTER 5: CONCLUSIONS AND FUTURE DIRECTIONS
Conclusions and future directions for studying the effects of autophagy on p16 expression and localization
The experiments presented in this dissertation demonstrate that the localization and degradation of the p16 protein is regulated in part by the autophagy-lysosomal pathway in human RPE-1 cells. Live-cell experiments using a p16-mCherry fluorescent reporter revealed that autophagy stimulation induces lysosomal p16 enrichment within 4 hours and can be triggered by serum starvation, oxidative stress by hydrogen peroxide, and genotoxic stress by the chemotherapeutic agent etoposide. Blocking autophagy using leupeptin, chloroquine, or bafilomycin greatly increases the amount of p16 inside lysosomes, demonstrating that p16 can be degraded by this pathway. Additionally, we found that p16 is recruited to lysosomes by the chaperone protein p62. Together, these results reveal an unappreciated mode of regulation of the p16 protein in human cells.
44
a relatively short time-frame. By creating an endogenous p16-mCherry reporter in human cells, we have contributed a novel tool for examining p16 expression and localization over time. Use of this reporter in future experiments will help to further our understanding of p16 dynamics in response to a multitude of chemotherapeutic agents, cellular stresses, and inducers of autophagy dysfunction.
Further study is required to identify the precise mechanisms that control p16 localization. For example, it is not known which domains on the p16 protein are responsible for autophagosomal and lysosomal recruitment. While we have found that p62 promotes p16 recruitment to lysosomes, the endomembrane-transport system is complex, with many additional chaperone proteins and post-translational modifiers involved in recruiting, sorting, and shuttling cargo between different compartments of the cell. Determining the specific factors that control p16 transport could reveal potential drug targets for disease and anti-aging therapies.
45
localization to lysosomal function, which both serve as key regulators of senescence, disease, and aging.
Since the p16 protein has long been known to promote cell cycle arrest through inhibition of CDK4/6 in the nucleus, these results suggest a potential competition between the autophagy and senescence pathways through the sequestration of p16. Under this hypothetical model, stress induces the production of p16, which is quickly recruited to autophagosomes and degraded by lysosomes via the autophagy pathway. Over time, either through enhanced transcriptional activity or through p16 protein localization outside of lysosomes, p16 is able to enter the nucleus to bind to CDK4/6 and arrest the cell cycle. However, if the autophagy pathway is inhibited, p16 degradation is perturbed, which could lead to premature senescence. From this model, we posit that autophagy “buys time” for cells undergoing stress to determine whether the damage is manageable and cells are able to resume proliferation once the stress conditions are eliminated. Alternatively, if stress conditions persist, or if autophagy is dysregulated, the cell enters senescence. Future studies will be necessary to determine whether sequestration of p16 through the autophagy-lysosomal pathways reduces a cell’s tendency to undergo senescence.
46
illuminate how these treatments work at a mechanistic level. The ability to control senescence and attenuate cell growth via combined treatment with chemotherapeutics and well-established autophagy inhibitors could have major implications for cancer treatment. Beyond this application, the ability to slow or prevent senescence in healthy proliferating cells, such as stem cells, could lead to potential new therapies for other age-related diseases. In addition, we believe it is worth exploring the role of p16 in lysosomal storage diseases, which account for dozens of disorders associated with the brain, skin, heart, and central nervous system.
Conclusions and future directions for epigenetic screening for regulators of p16
Our high-content screen for epigenetic regulators of p16 revealed several epi-targeting drugs that repressed or activated p16. Furthermore, the development of a live fluorescent p16 reporter cell line provided a novel screening tool that could be utilized for future drug discovery projects that target regulators of p16 expression.
47
cancer (Dimartino & Cleary, 1999; Yokoyama et al., 2004). Menin-MLL has been reporter to regulate the expression of a variety of cyclin-dependent kinase inhibitors, including p16INK4A, p27Kip1 and p18Ink4c (Kotake, Zeng, & Xiong, 2009;
Milne et al., 2005). Lastly,JQ-1, a potent BET inhibitor, induced p16 expression. JQ-1 has been reported to inhibit H3K27me3 activity at the p16 promoter, which upregulates p16 expression (Y. Zhang et al., 2018). Although the targets of these small molecules have previously been reported to affect p16 expression, these results confirm the accuracy and robustness of our screening platform, and identify specific compounds that could potentially serve as therapeutics for p16-associated diseases.
48
polycomb repressor complexes 1 and 2, which are known to silence p16 transcription. Future studies should focus on determining if the HDAC inhibitors used in this screen upregulate repressors of p16, such as ANRIL.
49
REFERENCES
Abdouh, M., Hanna, R., El Hajjar, J., Flamier, A., & Bernier, G. (2016). The Polycomb Repressive Complex 1 Protein BMI1 Is Required for Constitutive Heterochromatin Formation and Silencing in Mammalian Somatic Cells. J Biol Chem, 291(1), 182-197. doi:10.1074/jbc.M115.662403
Arifin, M. T., Hama, S., Kajiwara, Y., Sugiyama, K., Saito, T., Matsuura, S., . . . Kurisu, K. (2006). Cytoplasmic, but not nuclear, p16 expression may signal poor prognosis in high-grade astrocytomas. J Neurooncol, 77(3), 273-277. doi:10.1007/s11060-005-9037-5
Baker, D. J., Childs, B. G., Durik, M., Wijers, M. E., Sieben, C. J., Zhong, J., . . . van Deursen, J. M. (2016). Naturally occurring p16(Ink4a)-positive cells shorten healthy lifespan. Nature, 530(7589), 184-189. doi:10.1038/nature16932
Baker, D. J., Wijshake, T., Tchkonia, T., LeBrasseur, N. K., Childs, B. G., van de Sluis, B., . . . van Deursen, J. M. (2011). Clearance of p16Ink4a-positive senescent cells delays ageing-associated disorders. Nature, 479(7372), 232-236. doi:10.1038/nature10600
Ben-Saadon, R., Fajerman, I., Ziv, T., Hellman, U., Schwartz, A. L., & Ciechanover, A. (2004). The tumor suppressor protein p16(INK4a) and the human papillomavirus oncoprotein-58 E7 are naturally occurring lysine-less proteins that are degraded by the ubiquitin system. Direct evidence for ubiquitination at the N-terminal residue. J Biol Chem, 279(40), 41414-41421. doi:10.1074/jbc.M407201200
Bjorkoy, G., Lamark, T., Pankiv, S., Overvatn, A., Brech, A., & Johansen, T. (2009). Monitoring autophagic degradation of p62/SQSTM1. Methods Enzymol, 452, 181-197. doi:10.1016/S0076-6879(08)03612-4
Blasiak, J., Piechota, M., Pawlowska, E., Szatkowska, M., Sikora, E., & Kaarniranta, K. (2017). Cellular Senescence in Age-Related Macular Degeneration: Can Autophagy and DNA Damage Response Play a Role?
50
Carmona-Gutierrez, D., Hughes, A. L., Madeo, F., & Ruckenstuhl, C. (2016). The crucial impact of lysosomes in aging and longevity. Ageing Res Rev, 32, 2-12. doi:10.1016/j.arr.2016.04.009
Childs, B. G., Durik, M., Baker, D. J., & van Deursen, J. M. (2015). Cellular senescence in aging and age-related disease: from mechanisms to therapy.
Nat Med, 21(12), 1424-1435. doi:10.1038/nm.4000
Culver-Cochran, A. E., & Chadwick, B. P. (2012). The WSTF-ISWI chromatin remodeling complex transiently associates with the human inactive X chromosome during late S-phase prior to BRCA1 and gamma-H2AX. PLoS One, 7(11), e50023. doi:10.1371/journal.pone.0050023
Dimartino, J. F., & Cleary, M. L. (1999). Mll rearrangements in haematological malignancies: lessons from clinical and biological studies. Br J Haematol, 106(3), 614-626. doi:10.1046/j.1365-2141.1999.01439.x
Dok, R., Abbasi Asbagh, L., Van Limbergen, E. J., Sablina, A., & Nuyts, S. (2016). Nuclear p16INK4a expression predicts enhanced radiation response in head and neck cancers. Oncotarget, 7(25), 38785-38795. doi:10.18632/oncotarget.9609
Fragoso, M. A., Patel, A. K., Nakamura, R. E., Yi, H., Surapaneni, K., & Hackam, A. S. (2012). The Wnt/beta-catenin pathway cross-talks with STAT3 signaling to regulate survival of retinal pigment epithelium cells. PLoS One, 7(10), e46892. doi:10.1371/journal.pone.0046892
Goldenthal, K. L., Hedman, K., Chen, J. W., August, J. T., & Willingham, M. C. (1985). Postfixation detergent treatment for immunofluorescence suppresses localization of some integral membrane proteins. J Histochem Cytochem, 33(8), 813-820. doi:10.1177/33.8.3894499
Golestaneh, N., Chu, Y., Xiao, Y. Y., Stoleru, G. L., & Theos, A. C. (2017). Dysfunctional autophagy in RPE, a contributing factor in age-related macular degeneration. Cell Death Dis, 8(1), e2537. doi:10.1038/cddis.2016.453
51
the p16/CDKN2 tumor suppressor gene in normal and transformed human tissues correlates with gene silencing. Cancer Res, 55(20), 4531-4535. Grunstein, M. (1997). Histone acetylation in chromatin structure and transcription.
Nature, 389(6649), 349-352. doi:10.1038/38664
Headley, K. M., Kedziora, K. M., Alejo, A., Lai, E. Z., Purvis, J. E., & Hathaway, N. A. (2019). Chemical screen for epigenetic barriers to single allele activation of Oct4. Stem Cell Res, 38, 101470. doi:10.1016/j.scr.2019.101470
Hu, Y., Carraro-Lacroix, L. R., Wang, A., Owen, C., Bajenova, E., Corey, P. N., . . . Voronov, I. (2016). Lysosomal pH Plays a Key Role in Regulation of mTOR Activity in Osteoclasts. J Cell Biochem, 117(2), 413-425. doi:10.1002/jcb.25287
Hu, Y. B., Dammer, E. B., Ren, R. J., & Wang, G. (2015). The endosomal-lysosomal system: from acidification and cargo sorting to neurodegeneration. Transl Neurodegener, 4, 18. doi:10.1186/s40035-015-0041-1
Jaattela, M., & Nylandsted, J. (2015). Quantification of Lysosomal Membrane Permeabilization by Cytosolic Cathepsin and beta-N-Acetyl-Glucosaminidase Activity Measurements. Cold Spring Harb Protoc, 2015(11), 1017-1023. doi:10.1101/pdb.prot086165
Jeon, O. H., David, N., Campisi, J., & Elisseeff, J. H. (2018). Senescent cells and osteoarthritis: a painful connection. J Clin Invest, 128(4), 1229-1237. doi:10.1172/JCI95147
Katayama, M., Kawaguchi, T., Berger, M. S., & Pieper, R. O. (2007). DNA damaging agent-induced autophagy produces a cytoprotective adenosine triphosphate surge in malignant glioma cells. Cell Death Differ, 14(3), 548-558. doi:10.1038/sj.cdd.4402030
Kim, H. J., & Bae, S. C. (2011). Histone deacetylase inhibitors: molecular mechanisms of action and clinical trials as anti-cancer drugs. Am J Transl Res, 3(2), 166-179.
52
repression complexes binding to and silencing p16INK4alpha tumor suppressor gene. Genes Dev, 21(1), 49-54. doi:10.1101/gad.1499407 Kotake, Y., Zeng, Y., & Xiong, Y. (2009). DDB1-CUL4 and MLL1 mediate
oncogene-induced p16INK4a activation. Cancer Res, 69(5), 1809-1814. doi:10.1158/0008-5472.CAN-08-2739
Kozlowski, M. R. (2012). RPE cell senescence: a key contributor to age-related macular degeneration. Med Hypotheses, 78(4), 505-510. doi:10.1016/j.mehy.2012.01.018
Krishnamurthy, J., Torrice, C., Ramsey, M. R., Kovalev, G. I., Al-Regaiey, K., Su, L., & Sharpless, N. E. (2004). Ink4a/Arf expression is a biomarker of aging.
J Clin Invest, 114(9), 1299-1307. doi:10.1172/JCI22475
Lee, B. Y., Han, J. A., Im, J. S., Morrone, A., Johung, K., Goodwin, E. C., . . . Hwang, E. S. (2006). Senescence-associated beta-galactosidase is lysosomal beta-galactosidase. Aging Cell, 5(2), 187-195. doi:10.1111/j.1474-9726.2006.00199.x
Loos, B., du Toit, A., & Hofmeyr, J. H. (2014). Defining and measuring autophagosome flux-concept and reality. Autophagy, 10(11), 2087-2096. doi:10.4161/15548627.2014.973338
Lu, M., Zak, J., Chen, S., Sanchez-Pulido, L., Severson, D. T., Endicott, J., . . . Lu, X. (2014). A code for RanGDP binding in ankyrin repeats defines a nuclear import pathway. Cell, 157(5), 1130-1145. doi:10.1016/j.cell.2014.05.006 Lund, A. H., & van Lohuizen, M. (2004). Polycomb complexes and silencing
mechanisms. Curr Opin Cell Biol, 16(3), 239-246. doi:10.1016/j.ceb.2004.03.010
Mihic-Probst, D., Mnich, C. D., Oberholzer, P. A., Seifert, B., Sasse, B., Moch, H., & Dummer, R. (2006). p16 expression in primary malignant melanoma is associated with prognosis and lymph node status. Int J Cancer, 118(9), 2262-2268. doi:10.1002/ijc.21608
53
cyclin-dependent kinase inhibitors. Proc Natl Acad Sci U S A, 102(3), 749-754. doi:10.1073/pnas.0408836102
Moosavi, A., & Motevalizadeh Ardekani, A. (2016). Role of Epigenetics in Biology and Human Diseases. Iran Biomed J, 20(5), 246-258.
Nilsson, K., & Landberg, G. (2006). Subcellular localization, modification and protein complex formation of the cdk-inhibitor p16 in functional and Rb-inactivated tumor cells. Int J Cancer, 118(5), 1120-1125. doi:10.1002/ijc.21466
Petrova, N. V., Velichko, A. K., Razin, S. V., & Kantidze, O. L. (2016). Small molecule compounds that induce cellular senescence. Aging Cell. doi:10.1111/acel.12518
Platt, F. M., Boland, B., & van der Spoel, A. C. (2012). The cell biology of disease: lysosomal storage disorders: the cellular impact of lysosomal dysfunction.
J Cell Biol, 199(5), 723-734. doi:10.1083/jcb.201208152
Popovic, R., & Licht, J. D. (2012). Emerging epigenetic targets and therapies in cancer medicine. Cancer Discov, 2(5), 405-413. doi:10.1158/2159-8290.CD-12-0076
Ptak, C., & Petronis, A. (2008). Epigenetics and complex disease: from etiology to new therapeutics. Annu Rev Pharmacol Toxicol, 48, 257-276. doi:10.1146/annurev.pharmtox.48.113006.094731
Purvis, J. E., Karhohs, K. W., Mock, C., Batchelor, E., Loewer, A., & Lahav, G. (2012). p53 dynamics control cell fate. Science, 336(6087), 1440-1444. doi:10.1126/science.1218351
Purvis, J. E., & Lahav, G. (2013). Encoding and decoding cellular information through signaling dynamics. Cell, 152(5), 945-956. doi:10.1016/j.cell.2013.02.005
54
Rocco, J. W., & Sidransky, D. (2001). p16(MTS-1/CDKN2/INK4a) in cancer progression. Exp Cell Res, 264(1), 42-55. doi:10.1006/excr.2000.5149 Ruas, M., & Peters, G. (1998). The p16INK4a/CDKN2A tumor suppressor and its
relatives. Biochim Biophys Acta, 1378(2), F115-177. doi:10.1016/s0304-419x(98)00017-1
Serra, S., & Chetty, R. (2018). p16. J Clin Pathol, 71(10), 853-858. doi:10.1136/jclinpath-2018-205216
Serrano, M. (1997). The tumor suppressor protein p16INK4a. Exp Cell Res, 237(1), 7-13. doi:10.1006/excr.1997.3824
Shaner, N. C., Steinbach, P. A., & Tsien, R. Y. (2005). A guide to choosing fluorescent proteins. Nat Methods, 2(12), 905-909. doi:10.1038/nmeth819 Sherr, C. J., & McCormick, F. (2002). The RB and p53 pathways in cancer. Cancer
Cell, 2(2), 103-112.
Strauss, O. (2005). The retinal pigment epithelium in visual function. Physiol Rev, 85(3), 845-881. doi:10.1152/physrev.00021.2004
Wiggers, C. R. M., Govers, A., Lelieveld, D., Egan, D. A., Zwaan, C. M., Sonneveld, E., . . . Bartels, M. (2019). Epigenetic drug screen identifies the histone deacetylase inhibitor NSC3852 as a potential novel drug for the treatment of pediatric acute myeloid leukemia. Pediatr Blood Cancer, 66(8), e27785. doi:10.1002/pbc.27785
Wu, B., Pan, X., Chen, X., Chen, M., Shi, K., Xu, J., . . . Liu, Y. (2019). Epigenetic drug library screening identified an LSD1 inhibitor to target UTX-deficient cells for differentiation therapy. Signal Transduct Target Ther, 4, 11. doi:10.1038/s41392-019-0040-2
Xing, X. B., Cai, W. B., Luo, L., Liu, L. S., Shi, H. J., & Chen, M. H. (2013). The Prognostic Value of p16 Hypermethylation in Cancer: A Meta-Analysis.
PLoS One, 8(6), e66587. doi:10.1371/journal.pone.0066587
55
inhibiting fusion between autophagosomes and lysosomes in rat hepatoma cell line, H-4-II-E cells. Cell Struct Funct, 23(1), 33-42.
Yang, Y. P., Hu, L. F., Zheng, H. F., Mao, C. J., Hu, W. D., Xiong, K. P., . . . Liu, C. F. (2013). Application and interpretation of current autophagy inhibitors and activators. Acta Pharmacol Sin, 34(5), 625-635. doi:10.1038/aps.2013.5
Yap, K. L., Li, S., Munoz-Cabello, A. M., Raguz, S., Zeng, L., Mujtaba, S., . . . Zhou, M. M. (2010). Molecular interplay of the noncoding RNA ANRIL and methylated histone H3 lysine 27 by polycomb CBX7 in transcriptional silencing of INK4a. Mol Cell, 38(5), 662-674. doi:10.1016/j.molcel.2010.03.021
Yokoyama, A., Wang, Z., Wysocka, J., Sanyal, M., Aufiero, D. J., Kitabayashi, I., . . . Cleary, M. L. (2004). Leukemia proto-oncoprotein MLL forms a SET1-like histone methyltransferase complex with menin to regulate Hox gene expression. Mol Cell Biol, 24(13), 5639-5649. doi:10.1128/MCB.24.13.5639-5649.2004
Yoshii, S. R., & Mizushima, N. (2017). Monitoring and Measuring Autophagy. Int J Mol Sci, 18(9). doi:10.3390/ijms18091865
Zhang, X. D., Qi, L., Wu, J. C., & Qin, Z. H. (2013). DRAM1 regulates autophagy flux through lysosomes. PLoS One, 8(5), e63245. doi:10.1371/journal.pone.0063245