OPTIMIZING HIV THERAPY: OUTCOMES, CHALLENGES, AND OPPORTUNITIES FOR VIROLOGICAL MONITORING IN RESOURCE-LIMITED SETTINGS
Sarah E. Rutstein
A dissertation submitted to the faculty at the University of North Carolina at Chapel Hill in partial fulfillment of the requirements for the degree of Doctor of Philosophy in the Department of Health Policy and Management in the Gillings School of Global Public Health.
Chapel Hill 2015
ABSTRACT
Sarah E. Rutstein: Optimizing HIV Therapy: outcomes, challenges, and opportunities for virological monitoring in resource-limited settings
(Under the direction of Andrea K. Biddle)
Despite extraordinary advances in antiretroviral therapy (ART) coverage, only a fraction of the millions of African ART patients have access to routine viral load (VL) monitoring. The goal of this dissertation was to address how to design and implement effective, efficient, and feasible VL monitoring strategies in resource-limited settings. In Aim 1, we studied programmatic and clinical outcomes of dried blood spots (DBS) for VL
ACKNOWLEDGEMENTS
This work was supported by the Ruth L. Kirschstein National Research Service Award for Individual Predoctoral MD/PhD Fellows (F30-MH098731) from the National Institute of Mental Health, as well as the UNC MD/PhD Program (T32-GM008719). The dried blood spot study was supported by the Centers for Disease and Control and
Prevention Public Health Evaluation (MW.10.1433). I also received support from the UNC Centers for Global Initiatives pre-dissertation travel award, supporting Malawi-based
fieldwork, and the Sherri Aversa Memorial Foundation Dissertation Completion Grant, which supported data collection and writing of this dissertation. I am grateful for these generous sources of support.
This research would not have been possible without my Malawian co-investigators. Most notably, the dried blood spot study Principal Investigator Dr. Ronald Mataya, and study coordinators Alice Soko and Memory Mkhandawire. And to Debbie Kamwendo, who has been a shining beacon of positive energy throughout my time in Malawi. Debbie’s
enthusiasm, creative thinking, and (perhaps above all) patience were integral to this research, as well as my own development as an investigator. For this team, and the numerous ART providers and patients who graciously participated in our study, I am grateful.
research questions. Mina, for her seemingly endless knowledge regarding HIV, and for showing me the potential of my training in terms of both research and service. Bill, for his mentorship and support as I added the MD to my training plan, and for bringing me into the rich research community that is UNC Project, Malawi. And Morris, for tolerating more from one student than any PhD Program Director should ever have to, and for remaining my advocate and voice of reason throughout.
TABLE OF CONTENTS
LIST OF TABLES ……….x
LIST OF FIGURES ………..xi
LIST OF ABBREVIATIONS ………..xii
CHAPTER 1: Introduction ………...1
CHAPTER 2: Background ………...7
HIV burden and expanding ART access in sub-Saharan Africa ………..7
ART monitoring ...………..10
Virological monitoring in resource-limited settings: where do we go from here? ……….13
Significance and contribution ………..18
Tables & Figures ………..20
CHAPTER 3: Methods ……….29
Overview and study design ………29
Aim 1 ………..29
Aim 2 ………..33
Aim 3 ………..36
Tables & Figures ………..41
Discussion ...52
Tables & Figures ...56
CHAPTER 5: On the front line of HIV virological monitoring: barriers and facilitators from a provider perspective in resource- limited settings ...63
Introduction ...63
Methods ...64
Results ...67
Discussion ...75
Tables & Figures ...81
CHAPTER 6: Predicting first-line antiretroviral therapy resistance among patients with elevated viral loads: development of a risk score algorithm ...85
Introduction ...85
Methods ...86
Results ...91
Discussion ...94
Tables & Figures ...98
CHAPTER 7: Discussion ...106
Summary of findings ...107
Implications for policy and practice ...111
Knowledge gaps and opportunities for future research ...112
Conclusions ...116
APPENDIX 1: Case report forms (DBS study) ...117
APPENDIX 2: In-depth interview guide ...126
APPENDIX 3: Supplementary Tables (Aim 3) ...129
LIST OF TABLES
Table 2.1. Precision of WHO clinical and immunological criteria in identifying treatment failure in
resource-limited settings ...20 Table 2.2. Antiretroviral drug classifications ...20 Table 2.3. Standard ART regiments in Malawi ...21 Table 4.1. Participant baseline demographics, ART history,
& clinical characteristics ...56
Table 4.2. Demographic, ART, and clinical outcomes among
patients with baseline viral loads >5,000 copies/ml ...58
Table 4.3. Factors associated with baseline virological failure
(>5,000 copies/ml) ...60
Table 5.1. Demographic details of clinic staff participating in
interviews ...81
Table 5.2. Theme frequency ...81
Table 6.1. Bivariable association of NRTI/NNRTI resistance and
potential predictor characteristics ...98
Table 6.2. Adjusted odds ratios and risk scores of NRTI/NNRTI
resistance ...100
LIST OF FIGURES
Figure 2.1. Number of people receiving antiretroviral therapy in
low- and middle-income countries ...23
Figure 2.2. Relationship between viral load and transmission ...24
Figure 2.3. Cascade of HIV treatment for adults (≥15 years old) in sub-Saharan Africa ...25
Figure 2.4. WHO viral load monitoring algorithm ...26
Figure 2.5. WHO viral load monitoring scale-up ...27
Figure 2.6. Modified social ecological model framing barriers and facilitators of virological monitoring implementation ...28
Figure 3.1. Dried blood spot (DBS) study flow ...41
Figure 3.2. Modified social ecological model conceptual framework ...42
Figure 4.1. Flow diagram of study enrollment and follow-up ...61
Figure 4.2. Planned (italics) and observed participant progression through study activities and follow-up ...62
Figure 5.1. WHO viral load monitoring scale-up ...82
Figure 5.2. Dried blood spot (DBS) study flow ...83
Figure 5.3. Modified social ecological model conceptual framework ...84
Figure 6.1. WHO viral load testing strategy for treatment failure ...103
Figure 6.2. Receiver operating characteristic (ROC) curve for Models 1-3 ...104
LIST OF ABBREVIATIONS
3TC Lamivudine
ABC Abacavir
AIDS Acquired Immune Deficiency Syndrome
ACTG AIDS Clinical Trials Group
ART Antiretroviral therapy
ATV/r Atazanavir/ritonavir
AUROC Area under receiver operating characteristic
AZT Zidovudine
BMI Body mass index
CDC Centers for Disease Control and Prevention
CI Confidence interval
CRF Case report form
d4T Stavudine
DBS Dried blood spot
HL Hosemer-Lemeshow
HPTN HIV Prevention and Trials Network
HAS Health surveillance assistant
IRB Institutional Review Board
LR Likelihood ratio
LPV/r Lopinavir/ritonavir
MOH Ministry of Health
NNRTI Non-nucleoside reverse transcriptase inhibitor
NPV Negative predictive value
NRTI Nucleoside reverse transcriptase inhibitor
NVP Nevirapine
OR Odds ratio
PCR Polymerase chain reaction
PEARLS Prospective Evaluation of Antiretrovirals in Resource-Limited Settings
POC Point-of-care
PPV Positive predictive value
RLS Resource-limited setting
RR Risk ratio
SEM Social ecological model
SMS Short Message Service
TDF Tenofovir
TB Tuberculosis
UNAIDS Joint United Nations Programme on HIV/AIDS
UNC University of North Carolina
VL Viral load
CHAPTER 1: INTRODUCTION
When used appropriately, antiretroviral therapy (ART) reduces viral load (VL) and improves quality of life for persons infected with HIV, reducing HIV-associated morbidity and mortality [1-6]. Global treatment access initiatives have resulted in millions receiving life-saving therapy in resource-limited settings, and the potential for reduced HIV transmission through early ART use has reinvigorated efforts to further increase access to therapy [7]. Eligibility for ART also has expanded under the revised 2013 World Health Organization (WHO) guidelines, raising the CD4 count threshold, and extending coverage to all pregnant or breastfeeding HIV-infected women as well as tuberculosis patients [8]. However,
maximizing the potential benefits of ART requires appropriate selection of drug regimens and early identification of drug resistance [9]. With more than 9.7 million people receiving ART in low- and middle-income countries, 7.5 million of whom live in sub-Saharan Africa, the issue of how to appropriately monitor patients is now an urgent international issue [10-13]. Effective and acceptable treatment monitoring strategies in these settings remain unclear.
and adherence counseling that may result in improved pill-taking behavior and viral resuppression [25, 26]. Distinguishing between modifiable poor adherence and ART resistance is critical to reduce the spread of resistance and to increase the effectiveness of second-line therapies in the absence of resistance testing.
Only a fraction of the millions of African patients receiving ART have routine VL monitoring [27, 28]. Traditional VL tests used in developed countries are prohibitively expensive and too complex for routine use in sub-Saharan Africa [29]. Point-of-care (POC) VL tests that meet the ASSURED criteria (Affordable, Sensitive, Specific, User-friendly, Rapid and robust, Equipment-free, and Deliverable to end-users) are currently being evaluated [30], and may eventually transform the delivery of HIV care in resource-limited settings [31]. However, effective and affordable POC technologies are not yet available. The use of dried blood spots (DBS) for specimen collection and subsequent transport for testing at a centralized laboratory has emerged as an appealing alternative. By simplifying blood collection and specimen transport, as well as enabling longer-term storage of blood samples, DBS alleviates technological and cold-chain barriers, expanding access to VL monitoring in more remote settings [32-34], improving identification of ART failure [35, 36]. However, effectiveness of VL monitoring using DBS outside of controlled clinical trial settings is unknown.
with patient education and counseling. Unanticipated benefits of VL testing are also important, including provider engagement in care given new monitoring tools, and
empowering providers to make informed and timely regimen decisions based on previously-unavailable laboratory-based results.
Successful and sustainable scale-up of VL monitoring requires greater
understanding of DBS technology limitations and provider-perceived challenges, and must consider opportunities to strategies to improve efficiency in identifying failing patients. Additional information about rates of virological failure among previously unmonitored ART patients will be essential to guide VL monitoring policy and roll-out. This dissertation assesses the programmatic and clinical outcomes from a real-world evaluation of DBS use for VL monitoring in the sub-Saharan African context, and examines barriers to
implementation and optimization of VL monitoring in resource-limited settings. Specific aims include:
Aim 1: Evaluate the feasibility and effectiveness of using dried blood spots for viral load monitoring among ART patients in district hospitals in Malawi
DBS are an enticing alternative to traditional plasma-based VL monitoring strategies, potentially improving access to virological monitoring to ART patients in more remote
receiving VL results. I evaluated differences in characteristics between participants who are suppressed (<5,000 copies/ml) and those participants with elevated (>5,000 copies/ml) VLs using independent group t-tests (continuous variables) and Pearson's chi-squared tests (categorical variables). I investigated the association between ART history, participant characteristics, and virological failure (baseline VL >5,000 copies/ml) using logistic
regression. Finally, I examined rates of virological resuppression among participants with an elevated VL at baseline.
Aim 2: To evaluate antiretroviral therapy provider acceptability and perceived benefits of and barriers to use of dried blood spots for virological monitoring in district
hospitals in Malawi
Understanding provider acceptability regarding use of DBS for VL monitoring is essential to eventual successful implementation. Effective VL monitoring using DBS depends not only on accuracy of DBS as compared to the referent standard of plasma, but also on the willingness and ability of providers to identify patients who are eligible for VL testing. Furthermore, providers must be able to successfully collect specimens and complete necessary documentation. The evaluation of use of DBS for VL monitoring therefore
encompasses the identification of eligible ART patients, feasibility of DBS specimen
preparation, completion of documentation to link DBS cards to the ART patient, timely return of results once available, and making appropriate clinical decisions in terms of switching patients to second-line therapy.
to adherence counseling. I also evaluated basic participant descriptors including number of years in their current position and the highest level of certification/education.
Qualitative data was organized and managed in Atlas.ti. Transcribed interviews were read to identify major concepts, potential codes, and additional central themes. Analysis of the coded data included an investigation of frequency of codes across participants, and mapping of codes and themes. I selected quotes that illustrated key findings relevant to the research question of VL from DBS implementation barriers and provider-perceived benefits.
Aim 3: Develop a predictive model to identify patients with resistance from a single elevated VL result.
Adherence counseling will be effective only for patients without resistance mutations. Delaying treatment changes for patients who are resistant to 1st-line ART increases his or her chances of transmitting resistant virus to a sexual partner and may reduce
responsiveness to second-line ART once switched. Appropriate identification of patients who would benefit from immediate change in therapy is critical. I conducted a retrospective analysis using data from AIDS Clinical Trials Group (ACTG) 5175 trial conducted at sites around the world, including sub-Saharan Africa. Using these data, I developed a predictive model and associated risk score to distinguish patients with elevated VL secondary to biological resistance from patients for whom improved adherence may result in viral suppression. By developing and validating a risk score to distinguish resistance from
inadequate adherence, the results of this study may improve the efficiency of VL monitoring and facilitate provider decision-making regarding regimen switches at the point of initial elevated VL, negating the costs and delays associated with the currently-required
Dissertation Outline
The dissertation is organized as follows: Chapter 2 outlines the current
CHAPTER 2: BACKGROUND HIV burden and expanding ART access in sub-Saharan Africa
Sub-Saharan Africa remains the region most heavily burdened by the HIV/AIDS epidemic, accounting for 71% of all persons living with HIV, 71% of all new HIV infections, and 73% of all AIDS-related deaths [13]. Although the rate of new infections in the region has slowed, the total number of persons living with HIV continues to increase as more people access life-extending ART. Nearly 12 million persons receive ART in low- and middle-income countries, nine million of whom live in sub-Saharan Africa (Figure 2.1) [37, 38]. Recently revised ART guidelines expand treatment eligibility, potentially leading to more than 20 million HIV infected persons on ART in Africa alone [13]. Identifying appropriate ART monitoring strategies in resource-limited settings is an urgent global health priority [10, 12, 13, 39-41].
Patient and public health benefits of ART
The morbidity and mortality benefits to the individual on ART are well known [42-47]. ART suppresses viral replication, preserving cell-mediated immune response and reducing incidence of opportunistic infections. Recognized benefits of ART spurred widespread implementation in some of the highest HIV-burdened settings, most notably through the joint WHO and UNAIDS “three by five” initiative, setting the goal of having three million persons on ART by 2005 [48].
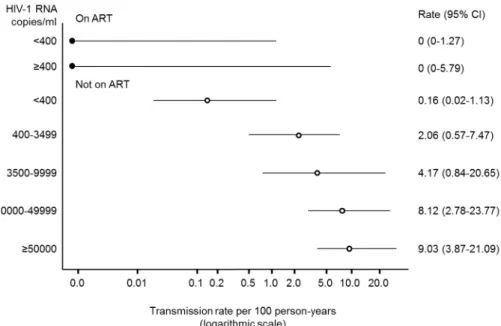
ART also has important public health benefits. ART use is a promising HIV prevention opportunity, with well-managed therapy resulting in a 96%-reduction in
with HIV concentration in body fluids (blood and genital fluids) (Figure 2.2) [49-51].
Treatment as prevention has gained traction with policy makers, with recent ART guidelines strongly advocating ART use in serodiscordant couples [8]. Importantly, both the individual and public health benefits of ART use are contingent upon the individual being virologically suppressed.
doses is generally necessary to achieve virological suppression and to delay progression to AIDS [53, 54], though this threshold may be lower with the addition of non-nucleoside reverse-transcriptase inhibitors (NNRTI) or boosted protease inhibitor regimens [55]. Exposure to therapeutic agents without adequate adherence increases the risk of developing resistance and subsequent treatment failure. Sub-optimal drug levels due to inadequate adherence create selective pressure facilitating viral replication and mutation, potentially propagating the spread of resistant strains [53, 55].
In the event that the elevated VL is due to ART resistance, failure to switch patients to second-line therapy in a timely manner increases morbidity and mortality, the likelihood of second-line treatment failure, and transmission of resistant virus [14, 15, 17-19, 22-24, 56-58]. The objective of ART monitoring is to identify persons who are failing treatment, either due to modifiable adherence behavior or to resistance. Adequate, efficient, and cost-effective ART monitoring will be increasingly critical to sustain and eventually to improve long-term treatment outcomes as ART use expands.
Focus on Malawi
Malawi is among those countries hardest hit by the HIV pandemic with recent adult prevalence estimates >10% [59]. In 2003, in coordination with the WHO’s three-by-five Initiative, Malawi initiated a government-sponsored
ART program [60, 61]. Under this program, limited first- and second-line ART combination regimens are available free of charge through the public sector, or subsidized through the private sector [62, 63]. As of September 2013, more than 450,000 HIV-infected patients in Malawi were receiving ART, representing nearly three-quarters of all ART-eligible HIV-infected
ART monitoring
VL testing is the preferred method for monitoring ART to identify potential adherence problems and treatment failures [8]. With VL monitoring, failing patients are identified
sooner, facilitating earlier treatment switches [9, 20, 22, 57, 66-68]. Additionally, the
avoidance of premature switching (i.e., switching a patient to second-line therapy when she or he is not actually failing line therapy) prevents the loss of potential life-years on first-line therapy and the costs associated with having patients on more expensive, complicated second-line regimens [69]. These concerns are especially relevant in resource-limited settings where third-line options are not widely available.
Unfortunately, numerous barriers prevent widespread implementation of VL testing in resource-limited settings. Traditional VL tests used in developed countries are prohibitively expensive and complex for routine use in resource-limited settings, such as sub-Saharan Africa [29]. VL tests cost approximately $30 per test, four to five times the cost of CD4 testing and much higher than the ~$1 for the widely-used HIV antibody test [70]. The VL testing platform can cost upwards of $250,000, including installation and training. VL testing also requires laboratory infrastructure for plasma processing, phlebotomy-trained providers, highly-trained laboratory personnel, and a continuous cold-chain to keep necessary
specimens and reagents refrigerated [29]. Despite VL testing being widely accepted as an effective means of monitoring patients on therapy, its costs will need to decrease to meet acceptable cost-effectiveness thresholds for widespread implementation.
the absence of these tools and resources, patients are monitored mainly through clinical staging criteria, with immunological monitoring (i.e., CD4 counts) available in only a few clinical centers of excellence. Unfortunately, the sensitivity of both immunological and clinical staging for identifying treatment failure is highly variable and generally low (Table 2.1), and thus the utility of these approaches in driving treatment decisions has been mixed [16, 22, 72-84]. Specificity, or our ability to correctly identify persons who are not failing, is also variable with the different monitoring approaches. In general, evaluations of alternative monitoring strategies demonstrate high negative predictive values (i.e., a high probability that a person identified as “not failing” is in fact not failing therapy), but extremely low positive predictive values (i.e., a low probability that a person who is failing will be identified as “failing”). Without access to VL information, the rate of treatment failure misclassification is unacceptably high.
Rates of virological failure in sub-Saharan Africa range from 6% to 53%, depending on failure threshold, clinical setting, and ART exposure time [57, 85-92]. Pooled estimates from low- and middle-income countries suggest that 16% of ART patients fail by 12 months of ART exposure [90]. With only 2% of patients in sub-Saharan Africa on second-line regimens, the rate of treatment misclassification, namely missing patients who are failing first-line ART, is substantial [52].
Consequences of treatment failure misclassification
Serious consequences are associated with misclassification (i.e., a false positive or false negative evaluation of ART response). Prolonged exposure to ineffective drugs decreases ART efficacy, reduces effectiveness of second-line ART, and increases
virologically suppressed may be associated with increased risk of subsequent virological failure on second-line therapy [93].
Second-line combination therapy options are expanding in resource-limited settings, now including two different fixed dose drug combination options, but alternatives are still extremely limited (Table 2.2 and Table 2.3). The cost of second-line options are declining with more competitive country-specific contracting, but drugs remain significantly more expensive than first-line options—up to ten times the cost per patient [65, 69]. Once a patient has been switched to second-line therapy, return to first-line ART is not possible. Third-line therapy options are not commonly available in sub-Saharan Africa.
Delaying treatment changes for patients failing first-line ART increases morbidity and mortality [29, 58, 94, 95] and may lead to accumulation of resistance mutations that
compromise second-line ART response [14, 15, 17, 23, 24]. Failure to identify treatment failure using either immunological (i.e., CD4 count) or clinical criteria is associated with significant resistance to both nucleoside reverse transcriptase inhibitors (NRTI) and NNRTI [14]. Furthermore, severe immunosuppression at time of second-line treatment initiation, as seen with delayed identification of treatment failure, may be associated with increased mortality [17].
VL monitoring and adherence
In addition to identifying failing patients sooner compared to alternative ART
first-line ART. VL information, coupled with adherence counseling, may improve virological outcomes [25]. Motivators and facilitators to adherence may be fundamentally different when patients are confronted with a test result that suggests increasing disease severity and treatment failure. For example, the most frequently identified factors associated with non-adherence include symptoms and drug side effects, lack of social support, complexity of the drug regimen, and low patient self-efficacy [96-101]. VL monitoring provides information that may directly or indirectly influence patient self-efficacy.
Virological suppression and the associated improved ART outcomes for the
individual are necessary to achieve the full potential public health benefits of ART. Whether it is through resuppression due to reinforced adherence messages or earlier identification of virological failure and faster switch to second-line therapy, VL monitoring is key if treatment as prevention is to be realized outside of the controlled clinical trial setting. Indeed, in settings where routine VL monitoring is not available, ART as a tool for preventing transmission within serodiscordant couples may be less effective [102].
Virological monitoring in resource-limited settings: where do we go from here?
Dried blood spots an appealing alternative to traditional VL technologies
The use of DBS for specimen collection and subsequent transport to centralized testing laboratories has emerged as an appealing alternative to traditional, plasma-based VL testing [8, 32, 33, 35, 119-126]. In addition to alleviating the technological and cold-chain barriers for VL testing in more remote clinics, alternative DBS specimen collection options, such as fingerstick rather than venipuncture, could decrease associated costs by permitting task-shifting to lower-level providers and reducing consumable-associated expenses. Fingerstick specimen collection options also may expand monitoring capacity to health centers without phlebotomy capabilities [120]. Indeed, DBS collected from fingerstick by non-laboratory personnel compares well to both venous DBS as well as plasma for identifying virological failure [119].
Notwithstanding the potential advantages of DBS, the feasibility of routine VL
monitoring from DBS in ART clinics in sub-Saharan Africa has not been assessed outside of controlled studies. Furthermore, the effectiveness of using DBS for VL monitoring in real-world settings, specifically if eligible patients are appropriately switched to second-line therapy, remains unknown.
Front-line ART providers key to successful virological monitoring implementation
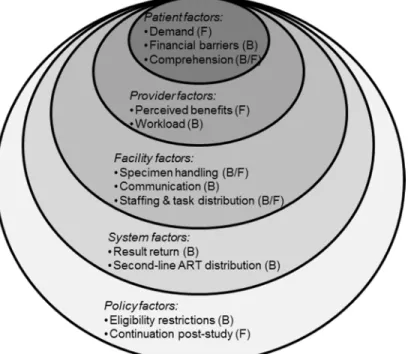
Understanding the barriers and facilitators of VL monitoring roll-out in resource-limited settings is essential for sustained programmatic success. The social ecological model (SEM) offers an inclusive perspective of factors that influence behaviors, facilitating comprehensive examination of individual and environmental circumstances that affect health [129-131]. A modified SEM framework incorporates patient, provider, facility, system, and policy factors, providing a holistic approach to understanding the barriers and facilitators of incorporating VL monitoring from a provider perspective (Figure 2.6).
More efficient monitoring: distinguishing resistance from modifiable adherence behavior
Distinguishing patients with modifiable poor adherence without resistance mutations from patients with resistance, for whom improved adherence will not result in viral
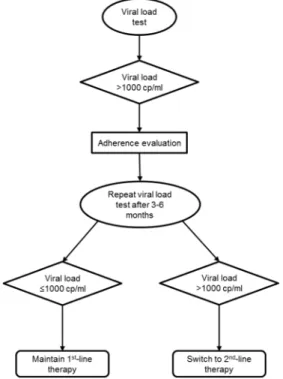
resuppression, is critical to reduce the spread of resistance and improve effectiveness of second-line therapies. Current VL monitoring algorithms require confirmatory testing in the event of an elevated initial test – a two-step process that includes adherence counseling to improve pill-taking behavior and possibly to facilitate virological resuppression (Figure 2.4) [8]. However, for patients with resistant virus, requiring a second test unnecessarily
postpones the treatment switch. The delays introduced with confirmatory testing are especially relevant for ART patients in resource-limited settings: programmatic obstacles and patient-related barriers (e.g., travel distance to clinic) may substantially increase the interval between baseline and confirmatory testing. Among patients with confirmed
virological failure in South Africa, switch to second-line therapy took longer than five months from the point of confirmatory VL to treatment switch [85, 91]. Equally complex and
considerably more expensive than traditional VL monitoring techniques, ART resistance testing is rarely available in resource-limited settings.
may help providers identify patients with probable ART resistance who could be switched to second-line therapy immediately without a confirmatory test. Applying a risk score with high specificity may result in meaningful public health benefits. Assuming virological suppression once on the appropriate second-line regimen, rapidly switching patients with resistance to more efficacious second-line therapy could reduce transmission of resistant viral strains and transmission overall.
Use of a risk score to distinguish patients with elevated viremia and resistance mutations from those patients without resistance mutations may not only facilitate faster switch to appropriate second-line regimens, but also may save scarce resources by avoiding unnecessary confirmatory testing. Applying a conservative estimate of treatment failure (16.0% at 12 months) would translate to more than one million ART-taking patients having an elevated VL in sub-Saharan Africa alone [90]. Even a modest reduction in confirmatory test volume as would be facilitated by use of a risk score could substantially reduce expenditures.
Point-of-care technology: horizon and obstacles
POC VL tests may be the key for scale-up of VL testing in resource-limited settings [133]. POC tests that meet the ASSURED criteria (Affordable, Sensitive, Specific, User-friendly, Rapid and robust, Equipment-free, and Deliverable to end-users) are currently being evaluated [30, 134]. Briefly, POC tests are diagnostic tools that can be used at clinics by providers and allow for same-day delivery of results, often within an hour. These
Scale-up of POC diagnostics has become a priority for many countries, including the Malawian Ministry of Health (MOH), which has convened a task-force to evaluate potential technologies targeting HIV monitoring and diagnostic tools [135]. The guidelines in
development by this task force identify numerous potential positive impacts of widespread implementation of POC testing, including: (1) ease-of-use, (2) long shelf-life, (3) potential increases in patient retention on ART (using CD4 POC tests), (4) reduced need for costly and logistically challenging specimen transport, (5) task-shifting away from over-burdened laboratory technicians, and, (6) improvements in patient outcomes by enabling health workers to make treatment decisions in a more timely manner. POC testing helps overcome the poor adaptation of technologies originally created for developed countries, technologies that require complex specimen transportation, progressive laboratory infrastructure, and advanced patient tracking systems.
POC testing is unlikely to replace centralized testing and DBS in the near future, but these technologies could eventually facilitate VL testing expansion to more remote settings. Two products are identified in the current technology pipeline as likely to be launched in 2014 [70]. Insufficient funding and technological challenges continue to impede their release. Nonetheless, continued emphasis on VL monitoring, by funding agencies and international ART management guidelines, may expedite the introduction of these devices.
Significance and contribution
Maximizing the morbidity and mortality benefits of ART, as well as the public health potential of treatment as prevention, requires routine assessment of a patient’s response to treatment. VL monitoring identifies patients who are failing sooner and is the preferred monitoring approach for both resource-wealthy and resource-limited settings. However, virological monitoring for HIV-infected persons on ART in sub-Saharan Africa has historically been overshadowed by the need for urgent scale-up of ART access. Efficient and feasible VL monitoring strategies will be increasingly critical to improve long-term treatment
outcomes as ART use continues to expand.
DBS for VL monitoring, our study uncovers important multilevel motivators and obstacles that should be addressed by policymakers looking to scale-up VL monitoring.
Our study also identified opportunities to improve efficiency of VL monitoring by identifying patients with resistance among those patients with high VLs. Patients with
resistance who are not switched to appropriate second-line regimens in a timely manner are at increased risk of poorer outcomes and are more likely to transmit resistant virus. The requirement of confirmatory testing in current VL monitoring algorithms may unnecessarily delay treatment switch, particularly for patients in resource-limited settings where
programmatic obstacles and patient-related barriers could further increase the interval between baseline and confirmatory VL testing. By developing a risk score using only variables routinely available in resource-limited settings, our study may help to reduce delays for patients with resistance to first-line ART. The cost of VL testing will remain a barrier to widespread implementation for the foreseeable future – especially as the number of patients on ART increase and, with it the demand for VL testing. Use of the risk score also could have economic advantages, avoiding unnecessary confirmatory testing expenses.
Table 2.1: Precision of WHO clinical and immunologic criteria in identifying treatment failure in resource-limited settings.
Report Setting Patients (n) Virological failure definition (copies/ml) Prev (%) Sens (%) Spec
(%) PPV NPV ART-LINC
[72, 136] Multi-site
2009 VL >10,000 3.1 17 97.1 9.5 98.5
Chaiworth et al. [74]1
Thailand 327 VL>50 10.7 10 95.6 25 91.6
Lynen et al. [137]
Cambod ia
764 VL >1,000 8 29 90 12 96
Mee et al. [16]
South Africa
324 VL <10,000 or VL>1,000 or two VL>400
10 33 86 21 92
Meya et al. [77]
Uganda 496 VL >1,000 8 31 87 16 94
Moore et al. [138]
Uganda 39 VL ≥ 500 NA* 8 98 16 96
Palombi et al. [139]2
Multi-site
158 VL >10,000 NA 73.6 30.2 NA NA
Reynolds et al. [79]
Uganda 1133 Two VL >400 11 23 90 14 94
1Presenting values for calculated values based on assessment with clinical criteria alone; 2Treatment switches were
confirmed with virological testing, helping to explain the significantly increased sensitivity observed in this study. *Study analyzed only subjects with elevated viral load after 12 months
NA, not applicable; NPV, negative predictive value; PPV, positive predictive value; Prev, prevalence of immunologic failure; Sens, sensitivity; Spec, specificity; VL, viral load; WHO, World Health Organization
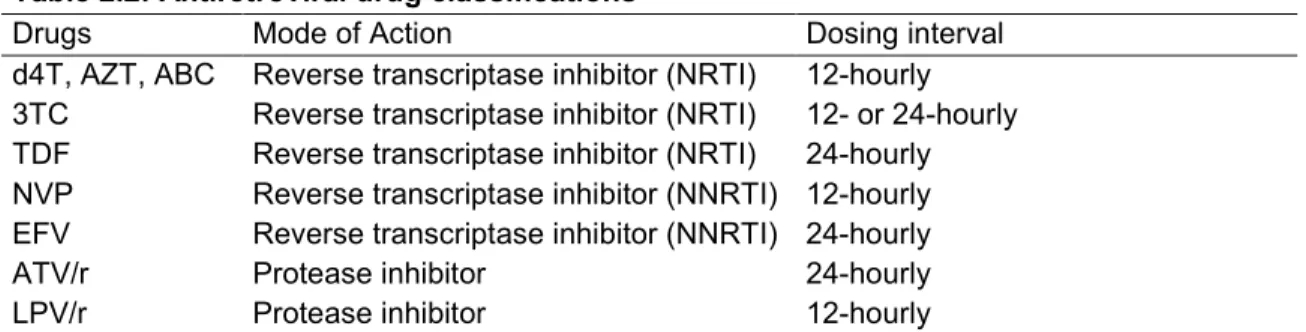
Table 2.2: Antiretroviral drug classifications
Drugs Mode of Action Dosing interval
d4T, AZT, ABC Reverse transcriptase inhibitor (NRTI) 12-hourly 3TC Reverse transcriptase inhibitor (NRTI) 12- or 24-hourly TDF Reverse transcriptase inhibitor (NRTI) 24-hourly NVP Reverse transcriptase inhibitor (NNRTI) 12-hourly EFV Reverse transcriptase inhibitor (NNRTI) 24-hourly
ATV/r Protease inhibitor 24-hourly
LPV/r Protease inhibitor 12-hourly
Table 2.3: Standard ART regimens in Malawi1
Adult Formulation
Contraindications Possible Adverse Events
Standard First-line ART (initiation) ABC 600mg/
3TC 300mg & NVP 200mg
• ABC hypersensitivity • Jaundice/hepatitis
• Fever, body pains, vomiting, cough2 • Hepatitis
• Skin rash • Lipodystrophy • Lactic acidosis d4T 30mg/
3TC 150mg/ NVP 200mg
• Jaundice/hepatitis • Neuropathy • Hepatitis • Skin rash • Lipodystrophy • Lactic acidosis AZT 300mg/
3TC 150mg/ NVP 200mg
• Anemia < 8g/dL • Jaundice/hepatitis
• Anemia • Hepatitis • Skin rash • Lipodystrophy • Lactic acidosis
TDF 300mg/ 3TC 300mg/ EFV 600mg
• History of psychiatric illness • Renal failure
• Child under 12 years
• Renal failure • Hepatitis • Skin rash
• Psychiatric disorder
Alternative First-line ART d4T 30mg/
3TC 150mg & EFV 600mg
• History of psychiatric illness • Neuropathy • Hepatitis • Skin rash
• Psychiatric disorder • Lipodystrophy • Lactic acidosis AZT 300mg/
3TC 150mg & EFV 600mg
• Anemia (hemoglobin < 8g/dL) • History of psychiatric illness
• Anemia • Hepatitis • Skin rash
• Psychiatric disorder • Lipodystrophy • Lactic acidosis TDF 300mg/
3TC 300mg & NVP 200mg
• Jaundice/hepatitis • Renal failure
• Child under 12 years
• Renal failure • Hepatitis • Skin rash Second-line ART3
TDF 300mg/ 3TC 300mg & ATV/r 300/100
• Renal failure
• Child under 12 years
• Renal failure • Nausea/vomiting • Jaundice
AZT 300mg/ • Anemia < 8g/dL • Anemia
Table 2.3: Standard ART regimens in Malawi1
Adult Formulation
Contraindications Possible Adverse Events
3TC 150mg & ATV/r 300/100
• Jaundice
Third-line Currently available only through clinical studies.
3TC, Lamivudine; ART, antiretroviral therapy; ATV/r, Atazanavir/ritonavir; AZT, Zidovudine; d4T, Stavudine; EFV, Efavirenz; LPV/r, Lopinavir/ritonavir; NPV, Nevirapine; TB, tuberculosis; TDF, Tenofovir
1Adapted from Malawi Ministry of Health ART guidelines[140], 2Symptoms indicative of potential life-threatening
ABC hypersensitivity, 3Patients with pre-existing jaundice or suspected hepatitis should be started on
Figure 2.1: Number of people receiving antiretroviral therapy in low- and middle-income countries
Figure 2.2: Relationship between VL and transmission
Caption: Figure 2.2: In a systematic review of studies assessing transmission within
Figure 2.3: Cascade of HIV treatment for adults (≥15 years old) in sub-Saharan Africa
Figure 2.4: WHO VL monitoring algorithm
Caption: Figure 2.4: The WHO recommends, where feasible, use of VL monitoring to replace immunological and clinical criteria [8]. Adherence counseling and confirmatory testing are incorporated into the algorithm to minimize inappropriate second-line switches and preserve first-line options. Importantly, the 1,000 copy/ml (cp/ml) threshold is specified for plasma-based evaluations, appreciating that alternative thresholds may be more
Figure 2.5: World Health Organization VL Monitoring Scale-up
Figure 2.6: Modified social ecological model framing barriers and facilitators of virological monitoring implementation
CHAPTER 3: METHODS Overview and study design
This study comprises three distinct studies, each of which utilize different data sets and methodologies but all of which address the same fundamental research question: how can we design and implement effective, efficient, and feasible VL monitoring strategies in resource-limited settings? Methods for each aim are presented below.
Aim 1: Evaluate the feasibility and effectiveness of using dried blood spots for viral load monitoring among ART patients in district hospitals in Malawi
Study population
We enrolled adult (≥18 years) patients from five ART clinics in central and southern Malawi. Inclusion and exclusion criteria mirrored MOH eligibility criteria for routine and targeted VL monitoring [65]. Patients were eligible for VL testing if they were on first-line ART for 6 months, 24 months, or any 24-month period (+/- 3 months) thereafter (milestone-driven monitoring). Alternatively, patients who did not meet milestone criteria were eligible if they were on first-line therapy ≥6 months and showed signs of clinical failure (World Health Organization [WHO] Stage 3 or 4) (targeted monitoring). Patients were excluded if currently hospitalized, imprisoned, or involuntarily incarcerated in a medical facility.
Site selection and enrollment
During this validation period, all participants provided a venous and fingerstick sample from which a plasma sample, venous DBS (vDBS), and fingerstick DBS (fsDBS) were produced. Interim analyses demonstrated acceptable agreement between plasma, vDBS, and fsDBS [119], and upon expansion to the remaining three sites, participants received fsDBS only to simplify specimen collection procedures.
Sample collection and transport
Sample collection and virological testing methods are presented elsewhere [119]. Briefly, sites were provided with pre-packed kits containing: DBS card, capillary tubes, gloves, sterile lancet, alcohol swab, plastic zip bag, and desiccant. All specimens were collected by ART clinic or laboratory staff. Once dried, cards were transferred to individual zip bags with desiccant sachets and stored at room temperature.
DBS specimens were transported at ambient temperature to the central laboratory in Lilongwe (4-6 hours away) approximately weekly using existing hospital-based vehicles or shipped via specimen shipment service.
VL testing and result return
Specimens were tested using the Abbott RealTime HIV-1 Assay (Abbott
Laboratories, Chicago, IL) (reportable range of 40 to 10,000,000 copies/ml for plasma and lower limit of detection of 550 copies/ml for DBS). Testing was conducted at an
internationally monitored research laboratory.
Data collection
All activities were conducted by non-study ART clinic personnel. ART staff members were trained in identifying eligible participants, obtaining consent, specimen collection, study sensitization, adherence counseling, and case report form (CRF) completion. We collected participant demographics, clinical history, and ART adherence data (Appendix 1). ART history, including date of diagnosis, ART initiation, and reason for initiation, was abstracted from patient clinic records.
Study visits
Participants were asked to return for VL results one month after enrollment. Participants with elevated VLs (>5,000 copies/ml) were counseled on the importance of adherence and instructed to return after two months for a confirmatory draw. Participants who returned for confirmatory draws were told to return within one month for results. Providers were instructed to refer patients with two elevated VLs for second-line therapy.
Treatment failure definition
Per 2011 MOH guidelines, virological failure was defined as having two sequential VLs >5,000 copies/ml [65]. For patients with plasma results available (validation period), plasma results were used to guide treatment decisions. If vDBS and fsDBS were available, vDBS results were used; fsDBS was used for treatment decisions in all other cases.
Programmatic Outcomes
Primary outcomes were feasibility and effectiveness of DBS for VL monitoring. Feasibility was measured by: proportion of participants receiving VL results within 3 months of enrollment; laboratory testing turnaround time and associated delayed result return (participant seen at clinic but result unavailable); frequency of “provider misses” (participant seen at clinic but did not receive results despite being available at the clinic); proportion of participants with baseline elevated VL receiving confirmatory DBS; time from participant receipt of results to collection of confirmatory specimen; and time from enrollment to second-line treatment initiation among eligible participants. Participants were terminated from the study if results were not delivered ≥6 months of enrollment.
Effectiveness measures of DBS for VL monitoring included: proportion of participants who resuppressed (≤5000 copies/ml on confirmatory specimen) and proportion of eligible participants who initiated second-line therapy within 12 months (365 days) of enrollment.
Statistical methods
We used student’s t-tests (continuous variables) and Pearson's chi-squared or Fisher’s exact test (categorical variables) to identify demographics and clinical
statistics [143]. We conducted an post-hoc sub-group analysis exploring the relationship between CD4 cell count at ART initiation and treatment failure as this may be an important predictor of virological failure [85, 144, 145].
All analyses were performed using Stata (version 13.0; StataCorp, College Station, TX). P-values <0.05 were considered significant.
Ethical approval
The National Health Sciences Research Committee of Malawi, the Centers for Disease Control and Prevention Ethics Review, and the Biomedical Institutional Review Board at University of North Carolina, Chapel Hill approved this study. All participants provided written informed consent.
Aim 2: To evaluate antiretroviral therapy provider acceptability and perceived benefits of and barriers to use of dried blood spots for virological monitoring in district hospitals in Malawi
Parent study
Study Population
Between July 2013 and January 2014, we conducted in-person interviews with all providers who were involved in DBS study activities at each of the five enrolling clinics. Provider responsibilities ranged from retrieval of patient records to patient counseling and second-line ART referral. We identified providers via onsite point-persons–frequently a nurse who assumed additional study-related duties[147]. All providers agreed to participate and gave written informed consent.
Interview guide & conceptual model
We developed the interview guide to explore providers’ perceptions of the barriers and facilitators to implementing VL monitoring (Appendix 2). The interview guide
encouraged discussion and a flexible conversation about specimen handling, return of results to the clinic, and their overall reaction to VL testing activities. We used probing questions to explore emerging themes. All interviews were conducted in English by trained study staff and audio-recorded. Audio-recorded interviews were transcribed [147, 148].
Analysis
All transcripts were coded by the primary researcher (SER) using ATLAS.ti (version 7.0, ATLAS.ti Scientific Software Development GmbH, Berlin, Germany) [149]. A second coder (SH), independently coded 30% of transcripts. The two coders reviewed double-coded transcripts, and any differences in code application were resolved through discussion and negotiated consensus [148, 150].
themes emerged, we coded in more depth, revising and accumulating codes [153]. As new themes were added to the coding process, previously coded transcripts were reviewed to ensure coding logic completeness and consistency. The codebook was therefore a living document–adapting to the themes and concepts as they surfaced during analysis. When we completed the coding, we conducted a line-by-line analysis to ensure that all coded
transcripts reflected the final codebook [152].
The social ecological model (SEM) emerged as a useful perspective for evaluating the multilevel factors that influenced provider-reported barriers and facilitators of VL monitoring. The SEM facilitated a comprehensive examination of individual and
environmental circumstances that effected provider perceptions[129-131]. At its most basic level, the SEM considers two key concepts: 1) that behavior affects and is affected by multiple different levels, and 2) that individual behaviors are shaped by a larger social environment. Because our data had acquired a clear, multilevel nature reminiscent of the SEM, we grouped themes according to the five levels of the modified SEM framework: patient, provider, facility, system, and policy factors (Figure 3.2) [154]. These levels represent a contextual adaptation from the original SEM, which included intrapersonal, interpersonal, organizational, community, and public policy levels. We present illustrative representative quotes for each emergent theme. This strategy provides a holistic approach to understanding the barriers and facilitators of incorporating VL monitoring from a provider perspective
Ethical approval
Aim 3: Develop a predictive model to identify patients with resistance from a single elevated VL result
Study setting and population
We studied eligible participants enrolled in the Prospective Evaluation of
Antiretrovirals in Resource-Limited Settings (PEARLS) trial (Adult AIDS Clinical Trials Group (ACTG) A5175, NCT00084136). PEARLS was an open-label, Phase IV, randomized clinical trial that investigated efficacy and safety of once- vs. twice-daily regimen dosing. Details of the PEARLS study population and design have been described elsewhere [155]. In brief, A5175 enrolled 1,571 HIV-infected participants ≥18 years old from nine countries, over-sampling participants from resource-limited settings. Participants were excluded if they: had a CD4 cell count >300 cells/mm3, previous exposure to ART (with an exception for women who received ART for prevention of mother-to-child transmission), were pregnant, or were acutely ill and/or clinically unstable. PEARLS was approved by institutional review boards and ethics committees at participating institutions.
Our study is a secondary analysis of de-identified data among participants initiated on nucleoside reverse transcriptase inhibitor (NRTI)-based regimens and who had a VL ≥1000 copies/ml at any point after week 16 of study enrollment. The 16-week restriction was based on A5175 definitions of virological failure (two successive measurements of plasma HIV-1 RNA ≥1000copies/ml, with the elevated VL on or after week 16). Primary analyses included participants from all study sites, with a sensitivity analysis restricting the study population to participants enrolled from resource-limited settings. This analysis was
Amplicor Monitor assay [v1.5]) at least every eight weeks. Any treatment modification (participant, provider, or protocol-mandated) was assessed at each visit. Diagnosis criteria were collected using a standardized case report form.
Resistance tests were done retrospectively (Celera Diagnostics ViroSeq HIV-1 Genotyping Assay) on stored specimens for participants meeting virological failure criteria (defined below) or who had disease progression (new or recurrent AIDS-defining
opportunistic infection or malignancy) at least 12 weeks after randomization.
Measures
The outcome variable (resistance) was assessed using stored specimens collected at the time of confirmation of virological failure. Participants with NRTI or non-NRTI (NNRTI) resistance mutations, defined by 2008 International AIDS Society (IAS) guidelines, were classified as resistant [156]. Resistance testing was not done on participants who had a VL ≥1000 copies/ml and resuppressed (<1000 copies/ml) at their subsequent study visit. We classified any participant who resuppressed as not resistant. Participants who had two sequential study visits with VL ≥1000 copies/ml, but who did not have a resistance test, were excluded.
visit was similarly classified as any time after the six-month window up to and including 30 days after 12 months on ART (395 days).
Statistical analyses
All analyses were conducted using Stata statistical software (Version 13.0; Stata Corporation, College Station, TX).
We constructed three multivariable models to predict resistance; potential predictors included participant demographics, clinical diagnoses prior to ART initiation, immunological markers, self-reported adherence, and therapy duration prior to having an elevated VL. The three models reflect variations in availability of CD4 and VLs at time of ART initiation. WHO guidelines for ART monitoring suggests VL testing only occurs after a patient has been on ART for six months [8]. Although many countries have scaled up access to CD4 testing to determine ART eligibility, the roll-out of Option B+, in which HIV-infected pregnant women are initiated on lifelong ART regardless of CD4, could mean that many patients will not have a baseline CD4 cell count [8]. In light of these policies and the capacity constraints in
resource-limited settings, we constructed models to reflect three scenarios: Model 1
implementation were excluded from the models, regardless of p-value. We tested four categorizations of time on treatment and selected the category with the lowest Akaike’s information criteria (AIC) value for our reference models [160].
We developed the predictive models using multiple logistic regression with backward elimination [158]. Beginning with the variable with the largest p-value, we removed variables one at a time until five or fewer variables remained (regardless of p-value). The five-variable limit was selected to facilitate eventual implementation of risk scores in resource-limited clinical settings [161, 162]. We assessed the equality of the area under the receiver operating characteristic curves (AUROC) between each model (chi-squared test) [163]. AUROC is a measure of the risk score’s discriminatory power –where 1.0 indicates a perfect test (i.e., 100% sensitivity and 100% specificity) [164]. Likelihood ratio (LR) comparing successive models were evaluated to confirm that variable removal did not adversely affect the model’s predictive capacity. We also compared LR-test statistics from each reduced model to the full model.
We used the three predictive models to develop the associated risk scores by assigning each variable in the final models a predictor score equal to two times the beta coefficient rounded to the nearest integer. We doubled the coefficient to retain inherent discrimination between betas. Patients with a high VL (≥1000 copies/ml) and a risk score equal to or greater than a pre-specified cutoff are classified as likely resistant to first-line ART and should be switched to second-line ART without a confirmatory VL test. For each model, we assessed sensitivity, specificity, and associated risk scores at cutoffs selected based on clinically-acceptable model-performance criteria [165, 166]. Given the undesirable consequences of prematurely switching patients to second-line therapy, we maintained a high specificity threshold (>95.0%) for all models to minimize false positives. We also
and risk score performance using 1,000 bootstrap samples with replacement [158, 167]. Bootstrapping is preferred over data splitting and cross validation for the purposes of
internal validation [168-172]. Model calibration was assessed using Hosmer-Lemeshow (HL) goodness-of-fit tests [173].
Sensitivity Analyses
We conducted a sensitivity analysis to evaluate model performance using only study participants from resource-limited settings only. Given the implementation and policy
Figure 3.1: Dried blood spot (DBS) study flow
Caption: Figure 3.1: ART patients receiving care at enrolling clinics were briefed as to study purpose and eligibility during the morning education section. After identifying eligible patients, providers completed informed consent forms and study-specific case report forms for patient demographics, clinical history, and adherence. DBS specimens were collected and, after appropriate drying time, transported to the central laboratory in Lilongwe where specimens were tested. Results were returned to clinics using email, SMS and/or in-person hard-copy printouts. Patients were supposed to receive the results at their next visit. Each site was
encouraged to designate tasks and responsibilities to clinic personnel in a manner that suited existing clinic flow, patient volume, and staffing constraints. The provider interviews, the topic of this paper, occurred once the study procedures had begun at a given clinic.
4
Figure 3.2: Modified social ecological model conceptual framework
CHAPTER 4: AIM 1
Dried blood spots for viral load monitoring in Malawi: feasible and effective
Introduction
Viral load (VL) testing is the preferred method for monitoring antiretroviral therapy (ART) to identify potential adherence problems and treatment failures [8]. Compared to immunological (CD4 cell counts) or clinical staging, VL testing is more sensitive and specific for accurately diagnosing treatment failure, reducing premature or inappropriate switching to second line therapy [16, 68, 74, 79, 81, 138, 174, 175]. Delaying treatment changes for patients failing first-line ART increases morbidity and mortality [29, 58, 94, 95] and may lead to accumulation of resistance mutations that compromise second-line ART response [14, 15, 17, 23, 24]. With VL monitoring, failing patients are identified sooner, facilitating earlier treatment switches [9, 20, 22, 57, 66-68]. Additionally, the avoidance of premature switching prevents the loss of potential life-years on first-line therapy and costs associated with having patients on more expensive and complicated second-line regimens [69]. These concerns are especially relevant in resource-limited settings where third-line options are not widely available.
As recently revised ART guidelines expand treatment eligibility, potentially leading to >20 million HIV infected patients on ART in Africa alone, access to VL monitoring remains poor and identifying appropriate monitoring strategies in resource-limited settings is an urgent global health priority [10, 12, 13, 39]. The benefits of ART, specifically reducing transmission [7] and disease progression [53], are realized only if viral replication is
estimates from low- and middle-income countries at 12 months of ART exposure suggest 16% failure [90].
Despite the benefits of VL monitoring, numerous barriers impede widespread
implementation in resource-limited settings. Traditional VL tests used in developed countries are prohibitively expensive and complex for routine use in resource-limited settings because they require laboratory infrastructure for plasma processing, continuous cold-chain, and phlebotomy-trained providers [29]. Point-of-care technologies are under evaluation but are not yet available [31, 70].
The use of dried blood spot (DBS) for specimen collection and subsequent transport to centralized testing laboratories is an appealing alternative to plasma-based VL testing [8, 32, 35, 119-126]. Malawi is one of many countries attempting to incorporate VL monitoring from DBS into ART care [59, 64]. After 10 years of operation, <1% of Malawian ART patients are on second-line regimens [64], which may reflect providers’ relying primarily on clinical staging criteria to diagnose treatment failure and subsequent under-diagnosis of virological failure.
The feasibility of routine VL monitoring from DBS in ART clinics in sub-Saharan Africa has not been assessed outside of controlled studies. Furthermore, the effectiveness of using DBS for VL monitoring in real-world settings, specifically if eligible patients are appropriately switched to second-line therapy, remains unknown. In coordination with the Malawi MOH, we conducted a prospective, non-randomized evaluation of DBS for VL monitoring among ART patients managed at districts hospitals in Malawi.
targeted VL monitoring [65]. Patients were eligible for VL testing if they were on first-line ART for 6 months, 24 months, or any 24-month period (+/- 3 months) thereafter (milestone-driven monitoring). Alternatively, patients who did not meet milestone criteria were eligible if they were on first-line therapy ≥6 months and showed signs of clinical failure (World Health Organization [WHO] Stage 3 or 4) (targeted monitoring). Patients were excluded if currently hospitalized, imprisoned, or involuntarily incarcerated in a medical facility.
Site selection and enrollment
ART clinics within district hospitals were selected based on the size of their retained ART patient population and willingness to both train providers and enroll participants. We validated DBS vs. plasma VL at the two sites with adequate capacity for plasma-processing. During this validation period, all participants provided a venous and fingerstick sample from which a plasma sample, venous DBS (vDBS), and fingerstick DBS (fsDBS) were produced. Interim analyses demonstrated acceptable agreement between plasma, vDBS, and fsDBS [119], and upon expansion to the remaining three sites, participants received fsDBS only to simplify specimen collection procedures.
Sample collection and transport
Sample collection and virological testing methods are presented elsewhere [119]. Briefly, sites were provided with pre-packed kits containing: DBS card, capillary tubes, gloves, sterile lancet, alcohol swab, plastic zip bag, and desiccant. All specimens were collected by ART clinic or laboratory staff. Once dried, cards were transferred to individual zip bags with desiccant sachets and stored at room temperature.
VL testing and result return
Specimens were tested using the Abbott RealTime HIV-1 Assay (Abbott
Laboratories, Chicago, IL) (reportable range of 40 to 10,000,000 copies/ml for plasma and lower limit of detection of 550 copies/ml for DBS). Testing was conducted at an
internationally monitored research laboratory.
Results were returned to clinics using e-mail, short message service (SMS), or phone. Hard-copies of results were delivered via hospital vehicles returning to the clinic or by study coordinators during routine (approximately bi-weekly) site visits. Providers
delivered results to participants during scheduled clinic visits.
Data collection
All activities were conducted by non-study ART clinic personnel. ART staff members were trained in identifying eligible participants, obtaining consent, specimen collection, study sensitization, adherence counseling, and case report form (CRF) completion. We collected participant demographics, clinical history, and ART adherence data. ART history, including date of diagnosis, ART initiation, and reason for initiation, was abstracted from patient clinic records.
Study visits
Treatment failure definition
Per 2011 MOH guidelines, virological failure was defined as having two sequential VLs >5,000 copies/ml [65]. For patients with plasma results available (validation period), plasma results were used to guide treatment decisions. If vDBS and fsDBS were available, vDBS results were used; fsDBS was used for treatment decisions in all other cases.
“Undetectable” results (i.e., results below the platform’s lower limit of detection) were treated as having a value at the midpoint between 0 and the lower detection threshold (20 copies/ml and 275 copies/ml for plasma and DBS, respectively).
Programmatic Outcomes
Primary outcomes were feasibility and effectiveness of DBS for VL monitoring. Feasibility was measured by: proportion of participants receiving VL results within 3 months of enrollment; laboratory testing turnaround time and associated delayed result return (participant seen at clinic but result unavailable); frequency of “provider misses” (participant seen at clinic but did not receive results despite being available at the clinic); proportion of participants with baseline elevated VL receiving confirmatory DBS; time from participant receipt of results to collection of confirmatory specimen; and time from enrollment to second-line treatment initiation among eligible participants. Participants were terminated from the study if results were not delivered ≥6 months of enrollment.
Effectiveness measures of DBS for VL monitoring included: proportion of participants who resuppressed (≤5000 copies/ml on confirmatory specimen) and proportion of eligible participants who initiated second-line therapy within 12 months (365 days) of enrollment.
Statistical methods
characteristics associated with VL failure and resuppression (≤5000 copies/ml) [141]. We used generalized linear models with a log link and binomial distribution to explore the relationship between time on ART and VL failure (>5000 copies/ml) at enrollment [142]. Factors considered included age, sex, WHO clinical stage at ART initiation, body mass index (BMI), ART regimen, self-reported adherence, and clinical symptoms. We used likelihood ratio (LR) tests to decide which variables to include. We tested interactions
between time on ART and symptoms at enrollment to asses if the effect of ART exposure on likelihood of treatment failure was different for participants who showed signs of clinical failure. We evaluated agreement of time on ART (clinic records versus CRFs) using kappa statistics [143]. We conducted an post-hoc sub-group analysis exploring the relationship between CD4 cell count at ART initiation and treatment failure as this may be an important predictor of virological failure [85, 144, 145].
All analyses were performed using Stata (version 13.0; StataCorp, College Station, TX). P-values <0.05 were considered significant.
Ethical approval
The National Health Sciences Research Committee of Malawi, the Centers for Disease Control and Prevention Ethics Review, and the Biomedical Institutional Review Board at University of North Carolina, Chapel Hill approved this study. All participants provided written informed consent.
Results
monitoring” criteria. Approximately one quarter (338, 22.8%) had at least one clinical symptom. Only 524 (35.0%) had a quantitative CD4 recorded when initiating ART (mean 187 cells/mm3). Nearly three-quarters (1,067, 71.3%) of participants reported 100%
adherence over the last 30 days and 1,261 (84.5%) reported 100% adherence over the last week. Pill count was only available for 229 (15.3%) participants, according to which ART adherence was 99.2%.
Baseline virological failure
Nearly all participants (1,406, 94.1%) were virologically suppressed at baseline (≤5000 copies/ml) (Table 4.1). Compared to participants with suppressed VLs, participants with elevated VLs were younger (37.3 vs 42.4, p<0.01). Sex, BMI, self-reported perfect adherence within the past 30-days or week, and proportion with clinical symptoms were similar across suppression status. Median VL among participants failing at baseline was 30,329 copies/ml [IQR: 16,483-102,029].
Resuppression
Among 78 persons with a confirmatory VL, 24 (30.8%) resuppressed (Figure 4.1, Table 4.2). Compared to participants who did not resuppress, participants who
resuppressed had longer periods between receipt of baseline results and confirmatory testing (median 81.5 vs 60 days, p<0.01). Participants who resuppressed has slightly lower baseline VL than those who did not resuppress (23,167 copies/ml vs 32,562 copies/ml, p=0.06). Rates of resuppression varied by enrolling clinic – ranging from 16.7% to 56.3% - although the differences were not significant according to Fisher’s exact test (p=0.13).
Programmatic Outcomes
from care, and 89 were terminated from the study prior to receiving results, if they had been enrolled ≥6 months without being given results. Four participants did not have VL results because of failed redraw attempts (n=3) or ineligibility at enrollment (n=1). Patients that were terminated from the study without receiving results were enrolled an average of 195 days (range: 179-322).
Effectiveness: Nearly one-third (30.8%, 24/78) of participants with an elevated VL at baseline resuppressed. Among participants with a confirmed elevated VL, 92.6% (50/54) initiated second-line therapy. Over 90% (49/54) of participants who were confirmed as eligible for second-line therapy were switched within 365 days of their first elevated VL; over half (31/54) were switched within 180 days. If we assume that the 4 participants who were switched before confirmatory VLs would not have resuppressed, 91.4% (53/58) of
participants reached the primary effectiveness endpoint—initiating second-line therapy within 12 months of enrollment.
Logistic Regression
We used time on ART as documented in patient clinic records (Kappa statistic comparing time on ART on CRFs vs. clinic records =0.89). After adjusting for time on therapy, clinical symptoms, sex, WHO stage at initiation, and self-reported adherence, increasing age was associated with decreased risk of failure (RR 0.95, 95% confidence interval (CI) 0.92-0.98) (Table 4.3). Participants on ART >4 years were 1.7 times more likely to fail compared to participants on therapy 1-4 years (RR 1.70, 95% CI 1.01-2.84);
participants on ART ≤1 year were less likely to be failing (RR 0.57, 95% CI 0.18-1.83), although the association was not statistically significant.