IDENTIFICATION OF REGULATORY ELEMENTS AND FUNCTIONAL VARIANTS AT GWAS LOCI FOR HUMAN METABOLIC TRAITS
Tamara S. Roman
A dissertation submitted to the faculty at the University of North Carolina at Chapel Hill in partial fulfillment of the requirements for the degree of Doctor of Philosophy in the Curriculum of Genetics and Molecular
Biology in the School of Medicine.
Chapel Hill 2016
ABSTRACT
Tamara S. Roman: Identification of regulatory elements and functional variants at GWAS loci for human metabolic traits
(Under the direction of Karen Mohlke)
Cardiovascular disease (CVD) and type 2 diabetes (T2D) are major public health burdens in the United States. Metabolic risk factors for these diseases include increased triglyceride levels, decreased high-density lipoprotein cholesterol levels (HDL-C), and increased waist-hip ratio (WHR, a measure of body fat distribution). Genome-wide association studies (GWAS) have identified hundreds of loci for human metabolic traits and diseases. For many of these loci, the molecular and biological mechanisms are unknown. Many association signals are located in non-coding regions of the genome, and some of the associated variants are located within regulatory elements. Due to linkage disequilibrium, the GWAS identified variants may serve as proxies for the true functional variants. Functional follow-up studies are necessary to identify the functional variant(s) at a locus, determine the target gene(s) and mechanisms for how the variants and genes influence metabolic traits.
I identified functional regulatory variants and elements at three GWAS loci for metabolic traits. At the GALNT2 locus for HDL-C, at least two regulatory variants demonstrated allelic differences in
transcriptional enhancer activity and transcription factor binding. The alleles associated with increased HDL-C demonstrated increased GALNT2 expression in human hepatocytes and subcutaneous adipose tissue samples. At the ADCY5 locus for T2D and glucose-related traits, I identified a regulatory variant located within an enhancer element in human pancreatic islets that exhibited allelic differences in enhancer activity, differential transcription factor binding, and allelic differences in regulatory H3K27ac ChIP-seq reads from human islets. The T2D risk allele showed lower ADCY5 expression in human islets. At the PLXND1 locus for WHR, I identified at least 4 enhancer elements in human umbilical vein
endothelial cells, one of which also showed enhancer activity in zebrafish endothelial cells.
ACKNOWLEDGEMENTS
Thank you to my advisor, Karen Mohlke, for giving me the opportunity to be a part of your lab and for all of your advice, guidance and teaching throughout my graduate career. I have learned so much from your strong science writing skills and strong ability to collaborate with others. I am grateful for my experiences while in your lab, including presenting my research at conferences and learning how to think more analytically about scientific questions and research. You have always been supportive of my career goals, and I thank you for providing me with great preparation for the next stage of my scientific career.
Thank you to my committee members, Praveen Sethupathy, Nobuyo Maeda, John Rawls and Ian Davis, for your helpful advice and feedback regarding my projects, taking the time to attend my committee meetings and for teaching me to think critically about my research. I am very appreciative to have all of you as members of my committee.
Thank you to all members of the Mohlke lab, past and present, for being such a great group of individuals to work with! You have all helped me to think about my research in different ways, aided my growth as a scientist and have always supported me with all aspects of graduate school. I am grateful for having such a positive and interactive work environment for the past several years.
Thank you to my collaborators for all of your guidance, advice, manuscript and abstract editing and contributions to my research. Many of the data supporting my experimental evidence highlighted in this dissertation would not have been possible without these smart and hard-working individuals. I have learned a lot from my interactions with collaborators and appreciate their fostering of a positive
collaborative environment.
ChIP-seq and DNase-seq reads. Thank you Jeroen Huyghe for fine-mapping and conditional analyses of METSIM data; Christian Fuchsberger for imputation of genotypes from METSIM data; Anne Jackson and Jeroen Huyghe for association analyses of lipid and lipoprotein particle-serum concentrations from the METSIM study; Ying Wu and Mete Civelek for performing eQTL analyses from subcutaneous adipose tissue samples from the METSIM study; Antti Kangas, Pasi Soininen and Mika Ala-Korpela for measuring and providing lipid and lipoprotein particle-serum concentrations from METSIM study samples and Aldons Lusis, Johanna Kuusisto, Markku Laakso, Francis Collins, Michael Boehnke and Karen Mohlke for contributing data and analyses from the METSIM study. Thank you Jennifer Kulzer, Marie Fogarty, Kyle Gaulton, Praveen Sethupathy, Mika Ala-Korpela, Francis Collins, Michael Boehnke and Karen Mohlke for editing the GALNT2 manuscript. I would also like to acknowledge the GoT2D Consortium for access to the reference panel used for imputation; human organ donors whose liver samples were used in the study; the ENCODE and NIH Roadmap Epigenomics Consortia, Data Analysis and Coordination Centers, and production laboratories that generated the chromatin, histone-modification, and
chromatin-immunoprecipitation (ChIP) sequencing data used for variant annotation. Thank you Terry Furey and Greg Crawford for interpretating ENCODE data, Yun Li and Qing Duan for providing 1000 Genomes linkage-disequilibrium data, Scott Bultman and Dallas Donohoe for providing advice on ChIP experiments and Sumeet Khetarpal and Daniel Rader for sharing unpublished results.
Chines, Mario Morken and Ying Wu for their contributions to data interpretation and/or editing of abstracts for this project.
Chapter 4 was a collaboration with Dr. John Rawls’ laboratory at Duke University. Thank you James Minchin for contributing to the experimental design of CREs and cloning of CREs into the EGFP vector for zebrafish transgenesis assays. Thank you James Minchin and Patrick Williams for performing zebrafish injections, visualizing GFP and mCherry expression on the fluorescence microscope and interpreting data for the zebrafish transgenesis assays. Thank you Kristin Young for assisting with site-directed mutagenesis of rs4488824 in CRE 13 in the gateway-compatible pGL4.23 luciferase reporter vector and purification of plasmids. Thank you Karen Mohlke, John Rawls and James Minchin for guidance and editing of PLXND1 project summaries, presentations and abstracts.
Thank you to The Integrative Vascular Biology Training Program (IVB) and the opportunity to be a trainee of this program. I have learned many skills throughout my time in IVB, including how to give presentations of my research to a broader audience and how to establish collaborations with other departments. I appreciate getting to know all of the professors and students that I shared the experiences of the program with.
TABLE OF CONTENTS
LIST OF TABLES ... xi
LIST OF FIGURES ... xii
LIST OF ABBREVIATIONS... xiv
CHAPTER 1: INTRODUCTION ... 1
1.1 Cardiovascular disease ... 1
1.2 Lipoproteins and cholesterol ... 1
1.3 Type 2 diabetes ... 2
1.4 Obesity and body fat distribution ... 2
1.5 Genetics of cardiometabolic traits ... 3
1.6 Identifying functional regulatory DNA variants from GWAS ... 3
1.7 Aims and overview ... 4
CHAPTER 2: MULTIPLE HEPATIC REGULATORY VARIANTS AT THE GALNT2 GWAS LOCUS ASSOCIATED WITH HIGH-DENSITY LIPOPROTEIN CHOLESTEROL ... 7
2.1 Introduction ... 7
2.2 Materials and Methods ... 8
2.2.1 Defining the candidate set of variants ... 8
2.2.2 Genotyping and imputation ... 9
2.2.3 Fine-mapping and conditional analyses ... 9
2.2.4 Cell culture ... 10
2.2.5 Transcriptional reporter assays ... 10
2.2.6 Electrophoretic mobility shift assays ... 11
2.2.7 ChIP assays ... 12
2.2.8 Allelic-imbalance analysis of sequence reads from CEBPB ChIP-seq and DNase-seq ... 13
2.2.10 AEI assays ... 14
2.2.11 GALNT2 hepatocyte mRNA expression ... 14
2.2.12 Lookup of expression quantitative trait loci in subcutaneous adipose tissue ... 15
2.2.13 siRNA-mediated knockdown of CEBPB ... 15
2.3 Results ... 16
2.3.1 Fine mapping shows evidence of a single association signal strongest for total cholesterol in medium HDL ... 16
2.3.2 Open-chromatin, histone-modification, and transcription-factor marks indicate potential regulatory elements overlapping the GALNT2 association signal ... 16
2.3.3 All 25 candidate regulatory variants were evaluated for allelic differences in luciferase activity ... 17
2.3.4 rs2281721 exhibits allelic differences in transcriptional activity ... 18
2.3.5 A segment containing rs4846913, rs2144300, and rs6143660 shows haplotype differences in transcriptional activity ... 18
2.3.6 The haplotype variants act together to regulate enhancer activity ... 19
2.3.7 USF1 binds to rs2281721 ... 20
2.3.8 CEBPB binds differentially to the alleles of rs4846913 ... 21
2.3.9 rs2144300, rs1555290, and rs6143660 also show suggestive evidence of protein binding ... 22
2.3.10 Variants associated with GALNT2 expression ... 22
2.4 Discussion ... 23
2.5 Conflicts of interest ... 27
ENDNOTES ... 69
CHAPTER 3: A FUNCTIONAL REGULATORY VARIANT ASSOCIATED WITH TYPE 2 DIABETES, FASTING GLUCOSE AND DECREASED ADCY5 EXPRESSION ... 70
3.1 Introduction ... 70
3.2 Materials and Methods ... 71
3.2.1 Lookup of expression quantitative trait loci in primary human islets ... 71
3.2.2 H3K27ac ChIP-seq in a primary human islet sample ... 72
3.2.5 Electrophoretic mobility shift assays ... 73
3.3 Results ... 74
3.3.1 rs11708067 is associated with ADCY5 expression in primary human pancreatic islets ... 74
3.3.2 rs11708067 overlaps evidence of open chromatin and a predicted strong enhancer region in human pancreatic islets ... 74
3.3.3 Allelic imbalance of H3K27ac reads overlapping rs11708067 in human pancreatic islets ... 75
3.3.4 rs11708067 shows allelic differences in enhancer activity ... 75
3.3.5 The alleles of rs11708067 exhibit differential protein binding ... 75
3.4 Discussion ... 76
CHAPTER 4: REGULATORY ELEMENTS IN ENDOTHELIAL CELLS AT THE PLXND1 GWAS LOCUS ASSOCIATED WITH WHR ... 89
4.1 Introduction ... 89
4.2 Materials and Methods ... 90
4.2.1 Luciferase reporter vectors containing PLXND1 candidate cis-regulatory elements ... 90
4.2.2 Generation of a gateway-compatible pGL4.23 luciferase reporter vector ... 91
4.2.3 Cell culture ... 92
4.2.4 Cloning of PLXND1 candidate cis-regulatory elements into EGFP expression vector ... 92
4.2.5 Injection and imaging of human PLXND1 CREs in zebrafish ... 92
4.2.6 Electrophoretic mobility shift assays ... 93
4.3 Results ... 94
4.3.1 Four candidate CREs show enhancer activity in HUVEC ... 94
4.3.2 The alleles of rs11718169 in CRE 17 show similar enhancer activities in HUVEC ... 94
4.3.3 CRE 17 shows enhancer activity in endothelial cells in zebrafish ... 95
4.3.4 rs4488824 in CRE 13 exhibits differential protein binding ... 95
4.4 Discussion ... 96
CHAPTER 5: CONCLUSIONS ... 107
LIST OF TABLES
Table 2.1 Definitions of lipoprotein subclass measurements for association analyses
in the METSIM study ... 55 Table 2.2 Primer sequences for functional assays ... 56 Table 2.3 Evidence of association of GALNT2 SNP rs2144300 with 72 METSIM
lipid and cholesterol traits ... 59 Table 2.4 Association of GALNT2 locus variants with total cholesterol in
medium HDL in the METSIM study ... 62 Table 2.5 Variants in strong linkage disequilibrium (r2 > 0.7) with the GWAS
HDL-C-associated variant rs4846914 overlap ENCODE open chromatin,
histone ChIP-seq and transcription factor ChIP-seq peaks in liver cell types ... 65 Table 2.6 SNP associations with gene expression levels in primary subcutaneous
adipose tissue samples from 1381 individuals from the METSIM study ... 67 Table 2.7 Initial and residual associations with GALNT2 expression in primary
subcutaneous adipose tissue samples from 1381 individuals from
the METSIM study ... 68 Table 3.1 Summary of published ADCY5 SNP associations with T2D and
glucose-related traits ... 86 Table 3.2 Primer sequences for luciferase reporter and electrophoretic mobility
shift assays ... 88 Table 4.1 Summary of candidate cis-regulatory elements designed to test in
LIST OF FIGURES
Figure 2.1 Non-coding variants at GALNT2 are associated with total cholesterol
in medium HDL in the METSIM study ... 28
Figure 2.2 HDL-C-associated variants overlap open chromatin and histone modifications indicating potential regulatory regions in GALNT2 intron 1 ... 29
Figure 2.3 HDL-C associated variants overlap open chromatin, histone modifications, and predicted enhancer and transcribed chromatin states in liver cell types identifying potential regulatory regions in GALNT2 intron 1 ... 30
Figure 2.4 Two of 14 elements containing variants in strong linkage disequilibrium (r2 > 0.7) with rs4846914 show allelic or haplotype differences in transcriptional enhancer activity in both orientations... 32
Figure 2.5 Twenty-one GALNT2 intronic variants tested in reporter assays do not exhibit allelic or haplotype differences in transcriptional enhancer activity in both orientations ... 33
Figure 2.6 Haplotype and allelic differences in transcriptional activity at the GALNT2 locus ... 34 37 Figure 2.7 Haplotype and allelic differences in transcriptional activity at the GALNT2 locus are consistent in Huh-7 cells ... 35
Figure 2.8 Haplotype variants act together to increase transcriptional activity ... 36
Figure 2.9 Haplotype variants act together to increase transcriptional activity in Huh-7 cells ... 37
Figure 2.10 The 780-bp segment shows haplotype differences in enhancer activity in a promoterless vector... 38
Figure 2.11 SNPs rs4846913, rs2144300, rs1555290 and 21-bp indel rs6143660 do not show allelic differences in enhancer activity when cloned and tested as separate segments in luciferase reporter assays ... 39
Figure 2.12 The rs2281721 C allele shows binding to USF1 ... 40
Figure 2.13 Transcription factors not bound to rs2281721 or rs4846913 ... 41
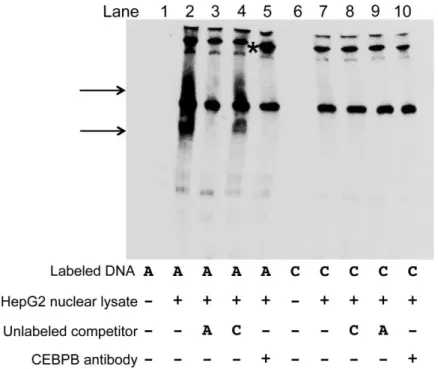
Figure 2.14 CEBPB binds differentially to the alleles of rs4846913 ... 42
Figure 2.15 The alleles of rs4846913 show consistent allelic differences in binding ... 43
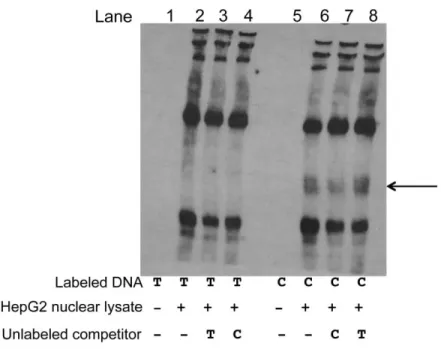
Figure 2.16 The alleles at rs1555290 exhibit allele-specific protein binding ... 44
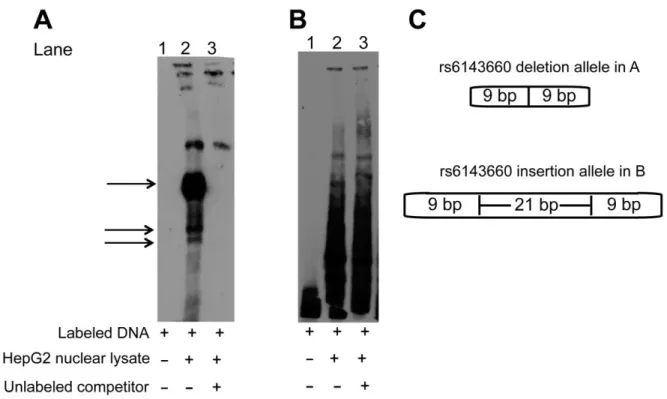
Figure 2.17 DNA sequence containing the 21-bp rs6143660 deletion allele shows evidence of protein binding ... 45
Figure 2.18 The alleles at rs2144300 show suggestive differential protein binding ... 46
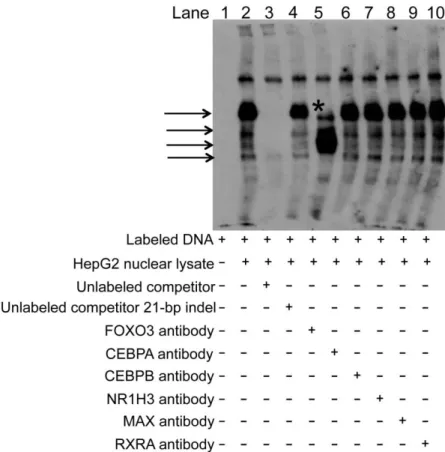
Figure 2.19 Specificity of FOXO3 binding to the deletion allele of rs6143660 ... 47
Figure 2.21 The rs4846914 A Allele associated with increased HDL-C is associated with higher GALNT2 RNA expression in primary human hepatocytes
and subcutaneous adipose tissue ... 49
Figure 2.22 Non-coding variants at GALNT2 are associated with GALNT2 expression
in adipose tissue samples from 1381 individuals from the METSIM study... 50 Figure 2.23 An additional SNP, rs10864726, shows modest allelic differences in
enhancer activity in the forward but not reverse orientation ... 52 Figure 2.24 siRNA-mediated knockdown of CEBPB in HepG2 cells results in a modest
decrease in GALNT2 expression ... 53 Figure 2.25 Multiple HDL-C-associated variants bind transcription factors at GALNT2 ... 54 Figure 3.1 The A allele of rs11708067 is associated with decreased ADCY5 expression
in 112 human primary pancreatic islet samples ... 79 Figure 3.2 rs11708067 overlaps pancreatic islet open chromatin and a strong enhancer
chromatin state in ADCY5 intron 3 ... 80 Figure 3.3 Evidence of allelic imbalance in H3K27ac ChIP-seq reads at rs11708067 ... 82 Figure 3.4 rs11708067 exhibits allelic differences in transcriptional activity in MIN6
mouse insulinoma and 832/13 rat insulinoma cells ... 83 Figure 3.5 The alleles of rs11708067 show allelic differences in nuclear protein binding ... 84 Figure 3.6 rs11708067 may alter transcription factor binding at ADCY5 ... 85 Figure 4.1 Open chromatin and histone modifications marking potential regulatory
regions at the PLXND1 WHR-associated locus ... 99 Figure 4.2 Four PLXND1 candidate cis-regulatory elements show enhancer activity
in HUVEC transcriptional reporter assays ... 100 Figure 4.3 Both alleles of rs11708067 in CRE 17 exhibit enhancer activity in HUVEC
transcriptional reporter assays ... 102 Figure 4.4 CRE 17 shows enhancer activity in endothelial cells in zebrafish 120 hours
post-fertilization ... 103 Figure 4.5 rs4488824 (in CRE 13) shows allelic differences in protein binding ... 104 Figure 5.1 Allele and haplotype differences in transcriptional enhancer activity are
LIST OF ABBREVIATIONS AEI allelic expression imbalance
ADCY5 Adenylate Cyclase 5; Adenylyl Cyclase 5
ATAC-seq Assay for transposase-accessible chromatin sequencing BMI Body mass index
ChIP-seq Chromatin immunoprecipitation sequencing CRE Cis-regulatory element
CVD Cardiovascular disease DNA Deoxyribonucleic acid
DNase-seq DNase I hypersensitivity sequencing EMSA Electrophoretic mobility shift assay ENCODE Encyclopedia of DNA Elements eQTL Expression quantitative trait locus
FAIRE Formaldehyde-assisted isolation of regulatory elements
FUSION Finland-United States Investigation of Non-Insulin-Dependent Diabetes Mellitus
GALNT2 UDP-N-acetyl-alpha-D-galactosamine:polypeptide N-acetylgalactosaminyltransferase 2 GIANT Genetic Investigation of Anthropometric Traits
GWAS Genome-wide association study HDL-C High-density lipoprotein cholesterol HUVEC Human umbilical vein endothelial cells IPSC Induced pluripotent stem cell
LD Linkage disequilibrium
LDL-C Low-density lipoprotein cholesterol METSIM Metabolic Syndrome in Men
NHGRI National Human Genome Research Institute
PLXND1 Plexin D1
CHAPTER 1: INTRODUCTION 1.1 Cardiovascular disease
Cardiovascular disease (CVD) is a leading cause of death worldwide and a major public health burden[1, 2]. An estimated 86 million adults in the United States suffer from CVD, a term that encompasses numerous medical conditions, including high blood pressure, myocardial infarction, stroke, and heart failure[3]. An estimated 43.9% of the United States population is predicted to develop some form of CVD by 2030, with medical costs projected to be about $918 billion[3, 4]. There are many major risk factors for CVD, including increased triglyceride and low-density lipoprotein cholesterol (LDL-C) levels, and decreased high-density lipoprotein cholesterol (HDL-C) levels[5-8]. Obesity and fat deposition also contribute to CVD risk[3, 9]. Increased visceral abdominal and extra-pericardial mediastinal fat deposition were found to be associated with an enhanced cardiovascular disease risk profile[10].
1.2 Lipoproteins and cholesterol
High total cholesterol levels increase an individual’s risk of cardiovascular disease and other adverse metabolic traits[11]. HDL-C (high-density lipoprotein cholesterol) and LDL-C (low-density lipoprotein cholesterol) are two major components of total cholesterol levels. LDL-C is a major focus with regards to risk of cardiovascular disease[12]. LDL particles consist of a core of triglycerides and
cholesteryl esters surrounded by phospholipids, free cholesterol and the protein apolipoprotein B-100[13] and can become oxidized and accumulate in arteries, where inflammation and atherosclerosis can result[14]. In contrast to LDL, HDL particles are smaller in size[15]. HDL-C levels are inversely associated with atherosclerotic cardiovascular disease[16, 17]. Like LDL, HDL consists of phospholipids, free
involves the efflux of cholesterol from macrophages in the arteries and cholesterol transport back to the liver[24-26].
1.3 Type 2 diabetes
Diabetes has also become a health epidemic within the United States. An estimated 21.1 million adults have diagnosed diabetes, with estimated medical costs at $245 billion in 2012[2, 27]. Type 2 diabetes (T2D) is the primary type of diabetes in adults, consisting of 90-95% of diagnosed cases[2]. T2D is characterized by impaired fasting glucose and/or impaired glucose tolerance[28]. These characteristics can be the result of insulin resistance or impaired insulin secretion through pancreatic beta cell dysfunction[29]. Individuals with type 2 diabetes can also develop vascular and circulatory abnormalities that can lead to the development of cardiovascular disease[30]. Circulatory disorders associated with diabetes include coronary heart disease, congestive heart failure and stroke[31]. Fasting insulin levels were found to be associated with coronary heart disease incidence[32] and individuals with type 2 diabetes are at increased risk of coronary atherosclerosis[33] and death from coronary heart disease[34].
1.4 Obesity and body fat distribution
visceral fat can also contribute to increased hepatic triglycerides, nonalcoholic fatty liver disease and insulin resistance[45]. Studies have shown that insulin resistance, increased triglycerides, and central obesity tend to cluster together[46, 47] and contribute to a metabolic disease risk profile.
1.5 Genetics of cardiometabolic traits
While environment, lifestyle and diet can influence cardiovascular disease, blood lipid and cholesterol levels, type 2 diabetes and body fat distribution[2, 48, 49], there is also a heritable component to these traits and diseases[50-52]. Heritability estimates for blood lipid and cholesterol levels range from 40-90%[53-58]. Heritability estimates for type 2 diabetes range from 30-77%[59, 60] and heritability estimates for body fat distribution (as measured by WHR) range from 31-70%[40, 55, 61, 62].
Genome-wide association studies (GWAS) have identified over 150 loci associated with blood lipid and cholesterol levels[63] over 45 loci associated with WHR[64, 65] and over 70 loci associated with type 2 diabetes[66, 67].GWAS provide an unbiased approach to identify candidate genes that may influence a particular trait or disease. Although GWAS have identified DNA variants and candidate genes associated with a trait or disease, they do not indicate which variants are functional. DNA variants inherited together and in strong linkage disequilibrium (LD) with the trait-associated variant may be responsible for driving the association signal, with the identified associated variant serving as a proxy[68]. Therefore, functional follow-up studies of association signals are necessary to determine the true functional variants and genes and to identify novel drug targets.
1.6 Identifying functional regulatory DNA variants from GWAS
Trib1 overexpression in mouse liver resulted in decreased lipid and cholesterol levels[71], providing a direct connection between gene function and CVD risk factors. Many DNA variants identified through GWAS are located within noncoding or intergenic regions of the genome[68], therefore, the variants may be located within enhancer or repressor elements that may ultimately alter gene expression, in contrast to altering the structure or function of a protein.
The ENCODE Project has numerous datasets to annotate functional genomic elements, including regulatory elements[72]. The NIH Roadmap Epigenomics Consortium has also created a resource that includes regulatory datasets for over 100 reference human epigenomes from a wide variety of cell types and tissues[73]. Both the ENCODE Project and NIH Roadmap Epigenomics Consortium resources include datasets that distinguish open chromatin regions that are devoid of histone proteins and are therefore more accessible to transcription factors. Two well-established methods for identifying open chromatin include DNase I hypersensitivity sequencing (DNase-seq) and formaldehyde-assisted isolation of regulatory elements (FAIRE) sequencing. DNase-seq involves DNase I enzyme digestion of DNA in regions devoid of histones (“open chromatin”) and subsequent sequencing[74]. FAIRE involves crosslinking histones to DNA and then isolating the open chromatin regions by phenol-chloroform extraction[75]. Both methods detect more active regulatory regions of DNA, including promoters and enhancers, which are more accessible to transcription factors. Chromatin immunoprecipitation
sequencing (ChIP-seq) of histone modifications can also distinguish regulatory regions of DNA. Enhancer regions are often marked by H3K4me1 and/or H3K4me2 (mono- or di-methylation of lysine 4 on histone H3), while promoter regions typically are marked by H3K4me3[76]. Furthermore, active enhancers often can be distinguished by the histone modification H3K27ac[77]. Transcription factor ChIP-seq data can also be used to detect regulatory regions in which transcription factors are bound[78]. Open chromatin and histone modifications have been used to guide the identification of functional regulatory variants[79-85].
1.7 Aims and overview
and the WHR-associated PLXND1 locus, and to further characterize the molecular mechanisms by which the functional variants act. The association signals at the GALNT2, ADCY5 and PLXND1 loci are all located within noncoding regions, therefore, I aimed to investigate whether any of the variants are located within regulatory regions and whether the variants show allelic differences in regulatory activity. At these three loci, open chromatin, histone modification ChIP-seq and transcription factor ChIP-seq data were considered in order to identify potential regulatory elements and variants.
In Chapter 2, the GALNT2 HDL-C-association signal was further characterized by using fine-mapping and conditional analyses in 10,079 individuals from the METSIM study. I comprehensively evaluated the transcriptional regulatory activity of all candidate variants in strong linkage disequilibrium (r2 > 0.7) with the lead HDL-C GWAS variant, rs4846914. For the variants that showed allelic or haplotype differences in transcriptional regulatory activity, I tested for evidence of differential protein binding to the alleles using electrophoretic mobility shift assays (EMSAs), and confirmed the identity of the factors bound to 2 of the regulatory variants using EMSA supershift and ChIP assays. I also evaluated whether using regulatory datasets (i.e. open chromatin, histone modification ChIP-seq and transcription factor ChIP-seq data) can help to distinguish variants that show allelic differences in regulatory activity from a set of candidate variants. Finally, I describe the direction of effect using allelic expression imbalance assays in primary hepatocytes and expression quantitative trait locus (eQTL) lookups in primary
subcutaneous adipose samples to show that the rs4846914-A allele (associated with increased HDL-C) is associated with increased GALNT2 expression.
In Chapter 3, I used open chromatin and chromatin state regulatory datasets in human pancreatic islets to identify a candidate functional regulatory variant, rs11708067, which was associated with type 2 diabetes and glycemic traits at the ADCY5 locus. I tested and confirmed that this variant showed allelic differences in transcriptional activity in mouse and rat insulinoma beta cell lines, as well as allelic
In Chapter 4, I describe the identification of regulatory elements at the PLXND1 locus. GWAS identified a human WHR association signal that spans upstream of the PLXND1 promoter and PLXND1 intron 1. Considering itsestablished role in vascular biology, visceral adipose tissue morphology and lipid storage, PLXND1 is a strong candidate gene that may influence human body fat distribution. Through the use of complementary assays in human cell lines and zebrafish, I examine the regulatory activity of candidate regulatory elements at the PLXND1 locus and show that one of these candidate elements shows regulatory enhancer activity in both HUVEC and in zebrafish endothelial cells.
CHAPTER 2: MULTIPLE HEPATIC REGULATORY VARIANTS AT THE GALNT2 GWAS LOCUS ASSOCIATED WITH HIGH-DENSITY LIPOPROTEIN CHOLESTEROL1
2.1 Introduction
Genome-wide association studies (GWASs) have identified more than 150 loci associated with blood lipid and cholesterol levels[63, 86-89]. One of the first novel GWAS signals for high-density
lipoprotein cholesterol (HDL-C) levels in Europeans was reported for variants rs2144300 and rs4846914, located within intron 1 of GALNT2[70, 90] (MIM: 602274). These two lead GWAS variants are in perfect linkage disequilibrium (LD; r2 = 1). The association signal for rs4846914 has been replicated (n = 187,000 individuals, p = 4 × 10−41) in subsequent studies with larger sample sizes[63, 87] and in Japanese and Mexican populations[91, 92]. HDL-C-associated variant rs4846914 is also associated (n = 178,000, p = 7 × 10⁻³¹) with triglycerides[63] and nominally associated (n = 2,744–3,481, p < 0.05) with large HDL concentration, low-density lipoprotein (LDL) size, HDL size, HDL-2 subfraction, and the ratio of total cholesterol to HDL-C[93]. The alleles associated with increased HDL-C are also nominally associated (n = 84,068, p = 0.04) with decreased risk of coronary artery disease[63].
According to 1000 Genomes phase 1 version 3 European (EUR) data[94] 24 variants exhibit strong LD (r2 > 0.7) with the lead GALNT2 HDL-C-associated SNP, rs4846914, and all 25 variants are noncoding. According to available chromatin data from the ENCODE Project[72] and Human Epigenome Atlas[73] these variants overlap many candidate regulatory regions. Therefore, we hypothesized that one or more of these variants regulate gene expression. Many variants identified through GWASs are located within noncoding or intergenic regions[68, 95] and variants at the GALNT2 locus might also alter
regulatory elements.
enzyme that transfers an N-acetylgalactosamine to serine or threonine residues in target proteins in the initial step of O-linked glycosylation[96]. GALNT2 is expressed in many tissues, including liver, heart, lung, muscle, pancreas, ovary, and colon[97-99]. GALNT2 might influence HDL-C levels by catalyzing
O-glycosylation on target proteins that play a role in lipid metabolism. In vitro, GALNT2 has been shown to O-glycosylate lecithin-cholesterol acyltransferase (LCAT), phospholipid transfer protein (PLTP), and angiopoietin-like protein 3 (ANGPTL3), and O-glycosylation of ANGPTL3 was shown to inhibit activation of this protein[100]. Individuals heterozygous for a GALNT2 missense variant (c.941A>C [p.Asp314Ala]) shown to decrease GALNT2 function in vitro exhibit decreased glycosylation of apoC-III and high (>95th percentile for age and gender) plasma HDL levels[101]. In mice, liver-specific Galnt2 overexpression and knockdown have been shown to decrease and increase HDL-C levels, respectively[87].
We aimed to identify the functional regulatory variant(s) responsible for the GALNT2 HDL-C GWAS signal by fine mapping the association with lipoprotein traits in the METSIM (Metabolic Syndrome in Men) study[102] and by examining a comprehensive set of candidate variants for evidence of allelic differences in enhancer function. We identified a single signal driven by at least two regulatory variants, rs4846913 and rs2281721, that exhibited binding of transcription factors and allelic differences in enhancer activity, as well as additional variants that might contribute to enhancer function. In human hepatocyte and subcutaneous adipose tissue samples, we observed an association between this GWAS signal and GALNT2 expression. Together, these data show a consistent direction of regulatory effect in which increased expression of GALNT2 is implicated in increased HDL-C.
2.2 Materials and Methods
2.2.1 Defining the candidate set of variants
states[103] in multiple cell types. We used the Human Epigenome Atlas[73] to determine overlap with peaks of H3K4me1 and H3K9ac in primary adult liver and with ChromHMM chromatin states in multiple cell types and tissues.
2.2.2 Genotyping and imputation
We used the Illumina HumanOmniExpress and HumanCoreExome[104] Beadchips to genotype 10,134 Finnish men from the METSIM study[102]. Sample-level and SNP-level quality control included detecting sample contamination[105] confirming sex and relationships, and using principal-component analysis to detect population outliers. After we filtered SNPs to retain those with a call rate of >95% and Hardy-Weinberg Equilibrium p > 10−6, we successfully analyzed 10,082 individuals and 681,803 SNPs. The METSIM study was approved by the ethics committee of the University of Kuopio and Kuopio University Hospital, and informed consent was obtained from all study participants. To impute
ungenotyped SNPs, we used a panel of 5,474 reference haplotypes derived from genome sequences of 2,737 central-northern European individuals sequenced as part of the Genetics of Type 2 Diabetes study (C.F., J. Flannick, K.J.G., H. Kang, and the GoT2D Consortium, unpublished data). The minimum MaCH imputation quality score for the imputed variants was R2 = 0.971. We used a two-step imputation strategy wherein individuals were pre-phased with ShapeIT version 2 before imputation using Minimac[106]. We also used these data to verify LD proxies for allelic-expression-imbalance (AEI) assays.
2.2.3 Fine-mapping and conditional analyses
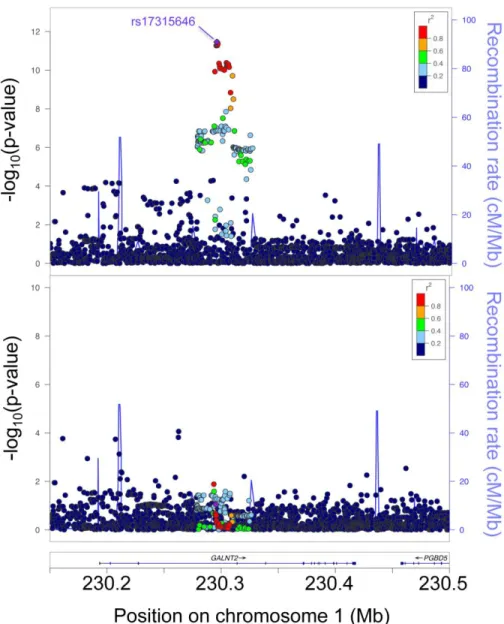
an additive genetic model and using a linear mixed model with an empirical kinship matrix to account for relatedness, as implemented in EMMAX[109]. We repeated the analysis while excluding individuals on lipid-lowering medication (2,844 participants), individuals with type 1 or 2 diabetes (1,420 participants), or both (3,560 participants) to assess sensitivity to these exclusions, and in each instance we obtained qualitatively similar results. To identify any additional independent signals in the region, we performed a conditional analysis by using the rs17315646 allele count as an additional covariate in the model. LocusZoom[110] plots were generated to include 2,079 variants in a 350-kb region surrounding the lead variant rs17315646 and spanning GALNT2.
2.2.4 Cell culture
Human HepG2 hepatocellular carcinoma cells (ATCC, HB-8065) were grown in Eagle’s minimum essential medium (MEM) alpha supplemented with 10% fetal bovine serum (FBS) and 1 mM sodium pyruvate at 37°C and 5% CO2. Human Huh-7 hepatocellular carcinoma cell lines (JCRB0403, Japanese
Collection of Research Bioresources Cell Bank, National Institute of Biomedical Innovation) were grown in DMEM supplemented with 10% FBS, 1 mM sodium pyruvate, 1× MEM non-essential amino acids, and 2 mM L-glutamine. HepG2 and Huh-7 cells were seeded into 24-well plates (100,000 cells per well) 1 day prior to transfection experiments.
2.2.5 Transcriptional reporter assays
which the alleles matched at these variants. For simplicity of presentation, Figures 2.4, 2.6 and 2.7 do not show the differing alleles of rs1555290; these data are provided in Figures 2.8 and 2.9. We then
transfected each purified clone into HepG2 or Huh-7 cells in duplicate (720 ng in each well) by using FuGENE 6 (Promega) and Opti-MEM (Life Technologies). To control for transfection efficiency, we co-transfected a phRL-TK Renilla luciferase reporter vector (80 ng in each well) into cells. For empty-vector controls, two independent preparations of empty vector were each transfected into HepG2 or Huh-7 cells in duplicate. After 48 hr, cell-lysate luciferase activity was measured with the Dual-Luciferase Reporter Assay System (Promega), normalized, and compared to readings for empty-vector controls. These control readings were very similar for the two independent preparations. We performed two-tailed t tests to compare the luciferase activities between variant alleles. For comparisons of multiple haplotypes, we performed ANOVA and Tukey’s post hoc tests by using JMP 10.0.1 software (SAS Institute). We also assessed the transcriptional activity of the 780-bp segment by cloning the haplotype into the promoterless pGL4.10 firefly luciferase reporter vector (Promega). To examine individual variant effects within the 780-bp segment, we altered alleles by using the QuikChange Site-Directed Mutagenesis Kit (Agilent
Technologies) and confirmed them by sequencing.
2.2.6 Electrophoretic mobility shift assays
Complementary DNA oligonucleotides (17–19 bp) centered on variant alleles (Table 2.2) were synthesized by Integrated DNA Technologies. The rs6143660 insertion allele consisted of 39-bp
transcription factors in liver, or plausible roles of the factors in cholesterol metabolism. These included antibodies to ARNT 271801X), SF1 10976X), HNF4A 6556X), RXRA 553X), CEBPA (sc-61X), CEBPB (sc-150X), NR1H3 (sc-1202X), and MAX (sc-765X). Reactions were loaded into a 6% DNA retardation gel (Life Technologies), subjected to electrophoresis, transferred to Biodyne B nylon
membranes (Life Technologies), and UV crosslinked. Wash and detection steps were performed according to instructions in the Chemiluminescent Nucleic Acid Detection Module (Life Technologies). Experiments involving electrophoretic mobility shift assays (EMSAs) were repeated on 2–7 separate days, and all had consistent results.
To predict transcription-factor binding sites, we searched databases for transcription-factor binding-site motifs in 17- to 21-bp genomic sequences containing each allele of candidate variants. For JASPAR[111] we searched all available matrix models with a relative profile-score threshold of 80%. We also searched positional-weight matrices (PWMs) from vertebrates in TRANSFAC by using default parameters in the TRANSFAC Professional’s Match tool and by using PWM-SCAN[112].
2.2.7 ChIP assays
We used a TaqMan SNP Genotyping Assay (Life Technologies) to genotype HepG2 and Huh-7 cells at rs4846913. Cells were crosslinked with 1% formaldehyde, and glycine was added to stop fixation. Fixed cells were resuspended in SDS lysis buffer (1% SDS, 10 mM EDTA, and 50 mM Tris [pH 8.1]), diluted with immunoprecipitation (IP) buffer (0.01% SDS, 1.1% Triton X-100, 1.2 mM EDTA, 16.7 mM Tris [pH 8.1], and 167 mM NaCl), and sonicated on ice with a Branson sonifier for the generation of 100- to 500-bp DNA fragments. Each CEBPB IP or immunoglobulin G (IgG) reaction used two to three million cells. After preclearing with Protein A Agarose beads (sc-2001, Santa Cruz Biotechnology), 10 μg of CEBPB antibody (sc-150X, Santa Cruz Biotechnology) or 10 μg of normal rabbit IgG (sc-2027, Santa Cruz Biotechnology) was added to HepG2 and Huh-7 cell lysates and incubated overnight. Protein A Agarose beads were then added for 3 hr and washed separately with low-salt buffer, high-salt buffer, LiCl buffer, 10 mM Tris-EDTA, and elution buffer (1% SDS and 0.1 M NaHCO3). The crosslinks were then
ethanol precipitation. For qPCR, a 120-bp region spanning rs4846913 was amplified with FAST SYBR Green Master Mix (Life Technologies). qPCR was performed in triplicate and quantified with respect to a standard curve generated from sonicated HepG2 DNA standards. The mean quantities of CEBPB IP and IgG control sample were normalized to input HepG2 or Huh-7 DNA. CEBPB and IgG ChIP experiments with HepG2 and Huh-7 cells were each performed twice and had similar results. We used two-tailed t tests to compare CEBPB enrichment of the rs4846913 region in HepG2 and Huh-7 cells.
We performed USF1 ChIP assays similarly, except that we used a Diagenode Bioruptor Standard
sonicator. We used 10 μg of USF1 antibody (sc-229X, Santa Cruz Biotechnology) or 10 μg IgG (sc-2027, Santa Cruz Biotechnology) and purified DNA with the QIAquick PCR Purification Kit (QIAGEN) to amplify and quantify a 164-bp region spanning rs2281721. We performed USF1 and IgG ChIP experiments with HepG2 and Huh-7 cells twice each, and they had similar results.
2.2.8 Allelic-imbalance analysis of sequence reads from CEBPB ChIP-seq and DNase-seq Sequence reads from HepG2 for DNase-I-hypersensitivity-site sequencing (DNase-seq) and CEBPβ ChIP-seq experiments generated by the ENCODE Consortium[72] were aligned to UCSC Genome Browser build hg19 with AA-ALIGNER[113]. In brief, HepG2 genotypes were obtained from the Illumina Human-1M-Duo BeadChip array genotyped at HusdonAlpha Institute of Biotechnology, and imputation was performed with the 1000 Genomes Phase 1 EUR reference panel[94]. Using this data, we verified that HepG2 is diploid in the chromosome 1 region containing GALNT2, and we created a
personalized HepG2 reference genome containing non-reference alleles for sites at which HepG2 is homozygous for the non-reference allele. We aligned sequence reads to the personalized genome by using HepG2 heterozygous sites identified by imputation and GSNAP[114] with the following parameters: m 1, k 11, basesize = 11, sampling = 1, terminalthreshold = 10, n 1, queryunkmismatch = 1, -genome-unk-mismatch = 1, -trim-mismatch-score = 0, -t 7, and --A sam. We filtered the alignments to remove sequences aligned to more than one genomic location, sequences aligned to regions
of reads at the heterozygous site. For the HepG2 DNase-seq data and USF1 HepG2 ChIP-seq data, insufficient reads were available for allelic imbalance analysis at rs2281721.
2.2.9 Preparation of cDNA for GALNT2 mRNA-expression and AEI assays
RNA and DNA were isolated from hepatocyte samples of 50 individuals as described
previously[115] RNA for each sample was treated with DNase I with the DNA-free Kit (Life Technologies) and added to a final concentration of 24 ng/μl in an RT-PCR reaction in the SuperScript III First-Strand Synthesis System (Life Technologies), which includes both oligo(dT)20 and random hexamer primers. The
synthesized cDNA for each sample was then diluted with diethylpyrocarbonate (DEPC)-treated water for use in mRNA-expression and AEI assays.
2.2.10 AEI assays
We used a TaqMan SNP genotyping assay (Life Technologies) to genotype human hepatocyte genomic DNA (gDNA) from ADMET Technologies for the HDL-C index SNP rs4846914. To quantify allele-specific expression, we diluted hepatocyte cDNA and gDNA from 36 individuals heterozygous for rs4846914 and performed subsequent qPCR reactions in triplicate. To generate a standard curve, we mixed gDNAs from samples homozygous for each rs4846914 allele in the following ratios: 95:5, 72.5:27.5, 61.25:38.75, 50:50, 38.75:61.25, 27.5:72.5, and 5:95. We generated a standard curve by plotting the quantity of one allele against the difference between the cycle-threshold (Ct) values of the two alleles. For each heterozygous sample, we estimated the expression percentage of one allele by using the difference between the mean Ct values of the alleles and the standard curve[115]. We used two-tailed t tests to compare gDNA and cDNA values and used F-tests to determine equal or unequal variance between gDNA and cDNA samples[115, 116].
2.2.11 GALNT2 hepatocyte mRNA expression
primer-set sequences within GALNT2 exons (Table 2.2). GALNT2 expression values were normalized to the expression of beta-2-microglobulin (B2M [MIM: 109700]), natural-log transformed, and plotted according to the rs4846914 genotype (AA, AG, and GG). Using linear regression and an additive model including sex, ancestry, and age as covariates, we tested for association between the level
of GALNT2 mRNA and the rs4846914 genotype.
2.2.12 Lookup of expression quantitative trait loci in subcutaneous adipose tissue
We looked for evidence of association between the HDL-C GWAS variant region and gene expression by using preliminary microarray expression data from subcutaneous adipose tissue from the METSIM study. In brief, we used EPACTS-multi (with EMMAX implemented to account for family relatedness) Affymetrix Human Genome U219 Array data for 1381 individuals was adjusted for 40 confounding factors[117] inverse-normal transformed, and tested for association with variants. We analyzed variants within 1 Mb of rs4846914 and identified one probe set for GALNT2 and other genes located in this region. Subsequent reciprocal conditional analyses included two variants in each model.
2.2.13 siRNA-mediated knockdown of CEBPB
HepG2 cells (80,000 per well) were plated into 24-well collagen-coated plates and then treated with 50 nM CEBPB Silencer Select small interfering RNA (siRNA; s2893, Thermo Fisher Scientific) or Silencer Select Negative Control No. 1 siRNA (4390843, Thermo Fisher Scientific) with Opti-MEM (Life Technologies) and DharmaFECT1 transfection reagent (GE Healthcare Life Sciences) on the following day. Cells were incubated at 37°C with 5% CO2 for 48 hr, and HepG2 medium was changed the day
following siRNA transfection. RNA was harvested with the RNeasy Plus Mini Kit (QIAGEN), and cDNA was prepared with the SuperScript III First-Strand Synthesis System (Life Technologies). CEBPB and GALNT2 expression was measured by qPCR with a standard curve. Raw expression values were normalized to the expression of B2M, and expression percentages were calculated by comparison to expression values in HepG2 cells transfected with the negative control siRNA. Primers for gene
2.3 Results
2.3.1 Fine mapping shows evidence of a single association signal strongest for total cholesterol in medium HDL
We tested one of the HDL-C-associated lead GWAS variants, rs2144300 (r2 = 1 with rs4846914), for association with 72 lipid and cholesterol traits in up to 10,079 Finnish men from the METSIM study. The strongest evidence of association across all 72 traits was with total cholesterol in medium HDL (n = 9,810, β = 0.10, p = 5.3 × 10⁻¹²
; Table 2.3). Using this trait and variants that were directly genotyped or imputed from a reference panel of 2,737 genomes of central-northern European individuals, we performed fine-mapping association and conditional analyses. Among 2,079 total variants in the region spanning 350 kb surrounding the lead variant, the strongest evidence of association was observed for rs17315646 (n = 9,810, p = 3.5 × 10⁻¹²), which is in perfect LD (r2 = 1) with HDL-C GWAS lead SNPs rs4846914 (n = 9,810, p = 5.3 × 10⁻¹²) and rs2144300 (n = 9,810, p = 5.3 × 10⁻¹²). Conditioning on rs17315646 attenuated the 13.7-kb association signal (all p > 0.01; Figure 2.1 and Table 2.4). The new lead variants after conditional analysis (pcond∼ 10
−4–10−6
) showed weak initial evidence of association (p ∼ 10−2–10−4) and have a MAF < 0.04 (Table 2.4). These data provide evidence that common variants in strong LD with rs4846914 and rs17315646 are most likely responsible for the HDL-C association signal. All 25 candidate variants (r2 > 0.7 with HDL-C GWAS lead variant rs4846914) are located within intron 1 of GALNT2. These variants all exhibited strong evidence of association with total cholesterol in medium HDL (p ≤ 1.45 × 10⁻⁹;Table 2.4).
2.3.2 Open-chromatin, histone-modification, and transcription-factor marks indicate potential regulatory elements overlapping the GALNT2 association signal
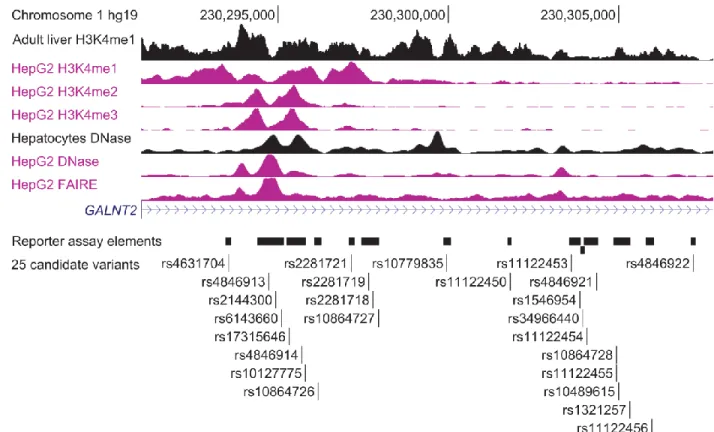
elements; and transcription-factor ChIP-seq peaks. On the basis of the liver’s key role in HDL synthesis and transport, and the enrichment of lipid GWAS signals in liver[63] we focused on datasets from human liver cell lines, primary human hepatocytes, and human adult liver cells. All 25 variants overlap broad patterns of enriched domains in HepG2 cells (Table 2.5), and 13 overlap narrower H3K4me1-enriched peaks[118]. Sixteen variants overlap two or more histone-modification peaks, and six variants (rs4631704, rs4846913, rs2144300, rs6143660, rs2281721, and rs11122453) overlap at least one transcription-factor ChIP-seq peak (Figure 2.2 and Table 2.5). Three variants (rs4846913, rs2144300, and rs6143660) overlap the most marks of potential regulatory function (at least 22 peaks, including open-chromatin, histone-modification, and transcription-factor peaks). According to ChromHMM data[103] from ENCODE[72] and the Roadmap Epigenomics Project[73] all 25 variants are located within predicted enhancer or transcribed-region chromatin states in HepG2 cells and primary liver cells (Figure 2.3). The regulatory peaks are not specific to liver cells, given that open-chromatin, histone-modification, and transcription-factor peaks were also observed in GM12878 lymphoblastoid cells, human umbilical-vein endothelial cells (HUVECs), K562 leukemia cells, CD20+ B cells, CD14+ monocytes, human skeletal-muscle myoblasts (HSMMs), normal human astrocytes (NHAs), normal human lung fibroblasts (NHLFs), and osteoblasts (Figure 2.3).
2.3.3 All 25 candidate regulatory variants were evaluated for allelic differences in luciferase activity
2.3.4 rs2281721 exhibits allelic differences in transcriptional activity
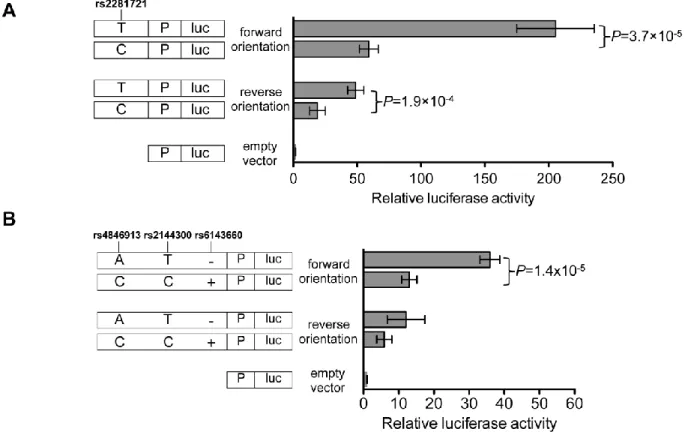
Among all the segments tested, a 154-bp DNA segment containing rs2281721 showed the strongest enhancement of luciferase activity, and this activity also differed between the alleles (Figure 2.6A). In the forward orientation, the DNA segment containing the rs2281721 T allele, associated with increased HDL-C, showed 75-fold more luciferase activity than the empty-vector control, whereas the segment containing the rs2281721 C allele showed 27-fold more, and significant differences were observed between the alleles (p = 2.4 × 10⁻⁶). In the reverse orientation, the T and C alleles exhibited 37-fold and 14-37-fold, respectively, more luciferase activity than did the control, and there were significant differences between the alleles (p = 5.8 × 10⁻⁵). The rs2281721 T allele also showed stronger enhancer activity than did the rs2281721 C allele in both forward (205-fold versus 59-fold more than in the control) and reverse (49-fold versus 19-fold more than in the control) orientations in a second hepatocellular carcinoma cell line, Huh-7 (both p < 3 × 10⁻⁴; Figure 2.7A). The segment and the position of rs2281721 overlaps H3K4me1 peaks in HepG2 cells and adult liver; H3K4me2, H3K9ac, and H3K27ac peaks in HepG2 cells; and a USF1 transcription-factor ChIP-seq peak in HepG2 cells (Figure 2.2 and Table 2.5).
2.3.5 A segment containing rs4846913, rs2144300, and rs6143660 shows haplotype differences in transcriptional activity
A 780-bp DNA segment containing three variants exhibited significant haplotype differences in luciferase activity (Figure 2.6B). We analyzed two haplotypes of rs4846913, rs2144300, and rs6143660 (a 21-bp indel): AT− (containing the alleles associated with increased HDL-C) and CC+ (containing the alleles associated with decreased HDL-C). In the forward orientation, the AT− and CC+ haplotypes showed 49-fold and 16-fold, respectively, more luciferase activity than did the empty-vector control, and significant differences were observed between the haplotypes (p = 1.8 × 10⁻⁵). In the reverse orientation, the AT− and CC+ haplotypes exhibited 11-fold and 4-fold, respectively, more luciferase activity than did the empty-vector control, and significant differences were observed between the haplotypes (p = 2.0 × 10⁻⁴). The three HDL-C-associated variants rs4846913, rs2144300, and rs6143660 (a 21-bp indel) each overlapped ≥22 open-chromatin, histone-modification, and transcription-factor peaks
Haplotype effects on transcriptional activity were similar in Huh-7 cells. In the forward orientation, haplotypes AT− and CC+ showed 36-fold and 13-fold, respectively, more luciferase activity than did the empty-vector control; the differences observed between the haplotypes were significant (p = 1.4 × 10⁻⁵ Figure 2.7B). In the reverse orientation, haplotypes AT− and CC+ showed 12-fold and 6-fold, respectively, more luciferase activity than did the empty-vector control (p = 0.08, Figure 2.7B). The direction of effect was the same as that of rs2281721; alleles associated with increased HDL-C showed increased
luciferase activity.
Taken together, our data show consistent haplotype differences in luciferase activity for a 780-bp segment consisting of rs4846913, rs2144300, and rs6143600. The results suggest that these variants are located within an enhancer element that can affect transcription and that one or more of them might have an allelic effect on transcriptional activity.
2.3.6 The haplotype variants act together to regulate enhancer activity
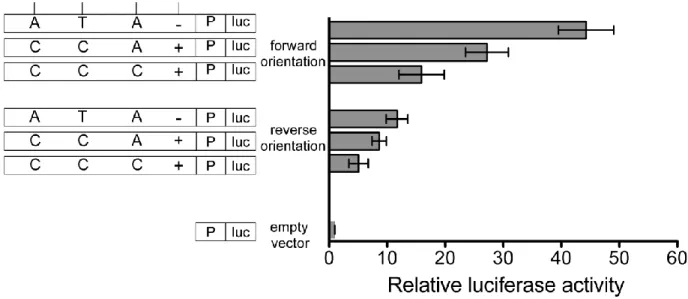
We then created additional haplotypes of the 780-bp segment by performing site-directed mutagenesis to investigate the variant responsible for allelic differences in transcriptional activity. In addition to including the candidate variants rs4846913, rs2144300, and rs6143660, the segment included an additional common variant, rs1555290, in moderate LD with rs4846914 (D′ = 1, r2
and/or rs6143660 might also contribute to increased transcriptional activity. We observed similar results in Huh-7 cells: the ATA−, ACA−, and CCA− haplotypes showed 36-fold, 30-fold, and 27-fold, respectively, more luciferase activity than did the empty-vector control, and significant differences were observed between the ATA− and CCC− haplotypes (p = 0.0001). Compared to the empty-vector control, the CCA+, CCC−, and CCC+ haplotypes showed similar (p > 0.05) 13- to 15-fold increases in luciferase activity (Figure 2.9). Taken together, these data suggest a role for at least two variants, rs4846913 and rs2144300, in haplotype differences in enhancer activity.
Because the SNPs in the 780-bp segment overlap H3K1me1 and H3K4me2 peaks, which are frequently present in enhancer regions, as well as a H3K4me3 peak, which is often found at promoters, we also evaluated the haplotypes in a promoterless vector (Figure 2.10). In the forward orientation, haplotypes ATA−, CCA+, and CCC+ showed 44-fold, 27-fold, 16-fold, respectively, more luciferase activity than did the empty-vector control, and significant differences were observed between all haplotype comparisons (p < 0.001). In the reverse orientation, haplotypes ATA−, CCA+, and CCC+ exhibited 12-fold, 9-fold, and 5-fold, respectively, more luciferase activity than did the empty-vector control, and significant differences were observed between all the haplotype comparisons (p < 0.04).
We subsequently analyzed the four variants individually in 100- to 200-bp DNA segments. Of the four variants tested individually, only the element containing rs2144300 exhibited enhanced luciferase activity (average 6.5-fold more than in the empty-vector control). Almost none of these segments showed allelic differences (p > 0.1; Figure 2.11), but rs4846913 did show allelic differences in only the forward orientation (p = 0.03). These data suggest that the larger segment is necessary for observing allelic differences in enhancer activity in this assay.
2.3.7 USF1 binds to rs2281721
To investigate whether transcription factors bind differentially to rs2281721, rs4846913,
rs2144300, rs1555290, and rs6143660, we performed EMSAs with HepG2 nuclear lysate. The rs2281721 C probe showed stronger protein binding than the rs2281721 T probe (lane 2 versus 7,
USF1 ChIP-seq peak from ENCODE data in HepG2 cells, as well as a predicted USF1 motif. In EMSAs, the addition of a USF1 antibody resulted in a disruption of the band observed with the C allele (lane 5). As negative controls, we tested ARNT and SF1 antibodies; we did not observe disruption of the rs2281721 C allele band (Figure 2.13). These data provide evidence supporting USF1 binding to the C allele of rs2281721.
To validate the USF1 binding in a native chromatin context, we performed ChIP assays in both HepG2 (rs2281721 genotype T/C) and Huh-7 (rs2281721 genotype C/C) cells. The ChIP assays provided evidence supporting USF1 binding to a 164-bp DNA region spanning rs2281721; however, this binding was not allele specific (Figure 2.12B).
2.3.8 CEBPB binds differentially to the alleles of rs4846913
We also observed more protein binding to the A allele than to the C allele of rs4846913 (lane 2 versus 7, arrow, Figures 2.14A and 2.15). We observed a greater decrease in band intensity upon addition of 63-fold excess unlabeled rs4846913 A probe than upon addition of 63-fold excess unlabeled rs4846913 C probe, suggesting that competition of the lane 2 band with unlabeled rs4846913 A probe is more effective than competition with the unlabeled rs4846913 C probe (lane 3 versus 4). rs4846913 overlaps CEBPB ChIP-seq peaks from ENCODE data in HepG2 cells and a predicted CEBPB binding motif. Incubation of the EMSA reactions with a CEBPB antibody generated a strong supershift band for the A allele and a detectable supershift band for the C allele (lane 5 versus 10,Figure 6A). As negative controls, we tested HNF4A or RXRA antibodies; we did not observe evidence of supershifts (Figure 2.13).
To validate the differential CEBPB binding in a native chromatin context, we performed ChIP assays in both HepG2 (rs4846913 genotype A/C) and Huh-7 (rs4846913 genotype C/C) cells. A 120-bp region of DNA containing rs4846913 showed 31-fold more CEBPB binding in HepG2 cells than in Huh-7 cells (p = 0.006; Figure 2.14B). These results are consistent with the EMSA result of increased CEBPB binding to rs4846913 A.
Methods). Among CEBPB reads spanning rs4846913, 57 of 78 (73%) contained the rs4846913 A allele (binomial p = 5.6 × 10⁻⁵; Figure 2.14C). Among DNase-seq reads spanning rs4846913, 31 of 83 (37%) contained the rs4846913 A allele (binomial p = 0.03; Figure 2.14C), suggesting that CEBPB might help protect the DNA sequence containing the A allele from being accessible to the DNase I enzyme. Taken together, the EMSA, ChIP, and allelic imbalance in ChIP-seq and DNase-seq reads all show consistent evidence suggesting stronger CEBPB binding to the A allele of rs4846913.
2.3.9 rs2144300, rs1555290, and rs6143660 also show suggestive evidence of protein binding EMSAs using HepG2 nuclear lysate for the other variants in the four-variant haplotype
(rs2144300, rs1555290, and rs6143660) showed suggestive evidence of differential allelic protein binding (Figures 2.16, 2.17, 2.18). The rs1555290 C probe showed a reproducible band (arrow, Figure 2.16), and the addition of 30-fold excess unlabeled rs1555290 C probe competed away the signal (lane 7) more effectively than did the addition of 30-fold excess unlabeled rs1555290 A probe (lane 8). The rs6143660 deletion allele showed multiple protein-binding bands (lane 2, Figure 2.17) that were altered by incubation with FOXO3 antibody (Figure 2.19), although it is challenging to interpret results when using EMSA probes of different sequence lengths to compare the 21-bp-insertion and 21-bp-deletion alleles. However, we did not observe any disruption of the band corresponding to the rs6143660 deletion allele when we tested additional antibodies CEBPA, CEBPB, HR1H3, MAX, and RXRA (Figure 2.19). A weak,
reproducible, allele-specific band for rs2144300 C was observed, but it was not fully competed away with excess unlabeled rs2144300 C probe (Figure 2.18). Overall, these EMSA data suggest that these other three variants in the haplotype might exhibit differential transcription-factor binding.
2.3.10 Variants associated with GALNT2 expression
contribution of environmental factors, we performed AEI assays in 36 human hepatocyte samples
heterozygous for rs4846914. Of 142 variants in r2 > 0.2 with rs4846914 in METSIM, none are transcribed, so we used qPCR to measure relative allelic cDNA levels from GALNT2 pre-mRNA at rs4846914.
Previous studies have similarly used intronic SNPs in unspliced RNA to measure allelic expression[119, 120]. The rs4846914 A allele, which is associated with increased HDL-C, showed higher GALNT2 cDNA expression (p = 5.4 × 10⁻⁷; Figure 2.21A). When normalized to the allelic difference detected in
heterozygous genomic DNA, the A allele of rs4846914 showed a 7.4% increase in expression. Finally, we examined rs4846914 in preliminary expression-quantitative-trait-locus (eQTL) data from subcutaneous adipose tissue from 1,381 individuals in the METSIM study (M.C. and Y.W., unpublished data) and observed consistent association between the rs4846914 A allele and increased expression of GALNT2 (p = 2.2 × 10⁻¹⁴; Figure 2.21B), but not expression of 16 other potential target genes (p > 0.05/17 = 0.003 on the basis of 17 tests; Figure 2.22 and Table 2.6). Conditioning on the lead eQTL variant, rs4846922, attenuated the association signal with GALNT2 expression (p > 0.2; Figure 2.22 and Table 2.7).
2.4 Discussion
candidates, we cannot rule out the possibility that we could have missed additional functional variants in weaker LD with the lead HDL-C-associated variant. Of 14 DNA segments tested, we observed that a segment containing four variants and a separate segment containing rs2281721 showed up to 49-fold and 75-fold, respectively, more enhancer activity than did the empty-vector control. One additional element containing one SNP, rs10864726, showed more-moderate allelic differences in enhancer activity (2.5-fold [T allele] versus 1.8-fold [C allele] more than the empty vector, p = 0.003) in only the forward orientation (Figure 2.23). Compared to a vector control, the remaining 11 segments did not exhibit enhancer activity in both orientations, nor did they exhibit significant differences between alleles. These 11 segments included one of the lead GWAS SNPs, rs4846914, and the lead SNP from our fine-mapping analysis, rs17315646. These two SNPs are located in regions containing H3K4me1, H3K4me2,
H3K4me3, H3K9ac, and H3K27ac peaks in HepG2 cells and H3K4me1 peaks in adult liver cells,
demonstrating that not all GWAS variants located in regulatory elements contribute to regulatory function. Open-chromatin peaks and histone-modification and transcription-factor ChIP-seq data in liver cell types partially predicted the variants that showed regulatory activity. Variants rs4846913, rs2144300, rs1555290, and rs6143660 overlapped the most peaks (≥22 each) of any candidate variant, but
rs2281721 did not overlap any DNase or FAIRE peaks; instead, it overlapped only four
histone-modification peaks (H3K4me1, H3K4me2, H3K9ac, and H3K27ac) and one transcription-factor ChIP-seq peak (USF1). We compared our results to the Probabilistic Identification of Causal SNPs (PICS)
algorithm’s[121] prediction of candidate causal variants in this region. The variants that overlapped the most marks of open chromatin and histone modification in liver cell types (rs4846914, rs10127775, rs4846913, rs2144300, rs17315646, and rs10864726) showed the highest prediction scores, whereas the remaining 19 variants (including rs2281721) showed a prediction score of 0. Thus, testing many
candidate variants in experimental assays was necessary for identifying all variants that showed strong allelic differences in enhancer activity. We also conclude that testing all candidate variants in strong LD in combination with regulatory datasets provides the best chance of identifying regulatory variants that exhibit allelic differences in enhancer activity.
rs2281721 are also located within predicted ChromHMM[103] strong enhancer chromatin states in K562 leukemia cells from ENCODE data[72] and ChromHMM active enhancer chromatin states in multiple cell types and tissues from Roadmap Epigenomics data[73] including adipose nuclei, CD34 cells, brain, pancreas, and skeletal muscle (Figure 2.3).
One or more of the 21 candidate variants that did not show haplotype or allelic differences in enhancer activity in both orientations, especially those variants tested individually in smaller segments, might also contribute to the GALNT2 regulatory mechanism. Testing smaller segments (∼100–200 bp) in reporter assays can help with focusing on individual variants; however, these segments might fail to capture full regulatory elements. Testing larger segments can be beneficial because they could encompass a regulatory element, although segment size must be balanced with the fact that larger elements might contain both enhancer and repressor regions and mask modest allelic effects.
The observation that the 780-bp segment showed similar haplotype differences in enhancer activity in both a luciferase vector with a minimal promoter and a promoterless luciferase vector further confirms that rs4846913, rs2144300, rs1555290, and rs6143660 are located within a regulatory element that drives expression. We did not find annotated evidence of an alternative promoter or alternative splicing in this region; however, we cannot rule out alternate mechanisms. Using qRT-PCR and strand-specific primers, we detected hepatocyte and HepG2 RNA transcribed from both strands within GALNT2 intron 1 (T.R., unpublished data). This result is not unexpected, given that transcription initiation has been found to occur in both directions at both promoters and enhancers[122].
enhancer activity and GALNT2 expression in HepG2 cells. Nonetheless, our data suggest that differential binding of CEBPB to rs4846913 is one potential molecular mechanism underlying the HDL-C association.
The other candidate regulatory variants, rs2281721, rs2144300, rs1555290, and rs6143660, might also bind one or more transcription factors. Binding of USF1 to rs2281721 was allele specific in EMSAs; however, ChIP assays in HepG2 (C/T at rs2281721) and Huh-7 (C/C at rs2281721) cells suggest that USF1 binds to both alleles of rs2281721 in a native chromatin context. Therefore, USF1 might not drive the allelic differences observed in EMSAs and in HepG2 and Huh-7 cell transcriptional reporter assays. USF1 is an upstream stimulatory factor and has been shown to bind to lipid- and glucose-metabolism-related genes[129-131] and affect cholesterol homeostasis, insulin sensitivity, and body-fat mass[132]. The other three potential regulatory variants, rs2144300, rs1555290, and rs6143660, each overlap ≥13 transcription-factor ChIP-seq peaks in HepG2 cells. Future experiments will be valuable for confirming the role of CEBPB and USF1 in GALNT2 expression, identifying other transcription factors contributing to the haplotype differences in transcriptional enhancer activity, detecting physical interactions of this enhancer region, and fully characterizing this complex molecular mechanism at GALNT2.
The transcriptional reporter assays all exhibit the same direction of effect; alleles associated with increased HDL-C are also associated with increased enhancer activity. In the assay of liver AEI
the human GWAS variants is consistent with recent unpublished studies demonstrating that total loss of function of GALNT2 in humans, mice, rats, and cynomolgus monkeys consistently results in lower HDL-C (S. Khetarpal, D. Rader, personal communication). GALNT2 remains a likely candidate gene, considering the association between the GWAS variants and GALNT2 expression, but not expression of 16 other potential target genes within 1 Mb in samples of subcutaneous adipose tissue. However, the regulatory variants we identified might also act to increase expression of other nearby genes that might contribute to the HDL-C association signal. Identification of the functional variants responsible for the human GWAS signal can provide further understanding of the direction of effect in humans and lead to a greater insight into the molecular mechanisms of how these variants might influence gene expression and function.
In the METSIM cohort, the studied variants were most strongly associated with traits correlated with total cholesterol in medium HDL, including cholesterol esters in medium HDL (r2 = 1.0),
concentrations of medium HDL particles (>0.9), phospholipids in medium HDL (>0.9), and free cholesterol in medium HDL (>0.9). Sub-phenotype associations can provide additional insight into the function of GWAS loci[136]. GALNT2 might act during specific steps of HDL-particle formation or remodeling by directly glycosylating lipid modifiers or enzymes, such as ANGPTL3[100] or LIPG, an enzyme that has been shown to hydrolyze phospholipids in HDL[137, 138] and remodel HDL particles[138]. More work is necessary for determining the mechanism(s) by which GALNT2 might influence the size of HDL particles.
Overall, this study demonstrates multiple lines of evidence suggesting that at least two regulatory variants might act to regulate expression of GALNT2, a gene involved in HDL-C metabolism (Figure 2.25). The eQTL and AEI data clarify the direction of effect by which the GWAS variants act. Our study joins a growing set of studies that implicate multiple functional regulatory variants at a GWAS locus[139, 140], highlighting the complexity of molecular mechanisms underlying GWAS loci, and emphasizes that multiple common functional regulatory variants might work in concert.
2.5 Conflicts of interest
Figure 2.1 Non-coding variants at GALNT2 are associated with total cholesterol in medium HDL in the METSIM study
The entire initial association signal (upper panel) was reduced after conditioning on lead SNP rs17315646 (lower panel). Circles represent genotyped and imputed DNA variants and their LD r2 values with
rs17315646 in the METSIM study (2,079 variants are shown). Chromosome coordinates correspond to UCSC Genome Browser build hg19. The left y axis indicates the −log10(p value), the right y axis indicates
Figure 2.2 HDL-C-associated variants overlap open chromatin and histone modifications indicating potential regulatory regions in GALNT2 intron 1
Figure 2.3 HDL-C associated variants overlap open chromatin, histone modifications, and predicted enhancer and transcribed chromatin states in liver cell types identifying potential regulatory regions in GALNT2 intron 1
A 13.7-kb region includes all 24 variants in strong linkage disequilibrium (r2>.7) with the
Figure 2.4 Two of 14 elements containing variants in strong linkage disequilibrium (r2 > 0.7) with rs4846914 show allelic or haplotype differences in transcriptional enhancer activity in both orientations