Predictors of Students At-Risk for Writing Problems:
The Development of Written Expression for Early Elementary School Children
Lara-Jeane Croker Costa
A thesis submitted to the faculty of the University of North Carolina at Chapel Hill in partial fulfillment of the requirements for the degree of Master of Arts in the School of Education of
Educational Psychology, Measurement, and Evaluation.
Chapel Hill 2008
Approved by
©2008
ABSTRACT
LARA-JEANE CROKER COSTA: Predictors of Students At-Risk for Writing Problems: The Development of Written Expression for Early Elementary School Children
(Under the direction of Dr. Jeffrey A. Greene)
In this study, cognitive variables (i.e., transcription skills, working memory, executive functioning, linguistic skills, gender, & ethnicity) were examined to determine which
predicted the likelihood of first grade students being at-risk for writing difficulties. The Not-So-Simple View of Writing, developed by Berninger and Winn (2006), was used as a guide to determine which cognitive predictors to investigate. The sample consisted of 101
American first graders from one school district in the southeastern part of the country. These students were administered a battery of measures to assess their writing skills and cognitive processes. Principal axis factoring analyses resulted in eight factors that included 15 of the 18 original measures. The logistic regression results suggested that linguistic coordination, attentional control, nonverbal working memory, and verbal working memory were predictive of at-risk status. Further, a girl’s memory and retrieval skill was also a predictor.
ACKNOWLEDGEMENTS To all of the people who helped make this thesis possible…
First and foremost, I wish to thank my mentor, Dr. Jeffrey Greene for his guidance, encouragement, patience, and endless feedback. His sincere devotions to mentoring and learning have been a great inspiration to me. Jeff, thank you for challenging me and allowing me to challenge myself throughout this process.
Thank you Dr. William Ware and Dr. Stephen Hooper for your helpful insights, comments, and suggestions as members of my committee. Also, thank you Dr. Ware for teaching me to understand statistics, not just how to compute them and thank you Dr. Hooper for giving me the opportunity to be a part of the Writing Skills Development project team.
To Donna Yerby I extend a big thank you for believing in me and my skills as an educator. I am grateful for all of the opportunities you have given me, not to mention your wisdom and friendship. I would also like to thank Kathleen Anderson for her patience and kindness while I was learning about the daily grind of research.
Thanks so much to my fellow graduate students: Karyl Askew, Amy Childress, Vic Deekens, Sean Knuth, Jane Robertson, and Meredith Craver Walton who provided invaluable support and suggestions throughout this process.
TABLE OF CONTENTS
LIST OF TABLES ... x
LIST OF FIGURES ... xii
Chapter I. INTRODUCTION ...1
Current Status of American Children's Writing Ability ...2
Conclusion ... 4
II. WRITTEN EXPRESSION ...6
Models of Written Expression ... 6
Hayes and Flower’s (1980) Cognitive Process Model ... 7
Hayes’ Revised Model (1996) ... 9
Juel, Griffith, and Gough’s Simple View of Writing... 11
Berninger and Colleagues Simple View of Writing ... 12
Berninger and Winn’s Not-So-Simple View of Writing (2006)... 14
Cognitive Processes Contributing to the Development of Written Expression... 16
Influence of Transcription Upon Writing ... 16
Influence of Working Memory Upon Writing... 17
Influence of Executive Functioning Upon Writing ... 17
Influence of Linguistic Skills Upon Writing ... 19
Present Study ... 21
III. METHODS ...24
Participants... 24
Procedure ... 27
Measures ... 28
At-risk and Typical ... 28
Predictor Measures... 29
Data Analysis ... 36
Descriptive Statistics... 36
Data Preparation... 37
Logistic Regression... 41
IV. RESULTS ... 44
Descriptives... 44
Preliminary Analysis: Variable Creation ... 48
Transcription ... 48
Linguistic ... 50
Working Memory... 53
Planning and Efficiency... 55
Memory and Retrieval ... 58
Logistic Regression... 61
V. DISCUSSION ... 73
Limitations ... 75
Implications... 77
Conclusions... 79
APPENDIX A...81
LIST OF TABLES Table
1. Demographic Characteristics of the Sample...26
2. WRAML-2 Reliability Alpha Coefficients ...34
3. Vigil CPT Reliability Estimates...36
4. Predictor Variables...38
5. Univariate Descriptive Statistics...45
6. Correlation Matrix ...47
7. Transcription Factor Matrix 1...48
8. Transcription Pattern Matrix...49
9. Transcription Factor Matrix 2...49
10.Transcription Total Variance Explained...50
11.Linguistic Factor Matrix ...51
12.Linguistic Pattern Matrix 1 ...51
13.Linguistic Pattern Matrix 2 ...52
14.Linguistic Total Variance Explained ...53
15.Working Memory Factor Matrix ...53
16.Working Memory Pattern Matrix ...54
17.Working Memory Total Variance Explained ...55
18.Planning and Efficiency Factor Matrix...55
19.Planning and Efficiency Pattern Matrix...56
22.Memory and Retrieval Factor Matrix 2 ...59
23.Memory and Retrieval Pattern Matrix ...59
24.Memory and Retrieval Factor Matrix 3 ...60
25.Memory and Retrieval Total Variance Explained ...60
26.Data Reduction Summary ...61
27.Constant Only Model ...62
28.Chi-Square Statistics for Interactions ...63
29.Chi-Square Statistics for Main Effects & Interactions Removed From Final Model..65
30.Final Model Classification Table...65
31.Logistic Regression Models with Change in Odds...66
LIST OF FIGURES Figure
1. The Hayes-Flower Model (1980) Redrawn for clarification ...9
2. Hayes’ Model...10
3. Simple View of Writing Model ...13
4. Not-So-Simple View of Writing Model ...15
CHAPTER 1 INTRODUCTION
The ability to communicate language through symbols (e.g., alphabet, characters) is an important skill for children to develop; however, written expression is a difficult and challenging process to learn (Lienemann, Graham, Leader-Janssen, & Reid, 2006). Writing provides a visual documentation of communication that allows thoughts, ideas, facts, and stories to be recorded for later use. It is a complex skill unique to humans that encompasses many sub-skills (e.g., spelling, handwriting, grammar, organization). In addition, written expression is moderately correlated with several other language systems such as reading comprehension, oral expression, and listening comprehension, while also encompassing unique, changing neuropsychological processes (Berninger et al., 2006). Hayes (1996) stated:
Indeed, writing depends on an appropriate combination of cognitive, affective, social, and physical conditions if it is to happen at all. Writing is a
communicative act that requires a social context and a medium. It is a generative activity requiring motivation, and it is an intellectual activity requiring cognitive processes and memory. (p. 5)
Writing is the primary tool for expressing knowledge and one of the main response outputs that teachers use to assess their students’ educational performance (Graham & Harris, 2004). Because students use writing to collect and organize material, share and remember information and ultimately to acquire and demonstrate knowledge, the academic
In order to write, a person must have an idea, know the meaning of the symbols (e.g., hieroglyphics, Roman alphabet), translate the idea to symbols, and have the ability to form the symbols. Further, the writer needs to comprehend the structure (i.e., sentence, paragraph, and text), content (i.e., ideas and their relationships), and purpose (i.e., writer’s goals and audience) of the writing process (Collins & Gentner, 1980). Hayes and Flower (1986) describe planning (i.e., generating, organizing, and goal setting), translating (i.e., sentence generation), and reviewing (i.e., reviewing and editing) as the three most important cognitive processes used in writing. Skilled writers use cognitive processes (i.e., planning, translating, reviewing, self-regulation) to manage the writing task (Graham & Harris, 1996), and they are more likely to be concerned with the meaning of their text than spelling and grammar
(Hooper, Swartz, Wakely, de Kruif, & Montgomery, 2002). In addition, skilled writers are fluent in text production processes (i.e., text generation and transcription) and are
knowledgeable about writing (e.g., content, genres; McCutchen, 2006).
Current Status of American Children’s Writing Ability
Educational changes are needed to improve writing performance. Fortunately, teachers, school systems, and researchers are attentive to the importance and challenges of written expression (Hooper, 2002). Further, the National Commission on Writing for America’s Families, Schools, and Colleges has taken on the challenge of improving the writing skills of students. This organization has conducted research on the importance of writing, in addition to increasing public awareness and meeting with educators nationwide (College Board, 2006). Even with the efforts of educational researchers, instructional practitioners, national organizations (e.g., National Writing Project), and university based centers (e.g., Center for the Study of Development and Learning, UNC-Chapel Hill), little emphasis has been placed on understanding children at-risk for writing difficulties
(Berninger et al., 2002; Graham & Harris, 2005).
Research on the cognitive processes related to the development of writing skills at the elementary school level began 25 years ago (Wong & Berninger, 2004). However, the
primary factors related to writing disorders have yet to be identified (Edwards, 2003; Hooper, Wakely, deKruif, & Swartz, 2006). Research by Graham and Harris (1996) suggests that students with writing difficulties do little planning and revision, and frequently just write down any information that may be relevant to the topic, paying little attention to the intended audience or text organization. In addition, poor writers tend to produce texts that lack clarity as well as being shorter, poorly organized, and less interesting than good writers (Hooper et al., 2002).
students at-risk for writing difficulties is a must because the process of writing is developmental and takes many years to master (Berninger et al., 2002). Therefore, it is necessary to get it right from the start. Furthermore, frequent assessment of students’ writing development is required to recognize their strengths and needs (Berninger & Winn, 2006).
In their Not-So-Simple View of Writing model, Berninger and Winn (2006) identify and describe the multiple components of beginning and developing writers’ interactive “internal functional writing system” (p. 96) and suggest that all the components (i.e., transcription, executive functions, working memory, and text generation) interact and
develop within the writer’s brain. Berninger and Amtmann (2003) explained how the writing components develop, beginning with transcription skills (i.e., handwriting and spelling), and then executive functions, both supporting text generation. Berninger and Winn’s (2006) Not-So-Simple View of Writing model is relevant for identifying, assessing, and teaching
students at-risk for problems in the development of writing skills because it incorporates both the low-level (e.g., transcription) and high-level (e.g., linguistic) cognitive skills thought to be used during writing (Abbott & Berninger, 1993; Berninger, 2000; Berninger & Amtmann, 2003; Berninger & Winn, 2006).
Conclusion
Research to date demonstrates various relationships between the development of written expression with transcription (e.g., Graham & Harris, 2005), executive functions (e.g., Hooper et al., 2002), working memory (e.g., Swanson & Berninger, 1996), and linguistic skills (e.g., Berninger et al., 1992). However, it has not been determined which processes are best for predicting at-risk status. Furthermore, the majority of research on writing skills with primary school children is with third, fourth, or fifth graders, not first graders. Research with first graders is needed to enable educators and professionals to identify at-risk students early so that the student can begin to receive the guidance necessary to succeed.
I used the Not-So-Simple View of Writing (Berninger & Winn, 2006) to identify the cognitive processes associated with writing development, and evaluated which of these cognitive processes influence the likelihood of first grade students being classified as at-risk for writing difficulties. Specifically, I investigated whether individual differences in
transcription skills (i.e., graphomotor function and spelling), working memory (i.e., auditory and non-verbal), memory and retrieval (i.e., visual and auditory short-term and delayed), planning and efficiency (e.g., planning, verbal fluency, and attention), and linguistic
functions (i.e., orthographic processing, phonological awareness, and receptive vocabulary) predicted at-risk status. In addition, I determined if gender and ethnicity differences predicted the likelihood of at-risk status. The results of this study will help parents, teachers, and other professionals recognize first grade students at-risk for typical development of written
CHAPTER 2 WRITTEN EXPRESSION
In this thesis I used the Not-So-Simple View of Writing (Berninger & Winn, 2006) to identify the cognitive processes associated with writing development, and evaluated which of these cognitive processes predicted first grade students being classified as at-risk for writing difficulties. In addition, I examined whether gender or ethnicity differences predicted the likelihood of at-risk status. The results of this research will help professionals assess and identify students at-risk for problems in the development of written expression. In turn such findings should influence decisions regarding instruction and interventions.
First, I will describe several models of written expression (i.e., Hayes and Flower’s Cognitive Process Model, 1980; Juel, Griffith, and Gough’s simple view of writing, 1986; Hayes’ Revised Model, 1996; Berninger and colleagues’ simple view of writing) that influenced the development of the Not-So-Simple View of Writing (Berninger & Winn, 2006). Then, I will describe the Not-So-Simple View of Writing (Berninger & Winn, 2006) and its connection to my study. After that I will review the cognitive processes and the empirical evidence regarding the relation between these cognitive processes and writing. Also, I will provide empirical research about gender, ethnicity and writing. Finally, I will discuss the present study.
Models of Written Expression
Whitacker, 1996). Traditional methods of teaching writing use a prescriptive plan where the teacher provides the students an example of good writing with key factors and its
organization highlighted (Nystrand, 2006). Then students apply their own knowledge and skills in the construction of a final written product. This product perspective has provided important information about the nature (e.g., predictable pattern) of writing development (e.g., from random scribbling to sentences); however the majority of understanding about writing development has come from the research centered around the processes involved with writing (Berninger et al., 1996).
During the second half of the 20th century writing began to be viewed and taught as an active, meaning-making process (Nystrand, 2006). Cognitive process research and the understanding of the links among writing, thinking, and learning influenced the development of the process approach to writing (Hayes & Flower, 1986). In the process approach,
students generate and discuss many ideas, and then judge them on their appropriateness. Then students create drafts, engage in editing, and then revise. After the students decide all the necessary changes have been made, the final written draft is ready for submission. Cognitive process research influenced models of written language including the Hayes and Flower’s (1980) Cognitive Process Model, the Juel, Griffith, and Gough’s simple view of writing (1986), Hayes’ Revised Model (1996), Berninger and colleagues simple view of writing, and Berninger and Winn’s (2006) Not-So-Simple-View of Writing.
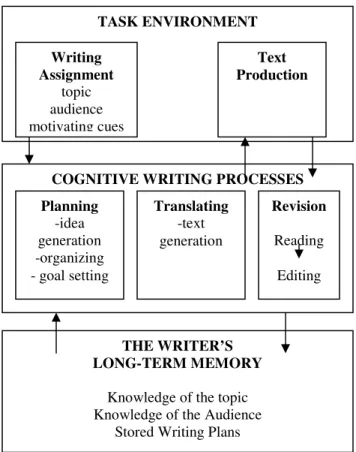
Hayes and Flower’s (1980) Cognitive Process Model
Figure 1, describes a complex problem solving process operating within the task environment and the writer’s long-term memory (Hayes, 1996; Hayes & Flower, 1980). The task
environment includes the social (e.g., teacher’s writing assignment) and physical factors (e.g., text the writer produced) involved in writing where the writer uses long-term memory to incorporate knowledge about the topic, audience, and writing plans.
TASK ENVIRONMENT
Hayes’ Revised Model (1996)
In 1996, Hayes published a revised framework of the original Hayes-Flowers (1980) model (see Figure 2). He described this framework as a work in progress, needing to be revised and extended as more knowledge is gained (Hayes, 1996). Even though the model is evolving, it provides a timely, research-based representation of the writing components and their processes. In contrast to the old model, the new model includes just two interactive components, the task environment (i.e., social and physical) and the individual (i.e.,
motivation/affect, working memory, long-term memory, and cognitive processes). This more comprehensive model emphasizes the essential function of working memory, and
incorporates visual-spatial mechanisms and motivation. In addition, it provides new and more specific representations for the cognitive processes including text interpretation (i.e.,
COGNITIVE WRITING PROCESSES
Planning -idea generation -organizing - goal setting
Translating -text generation
THE WRITER’S LONG-TERM MEMORY
Knowledge of the topic Knowledge of the Audience
Stored Writing Plans Writing Assignment topic audience motivating cues Text Production Revision Reading Editing
reading, listening, and scanning), reflection (i.e., problem solving, decision making, and inferencing), and text production (i.e., producing written, spoken, or graphic output from internal representations; Hayes, 1996).
THE TASK ENVIRONMENT
The Social Environment The Physical Environment
The audience
Collaborators
The text so far
The composing medium
THE INDIVIDUAL
MOTIVATION/AFFECT
Goals
Predispositions
Beliefs and Attitudes
Recently, Hooper and colleagues (Hooper et al., 2006) employed Hayes’ model to investigate written expression subtypes and a metacogntive intervention for writing performance of fourth and fifth graders. This study found seven subtypes of written expression: four normal variants, a problem solving weakness, one problem solving
language weakness, and a problem solving strength. Overall the writing improvements across subtypes were moderate. The investigators suggested that one possible reason for the
moderate results is that the intervention, based on the Hayes’ model, might have not been developmentally appropriate for the majority of the participants, (i.e., the younger students).
Juel, Griffith, and Gough’s Simple View of Writing
There is no doubt that the Hayes and Flower (1980) model has been influential; however, it was developed using research with college students and adults, many of whom were skilled writers (Berninger, et al., 1996; Wakely et al., 2006; Wong & Berninger, 2004). On the other hand, Juel, Griffith, and Gough’s (1986) simple view of writing model used the process view of writing to explain how writing skills develop in primary grade children. Their model has two components: a) spelling and b) ideation (i.e., generation and
(1986) model, to create an improved model where they explain writing skills development for primary school children.
Berninger and Colleagues’ Simple View of Writing
In 1994 and 1995, Berninger and colleagues (Berninger, 1996; Berninger, Abbott, Whitaker, Sylvester, & Nolan, 1995; Whitaker & Berninger, 1994, 1995;) proposed
modifications to the Hayes and Flower (1980) model using their research with primary grade students (Berninger et al., 1996). Several years later, Berninger (2000) elaborated upon the simple view of writing proposed by Juel and colleagues (1986) and incorporated the modifications to the Hayes and Flowers (1980) model to generate a new developmental model of beginning writing also called the Simple View of Writing. Berninger created this model to supplement product and process approaches to writing development by
incorporating research on lower-level neurodevelopment skills with higher-order linguistic skills and cognitive processes (Abbott & Berninger, 1993; Berninger et al., 1992).
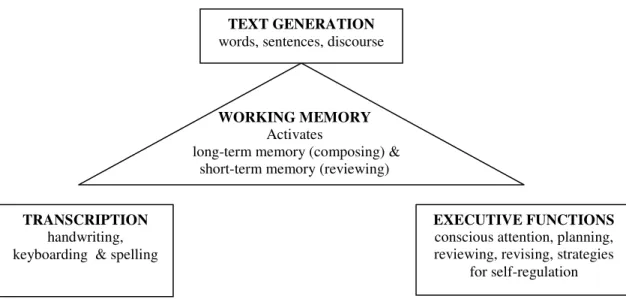
Berninger’s Simple View of Writing model is represented in Figure 3 by an equilateral triangle where transcription and executive functions are the two primary components located at the two points of the base (Wong & Berninger, 2004); together they support text
WORKING MEMORY Activates
long-term memory (composing) & short-term memory (reviewing)
Figure 3 Simple View of Writing Model (Berninger & Amtmann, 2003)
Components. During the writing process information from short-term memory and long-term memory is stored briefly in working memory (Berninger, 2000; Swanson &
Berninger, 1996). Specifically short-term memory is activated during reviewing and revising, and long-term memory is activated during text generation (i.e., composing). Executive functions used during text generation include planning, reviewing, and revising. They can be used prior to and during composing or revising, and after a draft is finished. The writer can be focused upon a part of the text or the entire composition (Berninger, 2000; Berninger et al., 1996). Also, the writer self-regulates by using strategies to begin and maintain the writing process.
Unlike the Hayes-Flower (1980) model, translating cognitive processes are divided into transcription and text generation. Transcription is the coordination of handwriting (i.e., producing letters) and spelling (i.e., producing words). Text generation (i.e., word, sentence, and text) is a dynamic process where ideas are produced and represented as language in memory (Berninger, 2000). These separate skills allow the writer to transform language into orthographic symbols (Berninger & Amtmann, 2003; Berninger et al., 1996).
TEXT GENERATION words, sentences, discourse
TRANSCRIPTION handwriting, keyboarding & spelling
EXECUTIVE FUNCTIONS conscious attention, planning, reviewing, revising, strategies
Development of writing. Handwriting and spelling skills provide the foundation for early writing development. Children’s handwriting develops specifically for language expression and not for other activities such as drawing (Berninger, 2000). As children develop phonemic awareness and gain understanding of the alphabetic principle, they apply this knowledge to written spelling.
Text generation occurs when children learn to produce letters (Berninger, 2000). Beginning writers use invented spelling (i.e., an attempt to spell correctly) to compose simple and complex sentences. Also, in early writing development, students rely on others’
guidance to engage executive functions, while later they rely more on self-regulation during text generation and process management (Berninger & Amtmann, 2003).
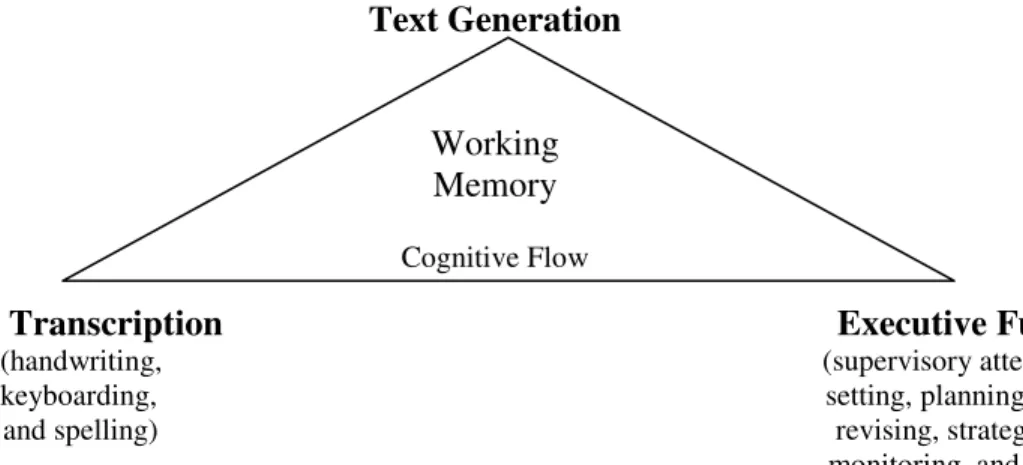
Berninger and Winn’s Not-So-Simple View of Writing (2006)
Most recently, Berninger and Winn (2006) elaborated upon the simple view of
writing model, which is justifiably now called the Not-So-Simple View of Writing. The basic components (i.e., transcription, executive functions, working memory, and text generation) and structure (see Figure 4) are the same as Berninger’s (2000) simple view of writing; however, new research about technology and the brain has been used to update the model. In both models, executive functions are identified and working memory activates long-term and short-term memory, but in the new model these multiple components and their related
phonological, and morphological), a phonological loop, and executive supports (i.e., linking verbal working memory with executive functions and non-verbal working memory).
The Simple View of Writing included conscious attention as one of the executive functions. In the Not-So-Simple View there is a complex system called supervisory attention that focuses attention on relevant information and prevents attention to irrelevant
information. This system also regulates focused attention by changing attention between mental sets, attention maintenance (e.g., staying on task), conscious attention (e.g.,
metalinguistic and metacognitive awareness), cognitive presence, and cognitive engagement (Berninger & Winn, 2006).
Text Generation Working Memory Cognitive Flow
Transcription Executive Functions (handwriting, (supervisory attention, goal keyboarding, setting, planning, reviewing,
and spelling) revising, strategies for self- monitoring, and regulation)
Figure 4 Not-So-Simple View of Writing Model (Berninger & Winn, 2006)
Berninger and Winn’s (2006) Not-So-Simple View of Writing model provided the structure for the design of my research study and also a description of the cognitive writing processes I was interested in studying. They suggest that students at-risk for writing
difficulties may differ from typically performing students in terms of their transcription skills (i.e., fine motor function and spelling), working memory (i.e., auditory and non-auditory), memory and retrieval (i.e., visual and auditory short-term and delayed), planning and efficiency (e.g., planning, verbal fluency, and attention), and linguistic functions (i.e., orthographic processing, phonological awareness, and receptive vocabulary).
Cognitive Processes Contributing to the Development of Written Expression
Based on the Not-So-Simple View of Writing model (Berninger and Winn, 2006), there appear to be a number of cognitive processes that can contribute to the development of written expression. In this section, I present empirical evidence regarding the influences of transcription, working memory, executive functioning, and linguistic skills have upon writing. Also, I provide findings regarding gender, ethnicity, and writing.
Influence of Transcription Upon Writing
Transcription is the process of representing sounds as symbols using handwriting and spelling skills. Handwriting and spelling are separate skills, but are used together to translate oral language to written language (Berninger, 2000). Twenty years ago, Juel (1988) found that spelling posed the biggest problem for poor writers in first grade. Furthermore, Graham and colleagues (Graham, Berninger, Abbott, Abbott, & Whitaker, 1997) found that
development for primary grade students. Understanding this connection will help educators create effective interventions for students at-risk for writing difficulties.
Influence of Working Memory Upon Writing
Another influence upon the development of written expression which is included in many theoretical models (e.g., Berninger and Winn, 2006; Hayes, 1996; Kellogg, 1996) is working memory. Working memory has been shown to be a significant predictor of text-generation (Swanson & Berninger, 1996). Baddeley and colleagues (Baddeley, 2003; Baddeley & Larsen, 2007) describe working memory as a cognitive system involving temporary storage that uses manipulation of information during complex tasks.
The limited capacity of working memory makes writing a challenging task for anyone due to the multiple processes (e.g., planning, revising) used in writing (McCutchen, 2006). In addition, writing puts more demands upon working memory than oral communication
(Bourdin & Fayol, 2000) because transcription skills must be coordinated within the limited confines of working memory (Berninger, 2000; McCutchen, Covill, Hoyne, & Mildes, 1994). Furthermore, transcription processes that are not fluent place a significant demand on
working memory (McCutchen, 1996). On the other hand, fluency in text production can increase the amount of working memory available for higher level writing processes (McCutchen, 2006). Thus, it seems reasonable to suppose that differences in working memory capacity would be related to writing performance in younger students learning to write.
Influence of Executive Functioning Upon Writing
Differences in writing skills can be explained in part by differences in working
efficiency of the central executive processes (Miyake, Friedman, Rettinger, Shah, & Hegarty, 2001). Central executive processes can be defined as “a set of general-purpose control
processes” (Miyake et al.,2001).
Repovš and Baddley (2006) described the multi-component model of working memory such that the central executive has distinguishable functions for manipulating information in working memory. These functions include the abilities to focus, divide and switch attention, and relate the contents of working memory to long-term memory (Repovš & Baddley, 2006). Further, executive functions aid in successful performance by providing attentional control and integration of information (Repovš & Baddley, 2006). Specifically in writing, the central executive processes include planning, translating, programming, reading, and editing (Kellogg, 1996). The efficiency of these processes plays a role in determining the capacity of working memory (Miyake et al., 2001).
Some research has been conducted examining the relationship between written expression and executive functions. For instance, Hooper and colleagues found statistically significant differences in working memory (i.e., initiation of behavior) and problem solving efficiency (i.e., set shifting) when comparing good and poor writers in fourth and fifth
memory and executive functioning separately (Miyake et al., 2001). Even though text generation and the organization of the writing process are thought to be influenced by executive functions (Berninger & Amtmann, 2003), there is little empirical research on this relationship in younger students (Hooper et al., 2002). Further, there is little evidence regarding the role of executive functions in writing development of elementary school children at–risk for writing difficulties.
Influence of Linguistic Skills Upon Writing
Linguistic skills are the foundation of more complex writing skills (Wakely et al., 2006). Linguistic components include phonology (i.e., sound system for language), orthography (i.e., writing letters and spelling), grammar (i.e., sentence construction), and semantics (i.e., meaning in language). Grammar includes two components: morphology (i.e., word formation) and syntax (i.e., sentence formation). Each of these linguistic components represents skills needed to communicate through writing.
expression through the derivation of multiple subtypes of written expression in typical elementary school children (e.g., low grammar, poor text quality, problem solving language weakness, problem solving strength). Based on this research, I speculate that linguistic skills will be a strong predictor of the likelihood of early elementary students being identified as at-risk for writing difficulties.
Gender, Ethnicity, and Writing
Within the field of written expression, gender and ethnicity differences have not been systematically examined with early elementary school students, although a few studies have explored these topics. Swanson and Berninger (1996) investigated individual differences in working memory and writing skill, but they did not find statistically significant gender differences for memory performance. However, they did find statistically significant gender differences on the reading measures (i.e., word identification, word recognition, and reading comprehension), and the writing measures (e.g., spelling, number of words, number of clauses, quality), with females being better readers and writers than males. More recently, Hooper and colleagues (2002) studied executive functions in children with and without writing problems, and did not find any statistically significant differences in terms of gender or ethnicity.
Present Study
Many cognitive processes are posited to influence written expression development including transcription skills (Berninger et al., 2006; Berninger & Amtmann, 2003; Edwards, 2003), working memory (Hayes, 2006; Swanson & Berninger, 1996), executive functioning (Hooper et al., 2002), attention (Repovš & Baddeley, 2006), and linguistic functions (Abbott & Berninger, 1993; Berninger et al., 1992). In their Not-So-Simple View of Writing model, Berninger and Winn (2006) described the relationships and links among these processes. In addition, they suggest that deficiencies in these processes can be used to predict which first grade students may be at-risk for problems in the development of writing skills, although little empirical evidence exists.
This study is part of a longitudinal project based on the latest advances in cognitive science and neuroscience. The researchers aim to collect empirical evidence to further
Overall Research Question: Are individual differences on the cognitive processes posited in the Not-So-Simple View of Writing (Berninger & Winn, 2006), gender, or ethnicity predictive of the likelihood of first grade students being at-risk for writing difficulties, as measured by their achievement on the WIAT-II written expression subtest?
Based on prior research I have generated these hypotheses:
Hypothesis 1: First grade students with lower measured linguistic ability will be more likely to be classified as at-risk, as opposed to typical, for writing difficulties.
Hypothesis 2: First grade students with lower measured transcription ability will be more likely to be classified as at-risk, as opposed to typical, for writing difficulties.
Hypothesis 3: First grade students with lower measured working memory will be more likely to be classified as at-risk, as opposed to typical, for writing difficulties.
Hypothesis 4: First grade students with lower measured planning and efficiency will be more likely to be classified as at-risk, as opposed to typical, for writing difficulties.
Hypothesis 5: First grade students with lower measured memory and retrieval will be more likely to be classified as at-risk, as opposed to typical, for writing difficulties.
Hypothesis 6: Transcription and linguistic skills, as opposed to working memory, planning and efficiency, and memory and retrieval, will be stronger predictors of the likelihood of first grade students being at-risk for writing difficulties.
Hypothesis 7: First grade male students will be more likely than females to be classified as at-risk, as opposed to typical, for writing difficulties.
Hypothesis 9: Gender will moderate the relations among the other predictor variables (i.e., linguistic skills, transcription skills, working memory, planning and efficiency, memory and retrieval) and the likelihood of first grade students being at-risk for writing difficulties.
Hypothesis 10: Ethnicity will moderate the relations among the other predictor variables (i.e., linguistic skills, transcription skills, working memory, planning and
CHAPTER 3 METHODS
Participants
The sampling frame for this study was a single suburban-rural public school district in the southeastern part of the US. The decision to select only one school district was made in order to minimize potential problems related to differences that can exist in systems across curriculum implementation and instructional philosophies. Each of the seven elementary school principals in the district agreed to participate in the study. Altogether 476 students in 27 first-grade classes were initially screened for potential participation using the Written Language Expression Subtest from the Wechsler Individual Achievement Test-II (WIAT-II; Psychological Corporation, 2002). Also, this assessment was used to determine at-risk status.
Participants were selected by first recruiting students who received the lowest scores on the WIAT Written Expression score, as mandated by the public school administration. A letter describing the study, two consent forms, and a flyer were sent with the students to 252 families whose children met the at-risk screening criteria. Overall, 328 students including all students who met the at-risk criteria during screening were recruited to participate in the study, and of those 118 signed consent forms were received. Seventeen students were dropped due to scheduling conflicts.
Table 1
Demographic Characteristics of the Sample
AT-RISK TYPICAL TOTAL
Variable Frequency % Frequency % Frequency %
Age (years)
6 35 54.7 26 70.3 50 49.5
7 26 40.6 11 29.7 48 47.5
8 3 4.7 0 0.0 3 3.0
Gender
Female 21 32.8 17 45.9 38 37.6
Male 43 67.2 20 54.1 63 62.4
Ethnicity
African American 16 25.0 3 8.1 19 18.8
Asian American 0 0.0 1 2.7 1 1.0
Bi-racial 0 0.0 1 2.7 1 1.0
European American 38 59.4 28 75.7 66 65.3
Hispanic/Latino 9 14.1 4 10.8 13 12.9
Native American/Alaskan Native 1 1.5 0 0.0 1 1.0
Procedure
For the initial screening, each of the 27 first grade classes in the school district were group administered the WIAT II Written Expression subtest. The results were used to preliminarily group students as typical or at-risk for selection purposes. All participants (i.e., at-risk and typical) received a battery of neuropsychological and cognitive assessments. Each measure was administered, scored, and standardized according to the instructions in the published test manuals. All responses were scored by trained researchers and graduate students and double checked by a graduate student in the School Psychology doctoral
program at the University of North Carolina at Chapel Hill. The raw scores were entered and standardized (e.g., standard score, scaled score) by the Frank Porter Graham Child
Development Institute (FPG) Data Management and Analysis Center.
In an effort to control for order effects, the assessment measures were divided
between two administration blocks. Block A (i.e., WASI Vocabulary and Matrix Reasoning, WIAT-IIA Word Reading, Spelling, and Written Expression, PAL Finger Succession, RAN Letters or Digits, and Word Choice, PPVT-IV, and WISC-IV PI Spatial Span) assessments were administered in any order. However, Block B (WRAML-2 Picture Memory Immediate, CTOPP Elision, WJ-III Planning & Retrieval Fluency, WRAML-2 Picture Memory
Recognition, WRAML-2 Story Memory Immediate, VIGIL CPT, CTOPP Nonword
Measures At-risk and Typical
The Wechsler Individual Achievement Test-Second Edition form A (WIAT-IIA; Wechsler, 2002) is an assessment used to measure individual achievement skills.
Specifically, the Written Expression subtest measures handwriting, timed alphabet writing, written word fluency, and sentence combining. The participant is given 15 seconds to write the lower case letters of the alphabet and 60 seconds to write words related to a topic. Finally, the participant is asked to combine two simple sentences into one well written sentence with the same meaning. The Spelling subtest requires students in grade 1 to demonstrate single letter, multiple letter, and single word production. It measures alphabet principle and written spelling of regular words, irregular words, and homonyms. Subtest age and grade based raw and standard scores were generated in addition to the Written Language Composite (i.e., Spelling and Written Expression subtests).
The Written Expression subtest scores were used to identify students as either typical or at-risk for writing skills problems. Text generation is one of the major components of written expression and is assessed by this measure. Additionally, the timed alphabet writing task is a strong predictor of handwriting, spelling, and writing skills acquisition for students in elementary school (Berninger et al., 1992). Past reported interitem reliability for this subtest score was strong (r = .91; Wechsler, 2002) for students in grade one.
identified as at-risk; otherwise they were identified as typical. Various types of evidences were collected for the validity of the WIAT-II subtests’ scores (i.e., Written Expression and Spelling) including content (e.g., expert judgments and empirical item analysis), construct (e.g., intercorrelations of the subtests, correlations with measures of ability, studies of group differences), and criterion (e.g., correlations with other achievement tests).
Predictor Measures
Transcription. There were two measures used to capture various aspects of the students’ transcription skills. The first, The Process Assessment of the Learner: Test Battery for Reading and Writing (PAL-RW; Berninger, 2001) is intended to measure the
neurodevelopment processes (e.g., orthographic skills, phonological skills, rapid automatic naming, phonological decoding, word-specific representations, finger-function skills) a child uses while reading and writing. The Finger Sense-Succession Dominant (FSSD) and
groups, correlations with other psychoeducational assessments), and criterion (e.g., studies with preliminary versions of the measure).
The second transcription measure, the WIAT-IIA (Wechsler, 2002) Spelling subtest (SPEL) requires students in grade 1 to demonstrate single letter, multiple letter, and single word production. It measures the students’ understanding of the alphabet principle and written spelling of regular words, irregular words, and homonyms. Past reported interitem reliability for this subtest score was strong (r = .94; Wechsler, 2002) for students in grade one.
Linguistic. Four measures were used to assess the students’ linguistic ability. First, the PAL-RW Rapid Automized Naming Letters subtest (LETT) and second, the Word Choice subtest (WORD) were administered (Berninger, 2001). The RAN task measures orthographic-phonological coordination through rapid automized naming of letters. In a timed setting, the child is asked to quickly and accurately name aloud familiar letters and letter groups. A raw score and decile are generated. Past reported stability coefficients for this task’s scores were strong (letters r = .92, digits r = .84; Berninger, 2001).
Third, the Comprehensive Test of Phonological Processing (CTOPP) Elision Subtest (ELIS; Wagner, Torgesen, & Rashotle, 1999) was administered to measure basic
phonological awareness by asking the child to segment spoken words into smaller parts. The examiner asks the child to repeat a word and then say a word with part of it left out (e.g., examiner states, “say bold, now say bold without saying /b/”). A raw score and scaled score are generated. Past reported content sampling alpha coefficients for this subtest’s scores were strong (age 6 α = .92, age 7 α = .91, age 8 α= .89; Wagner et al., 1999). Several types of
evidences were collected for the validity of the CTOPP subtests’ scores (i.e., ELIS and NWR) including content (e.g., rationale for item selection, item analysis, and differential item functioning analysis), criterion (e.g., studies with preliminary versions of the measure), and construct (e.g., confirmatory factor analysis).
The final linguistic measure, The Peabody Picture Vocabulary Test-Fourth Edition
(PPVT-IV; Dunn & Dunn, 2007) assesses the participant’s receptive vocabulary. The administrator displays a group of four pictures and then states a word. The child is required to examine the pictures and then point to the picture related to the target word. Raw and standard scores are generated. Past reported alpha coefficients for this test’s scores were strong (age 6:0-6:5 α = .97, age 6:6-6:11 α = .94, age 7 α = .94; age 8 α = .99; Dunn & Dunn, 2007). Two different types of evidences were collected for the validity of this measure’s scores including construct (e.g., correlations with other tests), and content (e.g., word selection process).
listen to a series of nonwords presented by audiocassette and repeat them exactly as heard. A raw score and scaled score are generated. Past reported content sampling alpha coefficients for this subtest’s scores were strong (age 6 α = .80, age 7α = .80, age 8 α= .80; Wagner et
al., 1999).
Next, the Wechsler Intelligence Scale for Children-Fourth Edition Integrated (WISC-IV Integrated; Wechsler et al., 2004) Spatial Span Forward (SSF) and Backward (SSB) Subtests were administered to assess the participant’s visual-spatial working memory. Both subtests use a three dimensional board with attached blocks. During the Spatial Span Forward component, the child is asked to repeat a sequence of tapped blocks in the same order as demonstrated by the examiner. For the Spatial Span Backward component, the examiner points to a series of blocks and then asks the child to point to the same blocks in reverse order. Raw and standard scores are generated. Past reported internal consistency reliability coefficients for this subtest’s scores were moderate (age 6 SSpF r = .76, SSpB r = .81; age 7 SSpF r = .70, SSpB r = .74; age 8 SSpF r = .79, SSpB r = .77; Wechsler et al., 2004). A variety of types of evidences were collected for the validity of the WISC-IV subtest scores (i.e., SSF and SSB) including content (e.g., expert judgments and empirical item analysis), construct (e.g., intercorrelations of the subtests, studies of group differences), and criterion (e.g., correlations with other tests).
Picture Memory subtest assesses the participant’s visual short-term memory. It includes four stimulus picture cards and a response book with picture scenes. Each picture card is
presented to the subject for 10 seconds, after which the participant is presented with the similar picture scene where nine (zoo card) or fourteen (classroom, living room, and garage cards) parts have been moved, changed, or added. The participant must indicate the
differences by placing an “X” on each part.
The Picture Memory Recognition Subtest is administered approximately 25 minutes after the Picture Memory test to assess delayed visual memory. This response booklet has 44 pictures, some of which the student saw previously on the picture cards and pictures scenes. Participants must circle Y if they have seen the picture before or N if not.
The Story Memory Subtest measures verbal short-term memory. The administrator reads aloud two stories (Story A- Birthday Story and Story B- Fishing Story). After each story the participant is asked to verbally recall the story. The participant is given credit for correctly recalling 26 pre-determined story parts for Story A and 38 predetermined parts for Story B.
item functioning) and external (i.e., correlations with other psychological tests and investigations of clinical studies) validity of this measure’s scores.
Table 2
WRAML-2 Reliability Alpha Coefficients
SUBTEST Age 6:0 – 6:11 Age 7:0 – 7:11 Age 8.0 – 8.11
Story Memory .91 .90 .91 Story Memory Recognition .81 .76 .72 Picture Memory .78 .78 .72 Picture Memory Recognition .61 .46 .48
Note. From Adams and Sheslow (2003).
Planning and Efficiency. The participants’ planning and efficiency skills were
assessed by four measures. The first two included the Woodcock Johnson: Third Edition Test of Cognitive Abilities (WJ III COG; Woodcock, McGrew, & Mather, 2001) Planning
Woodcock et al., 2001). For both of the WJ III subtests, four sources of validity evidence were used to demonstrate the validity of these measures’ scores including test content (e.g., outside experts, Cattell-Horn-Carroll theory of cognitive abilities), discriminant
developmental patterns of scores (e.g., divergent growth curves), and construct (e.g., factor analysis).
The second two measures for assessing the participants’ planning and efficiency skills were from the Vigil Continuous Performance Test (Vigil CPT; Psychological Corporation, 1998). This test assesses sustained attention, impulsivity, speed and consistency of
responding and response inhibition in the visual mode. The task requires the child to watch the computer screen as a sequence of single letters appear and press the space bar instantly after seeing the letter K immediately followed by the letter A. This task lasts about 8 minutes. Specifically for this study two data points were examined, the errors of omission and errors of commission. Errors of omission represent the frequency of targets missed. For example, the target was presented and the participant did not respond. In addition, errors of
commission represent the frequency of incorrect anticipations of targets presented such that the participant responded as if the target was present when in fact no target was present. Raw scores, age-based standard scores, and z-scores were generated. Past reported reliability estimates for this test’s scores varied from weak to strong (Table 3). Two types of evidences were collected for the validity of this measure’s scores including construct (e.g.,
Table 3
Vigil CPT Reliability Estimates
AK Test Measure Alpha Split-Half Test-Retest
Errors of Omission .91 .923 .666
Errors of Commission .956 .959 .793
Note. From The Psychological Corporation (1998).
Parent questionnaire. The Family Information Form consisted of four sections including a) Child and Family Information, b) Child Health Information, c) School History, and d) Family History. This questionnaire was used to collect information about
chronological age, ethnicity, gender, and socioeconomic status. One hundred and one
questionnaires were mailed with a 45.5% response rate to date (i.e., 46 forms were returned). SES was not used because over half the sample has missing data on this variable.
The School Archival Records Search (SARS). Age, ethnicity (i.e., a national background), and gender were also collected and verified through SARS. The project staff gathered this
information with the assistance of school personnel. The ethnicity categories included European American, African-American, Hispanic American, and other. Native American, multi-racial, and Asian American were combined into the other category due to small sample sizes.
Data Analysis Descriptive Statistics
Data Preparation
Table 4
Predictor Variables
Variable Skill Measure Label
Transcription Fine motor PAL-RW Finger Sense-Succession Dominant FSSD Transcription Fine motor PAL-RW Finger Sense- Succession Nondominant FSSN
Transcription Spelling WIAT-IIA Spelling Subtest SPELL
Linguistic Orthographic-Phonological Coordination PAL-RW RAN Letters task LETT
Linguistic Phonological Awareness CTOPP Elision subtest ELIS
Linguistic Orthographic Processing PAL-RW Word Choice task WORD
Linguistic Receptive Vocabulary PPVT-IV PPVT
Working Memory Phonological and auditory memory CTOPP Nonword Repetition NWR
Working Memory Non-verbal and visual spatial memory WISC-IV PI Spatial Span Forward SSF Working Memory Non-verbal and visual spatial memory WISC-IV PI Spatial Span Backward SSB
Planning and Efficiency Sustained attention Vigil CPT Omissions OMIS
Planning and Efficiency Attentional Impulse control Vigil CPT Commissions COMIS Planning and Efficiency Long-term verbal retrieval & fluency WJ III COG Retrieval Fluency RETF Planning and Efficiency Reasoning & Problem-Solving WJ III COG Planning subtest PLAN
Memory and Retrieval Visual short-term memory WRAML-2 Picture Memory PICM
Memory and Retrieval Visual delayed memory WRAML-2 Picture Memory Recognition PICMR Memory and Retrieval Auditory short-term memory WRAML-2 Story Memory STM
Variable Creation. Initially for this study there was a practical, yet also theoretical issue. Specifically, there were multiple measures for each construct, and this resulted in too many measures (i.e., 18) for the sample size (n = 101), therefore data reduction was required. Theoretically, it made sense to combine the multiple measures into composites for analyses, but the manner by which this was done depended upon the data and results of the data reduction analyses. So, a heuristic was used to choose between three different data reduction techniques.
First, I chose to attempt a series of exploratory factor analyses (EFA) using the predictor variables and their measures, outlined in Table 3, to create five factors (i.e., transcription, linguistic, working memory, planning and efficiency, and memory and retrieval). The aim of this option was to create factors which represented the associations among the measures. If results of the analyses produced strong interpretable factors then they were used as predictor variables. Numerous criteria were used to decide if strong factors were present, including strength of factor loadings (i.e., ≥ .35), absence of high factor
crossloadings (i.e., no measure would load ≥ .35 on 2 factors), and high percentages of variance extracted (i.e., ≥ 0.50).
best measure for that variable. I would have examined the exploratory factor analyses and selected the measure for each variable with the strongest loading. This option was least attractive because it did not include multiple measures for each variable. The factor analyses returned favorable results, described in the results section. The methods used for the EFAs are described next in more detail.
First, the method of extraction was decided. Specifically, principal axis factoring (PAF) was employed. With PAF “each factor accounts for the maximum possible amount of the variance of the variables being factored (Gorsuch, 1983),” and factors are generated from the common variance shared among the items, not the total (i.e., common and unique)
variance as in principal components analysis (PCA). In addition, PAF can eliminate measurement error (i.e., unique variance) from the analysis. Further, as mentioned previously, the aim of EFA is to reveal the latent factors which are present among the measures; other kinds of factor analysis, such as PCA, are less suitable for this type of analysis (Ford, MacCullum, & Tait, 1986; Osborne & Costello, 2005).
Then, the number of factors to retain for rotation was determined. Preliminarily, the eigenvalues were assessed to obtain an idea of how many factors were present using the eigenvalues greater than one criteria. Rotation was used to simplify the data structures and obtain more interpretable factors. This was accomplished using the direct oblimin method with the delta equal to zero. An oblique rotation was chosen because in the social sciences it is probable that the dimensions of the constructs are correlated. To clarify the final factors, the pattern matrices for the rotated factors were examined for high factor loadings (i.e., ≥
were examined for their theoretical justification and importance to the interpretation of the factor. A measure was removed from the analysis if it did not meet the set criteria and the factor was reanalyzed without that measure. Further, if two or more factors resulted for one construct the factor correlation was also examined.
After all of the necessary decisions were made, an internal consistency estimate of reliability was computed for each factor using Cronbach’s Alpha. Finally, the factor scores were estimated using a regression based approach. It is noted that the two groups of students (i.e., at-risk and typical) might have had different factor structures in the exploratory factor analyses. However, this was not tested because these variables were used to predict at-risk status and therefore, common variables were needed.
Logistic regression
I employed binary logistic regression to simultaneously examine how various predictors (i.e., factors capturing transcription, linguistic, working memory, planning and efficiency, memory and retrieval, as well as gender, ethnicity, and interactions) influence the likelihood of being classified as at-risk. I used logistic regression because my criterion variable was dichotomous (i.e. at-risk or typical writing performance). All of my research questions and hypotheses were addressed within a single logistic regression model, where I examined the influence of each of the predictor variables and their interactions on the likelihood of at-risk status.
test statistical significance. To conduct the analysis, first, all predictor variables (i.e., main effects) were entered simultaneously. Next, all of the 16 interactions were entered. The model with all main effects and interactions was examined and found to be not interpretable (i.e., extremely large standard error values). Therefore, all predictor variables were entered simultaneously and the interactions were entered next one at a time (e.g., Linguistic x
Gender, then Linguistic x Ethnicity). The analysis was conducted in such a manner to test the interactions using the strongest criteria, to determine if they added anything above and beyond the main effects and also, to deal with any possible power concerns.
Statistically significant predictor variables included in the final model were
interpreted by transforming their logit into odds ratios. This provided a more interpretable measure of effect size. In addition, effect size measures (i.e., pseudo R2) were used to
CHAPTER 4 RESULTS
Through the data analyses I aimed to answer the question: Are individual differences on the cognitive processes posited in the Not-So-Simple View of Writing (Berninger & Winn, 2006), gender, or ethnicity statistically significantly predictive of the likelihood of first grade students being at-risk for writing difficulties, as measured by their achievement on the WIAT-II written expression subtest? First, I reduced my data using EFA. The final factors were used to conduct the logistic regression, and ultimately to answer my research question and address my hypotheses.
Descriptive Statistics
Table 5
Univariate Descriptive Statistics
Measure X SD
PAL-RW RAN Letters task z-score 0.3625 0.681
PAL-RW Word Choice task z-score -0.5096 1.047
PAL-RW Finger Sense-Succession dominant z-score -0.1631 0.386 PAL-RW Finger Sense-Succession non-dominant z-score -0.1346 0.403 WIAT-IIA Spelling Subtest standard score 99.1782 14.090
CTOPP Elision subtest scale score 9.85 2.431
CTOPP Nonword Repetition subtest scale score 9.51 2.110
PPVT 4 standard score 102.27 13.760
WRAML-2 Story Memory scale score 10.66 2.380
WRAML-2 Picture Memory scale score 9.24 2.892 WRAML-2 Story Memory Recognition scale score 11.21 2.868 WRAML-2 Picture Memory Recognition scale score 9.46 2.998 WISC-IV PI Spatial Span Forward subtest standard score 10.03 2.77 WISC-IV PI Spatial Span Backward subtest standard score 9.30 3.279 WJ III COG Retrieval Fluency subtest standard score 105.84 14.064
WJ III COG Planning subtest standard score 84.02 11.878
The interitem correlation matrix is presented in Table 6. Examination of the
Table 6
Correlation Matrix
LETT WORD FSSD FSSN SPEL ELIS NWR PPVT STM PICM STMR PICMR SSF SSB RETF PLAN OMIS
WORD -.230*
FSSD .240* -.101
FSSN .191 .031 .682**
SPEL .052 .212* .031 .046
ELIS .247* -.325* .069 -.028 -.162
NWR .292* -.268* -.014 -.051 -.229* .319**
PPVT .267* -.296* .010 -.042 -.182 .389** .181
STM .443* -.229* .189 .238* -.130 .328** .296** .432**
PICM -.024 -.006 .059 .240* -.015 -.035 .083 .055 .057
STMR .381* -.269** .051 .046 -.124 .342** .247* .497** .639** .143
PICMR .369** -.221* .168 .086 .038 .240* .215* .330** .385** .059 .323**
SSF .225* .096 .115 .108 -.055 .178 .236* .141 .268** .141 .160 .132
SSB .286** -.184 .297** .300** -.012 .327** .176 .321** .304** .112 .292** .291** .431**
RETF .248* -.117 .193 .207* -.110 .186 .336** .341** .358** .107 .232* .272** .111 .243*
PLAN .176 -.107 .149 .048 .095 .205* .171 .224* .265** .076 .277** .149 .096 .259** .118
OMIS -.127 .089 .099 -.200 .052 -.045 .134 -.075 -.147 -.020 .040 -.104 .026 -.052 -.106 -.065
COMIS -.159 .166 .063 .051 .025 -.195 -.151 -.258* -.150 .088 -.352** -.266 -.217* -.264 -.006 -.042 -.417**
Note. LETT = PAL-RW RAN Letters, WORD = PAL-RW Word Choice, FSSD = PAL-RW Finger Sense-Succession Dominant, FSSN= PAL-RW Finger
Sense-Succession Nondominant, SPEL = WIAT-IIA Spelling Subtest, ELIS = CTOPP Elision, NWR = CTOPP Nonword Repetition, PPVT = PPVT-IV, STM = WRAML-2 Story Memory, STMR= WRAML-2 Story Memory Recognition, PICM = WRAML-2 Picture Memory, PICMR = WRAML-2 Picture Memory Recognition, SSF = WISC-IV PI Spatial Span Forward, SSB = WISC-IV PI Spatial Span Backward, RETF = WJ III COG Retrieval Fluency, PLAN = WJ III COG Planning, OMIS = VIGIL CPT Omissions, COMIS = VIGIL CPT Commissions
* Correlation is statistically significant at the 0.05 level (2-tailed) ** Correlation is statistically significant at the 0.01 level (2-tailed)
Preliminary Analysis: Variable Creation
For each of the five cognitive components a separate exploratory factor analysis was conducted. The final factor or pattern matrixes are presented for each of the analyses. These matrices display the factor loadings for each of the chosen measures.
As previously mentioned, the criteria for judging the factor structures were high factor loadings (i.e., ≥ .35), absence of strong factor crossloadings (i.e., no measure would load ≥ .35 on two factors), and high percentages of variance extracted (i.e., ≥ 0.50). Additionally, the measures were examined for their theoretical justification and importance to the interpretation of the factor. Further, a measure was removed from the analysis if it did not meet the set criteria.
Transcription
The first construct, transcription, initially included three measures in the analysis (i.e., PAL-RW Finger Sense-Succession dominant and non-dominant, and WIAT-IIA Spelling Subtest). These measures were factor analyzed using principal axis factoring, limiting the number of factors to two (i.e., number of measures minus one). As seen in the factor matrix, shown in Table 7, one strong factor was present that captured two of the measures.
Table 7
Transcription Factor Matrix 1
Factor
Measure 1 2
Rotation using the direct oblimin method was performed to achieve a simple structure. The pattern matrix is shown in Table 8.
Table 8
Transcription Pattern Matrix
Factor
Measure 1 2
FSSD .843 -.037
FSSN .805 .045
SPEL .000 .103
The WIAT-IIA Spelling Subtest was dropped from the analysis due to its low loadings and one factor was extracted using principal axis factoring. Because only one factor was
extracted a rotation was not conducted for the final analysis. The final factor was defined by two measures, the PAL-RW Finger Sense-Succession Forward and Backward subtests therefore, this factor was labeled fine motor (FM). The factor loadings for this factor are presented in Table 9.
Table 9
Transcription Factor Matrix 2
Measure Factor 1
FSSD .825
The factor accounted for 68.070% of the item variance (Table 10). Table 10
Transcription Total Variance Explained
Initial Eigenvalues Extraction Sums of Squared Loadings Factor Total % of Variance Cumulative % Total % of Variance Cumulative % 1 1.682 84.077 84.077 1.361 68.070 68.070 2 0.318 15.923 100.000
The factor scores were estimated based on the factor score coefficients from this final factor. The Cronbach’s Alpha internal consistency estimate of reliability for the measures was α = .810. A higher factor score for this variable indicated a higher fine motor ability response pattern.
Linguistic
Table 11
Linguistc Factor Matrix
Factor
Measure 1 2 3
LET .468 .181 -.121
WORD -.528 .164 .101
ELIS .583 -.093 .071
PPVT .564 .099 .121
The solution was rotated using the direct oblimin method to achieve a simple structure and help make the factors easier to interpret. The pattern matrix is shown in Table 12.
Table 12
Linguistc Pattern Matrix 1
Factor
Measure 1 2 3
LET -.002 .526 -.016
WORD -.585 -.009 .063
ELIS .476 .022 .161
PPVT .147 .274 .261
(LP). The PAL-RW RAN Letters task loaded strongly on factor two consequently it was labeled linguistic coordination (LC). The loadings for the final two factors are displayed in the pattern matrix (Table 13).
Table 13
Linguistic Pattern Matrix 2
Factor
Measure 1 2
LET .004 .503
WORD -.583 .031
ELIS .524 .052
Table 14
Linguistic Total Variance Explained
Initial Eigenvalue Extraction Sums of Squared Loadings Rotation Factor Total % of Variance Cumulative % Total % of Variance Cumulative % Total 1 1.531 51.023 51.023 0.831 0.693 27.69327 0.810 2 0.786 26.215 77.239 0.059 1.979 29.672 0.698 3 0.683 22.761 100.000
Working memory
The initial analysis for the third variable, working memory, included three measures (i.e., WISC-IV PI Spatial Span Forward and Backward subtests, and the CTOPP Nonword Repetition subtest). These measures were factor analyzed using principal axis factoring, limiting the number of factors to two (i.e., number of measures minus one). The factor matrix is shown in Table 15.
Table 15
Working Memory Factor Matrix
Factor
Measure 1 2
NWR .339 .248
SSF .689 .010
SSB .626 -.145
using PAF with direct oblimin rotation to clearly interpret the factors. Based on the pattern matrix for the final two factors (Table 16), factor one was labeled nonverbal working memory (NVWM) because both SSF and SSB loaded strongly whereas, NWR loaded strongly on factor two, subsequently labeled verbal working memory (VWM). Table 16
Working Memory Pattern Matrix
Factor
Measure 1 2
NWR .010 .413
SSF .561 .171
SSB .679 -.054
These factors accounted for 35.48% of the item variance. The total variance explained is presented in Table 17. The factor correlation was moderate (i.e., r = .686). The factor scores were estimated based on the factor score coefficients from these final factors. The