Identi
fi
cation of an Intestinal Microbiota Signature Associated
With Severity of Irritable Bowel Syndrome
Julien Tap,
1,2,*
Muriel Derrien,
1,*
Hans Törnblom,
3,4Rémi Brazeilles,
1Stéphanie Cools-Portier,
1Joël Doré,
2Stine Störsrud,
3Boris Le Nevé,
1Lena Öhman,
3,5,6,§and Magnus Simrén
3,4,7,§1
Danone Nutricia Research, Palaiseau, France;2French National Institute for Agricultural Research (INRA) MetaGenoPolis, Jouy en Josas, France;3Department of Internal Medicine and Clinical Nutrition, Institute of Medicine,4Centre for Person-Centered Care,5Department of Microbiology and Immunology, Sahlgrenska Academy, University of Gothenburg, Gothenburg, Sweden; 6
School of Health and Education, University of Skövde, Skövde, Sweden;7Center for Functional GI and Motility Disorders, University of North Carolina, Chapel Hill, North Carolina
BACKGROUND & AIMS:We have limited knowledge about the association between the composition of the intestinal micro-biota and clinical features of irritable bowel syndrome (IBS). We collected information on the fecal and mucosa-associated microbiota of patients with IBS and evaluated whether these were associated with symptoms.METHODS:We collected fecal and mucosal samples from adult patients who met the Rome III criteria for IBS at a secondary/tertiary care outpatient clinics in Sweden, as well as from healthy subjects. The exploratory set comprised 149 subjects (110 with IBS and 39 healthy subjects); 232 fecal samples and 59 mucosal biopsy samples were collected and analyzed by 16S ribosomal RNA targeted pyro-sequencing. The validation set comprised 46 subjects (29 with IBS and 17 healthy subjects); 46 fecal samples, but no mucosal samples, were collected and analyzed. For each subject, we measured exhaled H2and CH4, oro-anal transit time, and the
severity of psychological and gastrointestinal symptoms. Fecal methanogens were measured by quantitative polymerase chain reaction. Numerical ecology analyses and a machine learning procedure were used to analyze the data. RESULTS: Fecal microbiota showed covariation with mucosal adherent micro-biota. By using classic approaches, we found no differences in fecal microbiota abundance or composition between patients with IBS vs healthy patients. A machine learning procedure, a computational statistical technique, allowed us to reduce the 16S ribosomal RNA data complexity into a microbial signature for severe IBS, consisting of 90 bacterial operational taxonomic units. We confirmed the robustness of the intestinal microbial signature for severe IBS in the validation set. The signature was able to discriminate between patients with severe symptoms, patients with mild/moderate symptoms, and healthy subjects. By using this intestinal microbiota signature, we found IBS symptom severity to be associated negatively with microbial richness, exhaled CH4, presence of methanogens, and
enterotypes enriched with Clostridiales or Prevotella species. This microbiota signature could not be explained by differences in diet or use of medications.CONCLUSIONS:In analyzing fecal and mucosal microbiota from patients with IBS and healthy individuals, we identified an intestinal microbiota profile that is associated with the severity of IBS symptoms. Trial registration number: NCT01252550.
Keywords:Functional Bowel Disorder; Bacteria; Microbiome.
I
rritable bowel syndrome (IBS) is the most prevalent functional gastrointestinal disorder in Western soci-eties. It affects approximately 11% of the adult population and strongly impairs quality of life, social function, work productivity, and brings substantial costs to health care services.1 The etiology of IBS remains poorly understood and the search for biomarkers is ongoing.2It is now well accepted that IBS is a disorder involving multiple pathophysiological mechanisms in which composi-tion of gut microbiota has been proposed as one of the potentially important factors.3,4 Since the first study that investigated the fecal microbiota composition of IBS patients and healthy subjects using a molecular-based approach,5 many studies have followed using targeted approaches,6 specifically quantitative polymerase chain reaction (PCR).6,7 More recently, the use of advanced tools has allowed a better overview of gut microbiota composition,6,8,9 func-tion,10and metabolite production11,12in IBS. Even though gut microbiota alterations seem to exist in IBS, no uniform gut microbiota pattern in IBS has been shown. The existing inconsistencies among currently available data in IBS may be attributed to several factors including heterogeneity of gut microbiota profiling methods, inherent individual microbiota variability, and differences in inclusion criteria, as well as sample size. This highlights the difficulty infinding robust microbiota markers associated with IBS clinical parameters,3
*Authors share co-first authorship;§Authors share co-senior authorship.
Abbreviations used in this paper:AUC, area under the curve; AUROC, area
under the receiver operating characteristic curve; BMI, body mass index; FODMAP, Fermentable, Oligo-, Di-, Mono-saccharides And Polyols; GI, gastrointestinal; HAD, Hospital Anxiety and Depression; IBS, irritable bowel syndrome; IBS-C, irritable bowel syndrome with con-stipation; IBS-D, irritable bowel syndrome with diarrhea; IBS-M, mixed irritable bowel syndrome; IBS-SSS, Irritable Bowel Syndrome Severity Scoring System; JSD, Jensen Shannon divergence; LASSO, least absolute shrinkage and selection operator; OATT, oro-anal transit time; OTU, operational taxonomic unit; PC, principal component; PCR, polymerase chain reaction; rRNA, ribosomal RNA; RV, regression vector.
Most current article
© 2017 by the AGA Institute. Published by Elsevier Inc. This is an open access article under the CC BY-NC-ND license (http://creativecommons.
org/licenses/by-nc-nd/4.0/). 0016-5085
http://dx.doi.org/10.1053/j.gastro.2016.09.049
Gastroenterology 2017;152:111–123
CLINICAL
and shows the need for large and well-characterized cohorts to obtain valid and reliable analyses of the association be-tween clinical symptoms and microbiota composition and function in IBS.
Fecal microbiota has been the target of most studies because of its convenient accessibility. However, mucosal microbiota is of great interest given its proximity to host cells because host–microbe interactions have been proposed to be of relevance for symptom generation in IBS.4Although the analysis of mucosal microbiota involves more invasive sampling methods, several studies have investigated colonic mucosal samples obtained by sigmoidoscopy, either after bowel cleansing13 or using unprepared biopsy specimens.14–16The use of unprepared biopsy samples offers the advantage to avoid perturbation of the microbiota composition.17 Large cohort studies in IBS patients combining paired microbiota samples originating from fecal and mucosa samples are rare, but a few smaller studies using next-generation sequencing exist.13,16
Thus, there is currently a need for an improved under-standing of gut microbiota composition in IBS patients and for the potential role played by the gut microbiota in the generation of IBS symptoms. In this study, we therefore aimed to determine the fecal and mucosa-associated micro-biota, and the link to clinical symptoms in a large and well-characterized cohort of IBS patients.
Materials and Methods
Subject Recruitment and Study Design
Adult patients, aged 18–65 years and fulfilling the Rome III criteria18for IBS, were included prospectively at a secondary/ tertiary care outpatient clinic (Sahlgrenska University Hospital, Gothenburg, Sweden). The diagnosis was based on a typical clinical presentation and additional investigations if considered necessary by the gastroenterologist (H.T. or M.S.). Classification into IBS subtypes according to the Rome III criteria was performed based on Bristol Stool Form scale characteristics: IBS with constipation (IBS-C), IBS with diarrhea (IBS-D), mixed IBS (IBS-M), or unsubtyped IBS.18Exclusion criteria included the use of probiotics or antibiotics during the study period or within 1 month before inclusion, another diagnosis that could explain the gastrointestinal (GI) symptoms, severe psychiatric disease as the dominant clinical problem, other severe diseases, and a history of drug or alcohol abuse. A healthy control group was recruited by use of advertisement and checked by interview and a question-naire to exclude chronic diseases and any current GI symptoms. All participants provided written informed consent to participate after verbal and written information about the study. The Regional Ethical Review Board at the University of Gothen-burg approved the study before the start of subject inclusion.
Subject Characterization
Demographic information and body mass index were ob-tained in all subjects. IBS patients reported their current use of medications and completed questionnaires to characterize their symptom severity and bowel habits. The IBS Severity Scoring System (IBS-SSS),19the Hospital Anxiety and Depression (HAD) scale,20a 4-day food diary,21and a 2-week stool diary based on
the Bristol stool form scale.22IBS severity was based on vali-dated cut-off scores on IBS-SSS (mild IBS, IBS-SSS score<175; moderate IBS, IBS-SSS score of 175–300; and severe IBS, IBS-SSS score>300).19
The oro-anal transit time (OATT) (radiopaque marker study)23 and the amount of exhaled H2 and CH4 after an
overnight fast (ie, not after intake of any substrate), also was determined in IBS patients (see Supplementary Material for more details).
Fecal and Mucosal Sample Collections and
DNA Extraction
Fecal samples were collected from 195 subjects in RNAlater solution (Ambion, Courtaboeuf, France). For most of the IBS subjects, 2 fecal samples were collected (average, 26±16 days between the 2 samples). A first set, referred to as the explor-atory set, comprised 149 subjects (110 IBS and 39 healthy subjects), from whom 232 fecal samples and 59 biopsy samples were collected and analyzed. A second set, referred to as the validation set, comprised 46 subjects (29 IBS and 17 healthy subjects), from whom 46 fecal samples, but no biopsy samples, were collected and analyzed (Supplementary Table 1). The di-vision into 2 study sets was based on sampling date.
Fecal DNA was extracted using mechanical lysis (Fastprep FP120; ThermoSavant, Illkirch, France) followed by phenol/ chloroform-based extraction as previously described.24Biopsy specimens from the sigmoid colon were obtained from 59 subjects (39 IBS and 20 healthy subjects). The biopsy speci-mens were taken 25–35 cm proximal of the anus during an unprepared sigmoidoscopy. Once collected, biopsy specimens were placed immediately in liquid nitrogen and stored at -80C until further analysis. Mucosal adherent microbiota DNA was isolated using an adapted protocol based on Godon et al25(see theSupplementary Materialfor more detail). Routine histopa-thology of biopsy specimens confirmed the absence of active inflammation.
Microbial Composition Assessment
Hypervariable 16S ribosomal RNA (rRNA) regions (V5–V6) were amplified using primers 5’-AGGATTAGATACCCTGGTA-3’ and 5’-CRRCACGAGCTGACGAC-3’. Sequencing was performed by DNA Vision SA (Charleroi, Belgium) on a 454 Life Sciences Genome Sequencer FLX instrument (Roche, Basel, Switzerland) using titanium chemistry. Raw reads qualityfiltering and trim-ming, operational taxonomic units (OTU) clustering, and taxo-nomic assignment all were performed using the LotuS v1.32 pipeline26(see theSupplementary Materialfor more detail).
Detection of Methanobacteriales by
Quantitative PCR
Fecal extracted DNA were subjected to quantitative PCR using primers targeting theMethanobacterialesorder Mtb857F (5’-CGWAGGGAAGCTGTTAAGT-3’) and Mtb1196R (5’ -TACCGTCGTCCACTCCTT-3’), as has been described previ-ously.27PCR results then were translated as the presence or absence of dominantMethanobacterialesin fecal samples using 106rRNA genes copies per gram of wet fecal content as the threshold, as defined by the lowest detected value in the standard curve.
CLINICAL
Numerical Ecology and Statistical Analysis
a-Diversity (diversity within samples) was assessed using the number of observed OTUs rarefied at the same sequencing depth (3500 sequences per sample in this study) using the vegan R package.28 b-Diversity (diversity between samples) was assessed by square-root Jensen–Shannon divergence met-rics,29referred to as the Jensen–Shannon distance (JSD) in this article, as well as the Bray–Curtis distance. Enterotype strati-fication was identified in fecal samples (1 sample per individ-ual) using previously described methods with the Dirichlet multinomial mixture model.30
A machine learning procedure to identify a microbial signa-ture for IBS severity was implemented using L1 regularized logistic regression31 (least absolute shrinkage and selection operator [LASSO]) using the LIBLINEAR library32 validated through a 10-fold independent cross-validation. Features selection and data transformation was processed as previously described.33The performance of prediction models was assessed for its discriminative ability using the area under the receiver operating characteristic curve (AUROC) on exploratory and vali-dation data sets. OTUs selected by machine learning were char-acterized further by their prevalence in healthy subjects and in patients with severe IBS (IBS-SSS>300), and by their phyloge-netic specificity (seeSupplementary Materialfor more detail).
Co-inertia analysis was used to identify the relationship between the fecal and biopsy microbiota data sets, as well as the relationship between a microbial signature for IBS severity and the clinical data, using the ade4 R package.34 The overall similarity between data sets then was measured by the regression vector (RV) coefficient.34The relationship between variables was assessed using nonparametric tests (the Wilcoxon test and Spearman correlation test) for continuous variables (eg, bacterial relative abundance, microbiota a-and b-diversity, IBS-SSS, HAD, age, body mass index [BMI], exhaled gas, and stool frequency and consistency), and the chi-squared test for categoric variables (eg, enterotypes, IBS subtypes, and
the presence or absence of methanogens). A Monte Carlo per-mutation test (99 perper-mutations) was used to assess the robustness of the RV coefficient. The statistical approaches (eg, co-inertia and Monte-Carlo) applied to microbiota analysis have been thoroughly described previously.35 In case of multiple testing, all P values were adjusted by Benjamini–Hochberg false-discovery rate correction.36 All statistical analyses were performed with R software and is described in the Supplementary Material.
Access to Study Data
All authors had access to the study data and reviewed and approved thefinal manuscript. Source codes used in this study are available from GitHub (http://github.com/tapj/ IBSMicrobiota).
Results
Clinical Characteristics of IBS Patients and
Healthy Subjects
The study cohort was divided into 2 study sets based on sampling date. Thefirst set, the exploratory set (149 subjects: 110 IBS and 39 healthy), were recruited between April 2010 and May 2012. The second study set, the validation set (46 subjects: 29 IBS and 17 healthy), were recruited between June 2012 and November 2013. Detailed clinical and de-mographic characteristics for the exploratory and validation sets are summarized inTable 1andSupplementary Figure 1. There were no differences between IBS patients or healthy subjects from the 2 study sets regarding sex, age, BMI, or clinical parameters after Benjamini Hochberg correction for test multiplicity. Apart from expected differences between IBS subtypes in stool characteristics and OATT, gender dif-ferences also were seen (more women in the IBS-C group,
Table 1.Clinical and Demographic Characteristics for IBS Patients and Healthy Subjects
Median (interquartile range)
Study set 1 (exploratory) Study set 2 (validation) Healthy set 1 vs set 2,
Pvalue
IBS set 1 vs set 2,
Pvalue Healthy (n¼39) IBS (n¼110) Healthy (n¼17) IBS (n¼29)
Age,y 27 (24–31) 33 (27–43) 29 (27–38) 28 (24–40) NS NS
Sex, male/female 13/26 41/69 6/11 5/24 NS NS
BMI 21.9 (19.8–24.3) 22.6 (20.9–24.7) 22.4 (21.0–23.9) 22.2 (20.3–25.0) NS NS Exhaled H2, ppm 8.0 (0–12.0) 2.0 (0–12.3) 4.0 (1.0–8.0) 5.5 (0–21.5) NS NS Exhaled CH4, ppm 3.0 (1.0–6.5) 3.0 (1.0–7.5) 2.0 (1.0–2.3) 2.5 (1.0–6.3) NS NS
HAD anxiety 5 (2–7) 7 (5–11) 4 (2–6) 11 (7–14) NS NS
HAD depression 2 (1–4) 4 (2–7) 2 (1–4) 6 (3–9) NS NS
IBS subtype, C/D/M/U N/A 18/43/43/2 (4 NA) N/A 3/14/9/1 (2 NA) N/A NS
IBS-SSS N/A 266 (198–359) N/A 270 (212–347) N/A NS
Number of patients with severe IBS, IBS-SSS>300
N/A 45 N/A 13 N/A NS
Stool consistency (BSF) 4.0 (3.5–4.4) 4.0 (2.8–4.7) 3.6 (2.9–4.4) 4.5 (3.3–5.2) NS NS Stool frequency (stool per day) 1.2 (1.0–1.6) 1.5 (1.0–2.1) 1.4 (1.1–2.0) 1.3 (1.1–1.6) NS NS OATT, days 1.1 (0.7–1.7) 1.1 (0.6–1.8) 1.1 (1.0–1.5) 1.3 (0.9–2.1) NS NS
NOTE. Data are shown as median (interquartile range). Statistical significance was determined by nonparametric Wilcoxon test and Benjamini Hochberg multiplicity correction. Sex and IBS subtype balance were evaluated with the chi-squared test. NS indicates aPvalue greater than .05.
BSF, Bristol Stool Form; IBS-U, irritable bowel syndrome unsubtyped; N/A, not applicable; NA, not available.
January 2017 Intestinal Microbiota and IBS Severity 113
CLINICAL
Pearson chi-squared test,P<.05), but otherwise other clin-ical and demographic data were similar in IBS subtypes. Regarding IBS subtype distribution, no differences were observed, neither between severe and other IBS, nor between the exploratory and validation sets (Supplementary Table 2).
Fecal and Mucosal Microbiota Are Structurally
Distinct but Highly Correlated
Paired mucosal and fecal microbiota samples were analyzed from 59 study subjects in the exploratory set (Supplementary Table 1). Paired comparisons of 16S rRNA gene sequencing analysis showed that fecal microbiota harbored more Firmicutes and Actinobacteria, whereas mucosal microbiota was enriched in Bacteroidetes and Pro-teobacteria (P < .05) (Figure 1A). a-Diversity of mucosal adherent microbiota, as measured by the number of OTUs, was significantly lower than that of fecal microbiota (P<.05) (Figure 1B). By using a co-inertia approach based on JSD metrics, mucosal microbiota was associated significantly with the fecal microbiota (RV, 0.71;P<.001), as shown in
Figure 1CandD.
Microbiota Diversity in Fecal and Biopsy Samples
Microbiota diversity in both fecal and biopsy samples was analyzed in the exploratory set using classic ecologic descriptive approaches including adiversity (richness as measured by number of OTUs, 97% identity) andbdiversitymetrics (JSD and Bray–Curtis distance using bacterial genus relative abundance). Neither microbiota richness nor micro-biota variability differed between groups (healthy subjects, IBS patients, IBS Rome III subtypes, or IBS severity) in the exploratory set. This was true for both fecal and biopsy samples (Supplementary Figure 2).
Enterotype Strati
fi
cation in Healthy Subjects and
IBS Patients
Microbiota clustering was performed on 232 fecal sam-ples from IBS patients (including 2 samsam-ples for most patients) and healthy subjects in the exploratory set (Supplementary Table 1) using the Dirichlet multinomial mixture model.
Microbiota separated optimally into 3 distinct microbiota communities as assessed by Bayesian information criterion and the Laplace parameter (Supplementary Figure 3AandB). The 3 identified microbiota communities were similar to the previously described gut microbial enterotypes.29 One enterotype was enriched inBacteroides(16% of samples), 1 was enriched in Prevotella (14% of samples), and 1 was enriched in Clostridiales (70% of samples) (Figure 2Aand
Supplementary Figure 3C). Notably, distribution of enter-otypes correlated with microbial richness, withBacteroides -enterotyped subjects harboring the lowest richness, as compared with Prevotella- and Clostridiales-enterotyped subjects (P<.05) (Figure 2B).
Next, we analyzed enterotype distribution and association with clinical parameters. After correcting for multiple
Figure 1.Taxonomic and diversity analysis of fecal and mucosal microbiota in IBS patients and healthy subjects. (A) Phylum relative abundance in stool and biopsy specimens (paired Wilcoxon test between stool and biopsy,P<.05). (B) Thea-diversity measured by OTU number (paired Wilcoxon test,P<.05). (C) Similarity between fecal and mucosal microbiota measured by RV coefficient. Observed RV coefficient is illustrated by thered dashed line. Theblack histogramshows the distribution of RV-simulated coefficient from 99 Monte Carlo permutations (permutation test,P< .05; the difference between observed and simulated indicates that the observed RV was higher than what would be expected by chance, hence significant). (D) Scatter plot of paired stool-biopsy microbiota from the co-inertia analysis using JSD metrics. Biopsy and fecal sample from the same subject are linked by ablack line. PCs represent the 2first principal components from the co-inertia analysis. The length of the black linerepresents the distance between stool and biopsy from the same subject.
CLINICAL
comparisons, no significant association was observed be-tween enterotypes and clinical parameters including age, BMI, HAD anxiety, HAD depression, exhaled H2and CH4, or
bowel habits (stool consistency and frequency) (Supplementary Figure 4A). However, enterotype distribu-tion was associated with OATT in both healthy subjects and IBS patients (Supplementary Figure 4A). Subjects with the Clostridiales enterotype showed longer transit times than subjects with Prevotellaand Bacteroidesenterotypes (P < .05). Furthermore, thePrevotellaenterotype was significantly more prevalent in men (P<.05) (Supplementary Figure 4B). Enterotype distribution differed between healthy subjects and IBS patients, with the enterotypeBacteroidesbeing more frequent in IBS subjects and thePrevotellaenterotype was more common in healthy subjects (Supplementary Figure 4C) (P<.05). Enterotype distribution also was associated with bowel habits (Pearson chi-squared test,P<.05). IBS-D and IBS-M patients had a higher prevalence of Bacteroides enterotype compared with IBS-C patients and healthy
subjects (Figure 2C). Regarding IBS symptom severity (IBS-SSS), the prevalence of thePrevotellaenterotype grad-ually decreased as symptom severity increased (P < .05) (Figure 2D).
Prevalence of Methanogens in Healthy Subjects
and IBS Patients
In the exploratory set, microbiota enterotyping was complemented by the detection of fecal methanogens by quantitative PCR, with specific emphasis on Meth-anobacteriales, which was detected in 33% of fecal samples, with a similar prevalence in healthy subjects and IBS pa-tients (Supplementary Figure 5). A significant association was observed between exhaled CH4 and the presence of
fecal methanogens (P < .05) (Supplementary Figure 5A). Detection of methanogens was dependent on enterotypes because 90% of individuals who harbored Methanobacter-iales belonged to the ClostridMethanobacter-iales-enriched enterotype and Figure 2.Enterotype richness and distribution in healthy subjects and IBS patients. (A)Abundance of the main contributors of each enterotype supports previously described enterotypes (Clostridiales,Bacteroides, andPrevotella). (B) Microbial richness of the 3 detected enterotypes: Clostridiales, Bacteroides, andPrevotella enterotypes (pairwise Wilcoxon test,P< .05). (C) Enterotype distribution in stool of healthy subjects and IBS subtypes (Pearson chi-squared test, P< .05). (D) Enterotype distribution according to severity group (Pearson chi-squared test,P<.05).
January 2017 Intestinal Microbiota and IBS Severity 115
CLINICAL
less than 5% of Bacteroides-enriched enterotypes had detectable level of Methanobacteriales (Supplementary Figure 5B).
The presence of methanogens was associated with IBS subtype distribution (P < .05). The proportion of IBS-D patients with undetectable Methanobacteriales was higher (w40%) than in IBS-C patients (w10%) (Supplementary Figure 5C). The IBS-SSS was not associated with the pres-ence of Methanobacteriales (P > .05) (Supplementary Figure 5D). IBS-D patients exhaled less CH4 than IBS-M
patients (Supplementary Figure 5E), and heathy subjects exhaled less CH4 than IBS patients with mild symptoms
(Supplementary Figure 5F).
Identi
fi
cation of a Microbial Signature for IBS
Symptom Severity
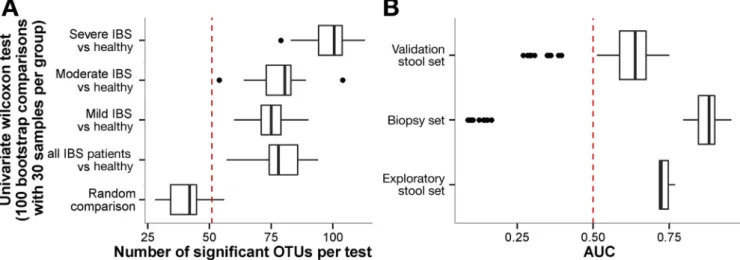
We further explored the association between IBS symptom severity and fecal microbiota composition. Compared with mild and moderate IBS subjects, a signifi -cantly higher number of OTUs (n¼100) could discriminate IBS subjects with severe symptoms from healthy subjects (Figure 3A). By using the bootstrapping method, we observed that the analysis was sensitive to randomness. When comparing 2 batches of 30 individuals randomly selected from the exploratory set, up to 50 bacterial OTUs could differ between the 2 batches driven by chance. In other words, compared with the total number of differential OTUs, half of the significant observations between tested groups could be detected by chance (Figure 3A). To over-come the issues related to randomness, we explored fecal microbiota in association with IBS symptom severity using an additional and more robust statistical approach, based on machine learning (LASSO). This allowed us to decrease the OTU complexity by combining them into a consensus mi-crobial signature from an ensemble of classifiers that
discriminated patients with severe IBS from patients with moderate or mild IBS and healthy subjects. Based on IBS symptom severity, 90 of 2911 total OTUs were selected by the machine learning procedure. The predictive power of this signature was quantified by AUROC analyses. Cross-validation of the microbial signature for IBS severity ob-tained with the exploratory set was performed against the fecal samples validation set (area under the curve [AUC], 0.74). The signature based on fecal samples in the explor-atory set also was efficient to classify mucosal samples according to IBS severity (AUC, 0.82) (Figure 3B). Next, we assessed the OTU microbial signature for IBS severity obtained from the exploratory set in the validation set (n¼46 individuals), which included 13 severe IBS patients (Figure 3B). In the validation set, an AUC of 0.64 was ob-tained, suggesting that the OTUs identified as a microbial signature for IBS severity were robust.
Taxonomic Characterization of the Gut Microbial
Signature for IBS Severity
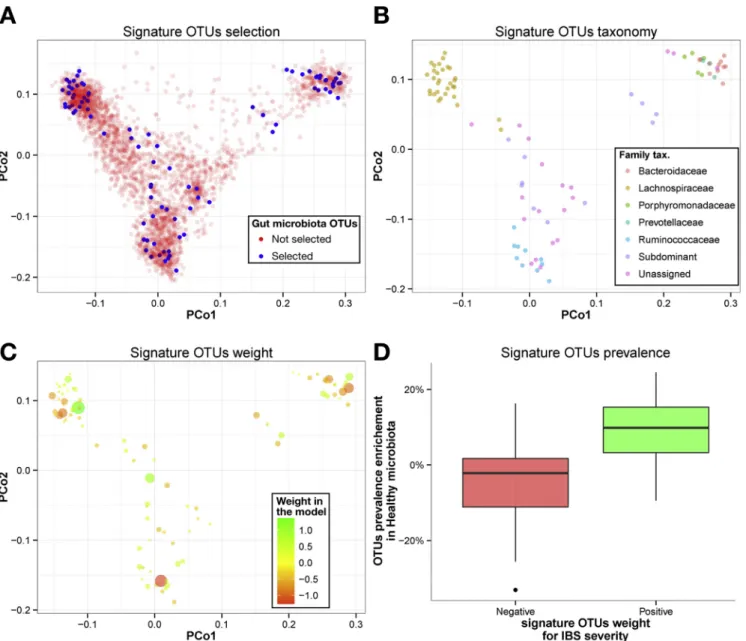
To further characterize the gut microbial signature for IBS severity, we analyzed the taxonomy of the 90 OTUs selected by the machine learning procedure (Figure 4). To assess the phylogenetic distribution of the microbial signature for IBS severity, we performed a principal coor-dinate analysis of the OTUs originating from the whole fecal microbiota data set (n ¼ 2911 OTUs), using nucleotide identity between their respective representative sequences (Figure 4A). Notably, there were no phylogenetic lineage specific for the microbial signature for IBS severity, but instead an overlapping taxonomy between the microbial signature for IBS severity and the whole microbiota data set, suggesting that those 90 OTUs associated with IBS severity are as diverse taxonomically as the OTUs from the whole microbiota data set. When examining only the OTUs
Figure 3.(A) Univariate comparison and (B) machine learning based on IBS severity. (A) For each group, 30 samples per group (mild, moderate, and severe IBS, and healthy controls, respectively) were taken randomly and each OTU was tested using a Wilcoxon test. This procedure was repeated 1000 times. The number of significant OTUs for each comparison is reported with boxplot.Dashed red lineillustrates the random expectation defined as the 95th percentile of random comparison. (B) AUC of 1000 classification models based on 10-fold cross validation and bootstrapped 100 times. The AUC is reported for the exploratory set (50.4% sensitivity at the 80% specificity level), mucosal sample (82.9% sensitivity with 80% specificity), and validation set (39.4% sensitivity with 80% specificity).Dashed red lineillustrates the random expectation defined as AUC of 0.50.
CLINICAL
extracted from the microbial signature for IBS severity, the dominant families of the gut microbiota were represented (ie, Lachnospiraceae, Ruminococcaceae, Bacteroidaceae), but a large proportion (>25%) was not assigned at the family level (Figure 4B). Then, the 90 IBS severity discriminating OTUs were ranked according to their average weight in the model (Supplementary Table 3). In this model, OTUs with a negative weight had a positive association with IBS severity. The proportion of OTUs that showed positive or negative weight in the model was similar within Firmicutes and Bacteroidetes phyla (Figure 4C). The number of genus-unassigned OTUs from the Firmicutes (notably in the Ruminococcaceae family)
increased when they were associated with IBS severity (Pearson chi-squared test, P < .05). In the Firmicutes phylum, including known and dominant genera such as Faecalibacterium, Oscillibacter, Blautia, and Coprococcus, OTUs were associated positively with IBS of moderate severity or healthy status. Finally, we compared the prev-alence of the 90 OTUs from the signature for IBS severity between healthy subjects and patients with severe IBS. The prevalence of OTUs that were associated positively to healthy status (ie, positive weight in the model signature) was significantly higher in the microbiota of healthy subjects compared with severe IBS patients (Wilcoxon test, P<.05) (Figure 4D).
Figure 4.Taxonomic assessment of OTU microbiota signature for IBS symptom severity. Axis represent the 2first compo-nents from principal coordinate (PCo) analysis based on the phylogenetic distance between OTU representative sequences. (A) 90 OTUs (blue dots) are selected of 2911 OTUs (red dots) by the machine learning procedure. (B) OTU microbiota signature for IBS severity colored by taxonomic assignation at family level. (C) OTU microbiota signature for IBS severity colored and sized by their weight and absolute weight in the model, respectively (green corresponding to a positive association to health and red corresponding to a positive association to IBS severity). (D) OTU prevalence enrichment in microbiota from healthy subjects as a function of their weight in the model (Wilcoxon test,P<.05).Green boxplotrepresents positive weight andred boxplotrepresents negative weight.
January 2017 Intestinal Microbiota and IBS Severity 117
CLINICAL
Gut Microbial Signature for IBS Severity
and Association With Clinical and
Microbial Parameters
To evaluate the robustness of the microbial signature for IBS severity in relationship to other clinical parameters, we investigated the relative abundance of OTUs along with clinical data in a co-inertia analysis as shown in Figure 5. Clinical parameters included age, BMI, HAD anxiety, HAD depression, exhaled CH4 and H2, IBS subtypes, stool
con-sistency (Bristol Stool Form) and frequency, and OATT. The
first 2 co-inertia components explained more than 50% of co-variation between the IBS severity signature microbial OTUs and clinical parameters.
The IBS-SSS was confirmed to be the most important fac-tor contributing to variation in the full data set along thefirst co-inertia component (PC1) (Figure 5A). In addition, OTUs that had a positive weight in the microbial signature were more prevalent in microbiota of healthy subjects and were associated positively with PC1 (Figure 5B). This suggests that OTUs selected by the machine learning procedure allowed ranking patients along the IBS severity scale (Figure 5C).
As expected, anxiety and depression were associated posi-tively with IBS severity and this association was reflected on the gut microbial signature (Spearman rho correlation with PC1 of -0.4 and -0.32, respectively,P<.05) (Supplementary Table 4). In addition, exhaled CH4concentration (Figure 5AandD) was
associated with both components PC1 (rho¼0.36;P<.05) and PC2 (rho¼0.44;P<.05). IBS-C and exhaled CH4
concentra-tions were the most important factors explaining the variation along the second co-inertia component PC2 (Figure 5AandE). This suggests that exhaled CH4was associated primarily with
slower transit and secondly with less severe symptoms. PC2 was to a lesser extent associated with OATT (rho¼0.54;P< .05) and stool consistency (rho¼-0.36;P<.05). This suggests that the machine learning procedure, which originally was set up to discriminate severe IBS from mild, moderate IBS and healthy subjects, selected additional OTUs to identify IBS-C patients with high concentrations of exhaled CH4. However,
the microbial signature for IBS severity was poorly explained by age, BMI, and H2concentrations as shown inFigure 5A.
We then tested a posteriori these 2first co-inertia com-ponents against microbiota parameters. These included mi-crobial richness, absence or presence of Methanobacteriales, and enterotype stratification (Figure 5C,D, andF, respectively), which altogether were associated significantly with thefirst component PC1 (Wilcoxon test, P < .05). When plotting IBS-SSS and microbial richness, the gut microbial signature for IBS severity was linked with lower microbial richness (Figure 5C), lower levels of exhaled CH4 (Figure 5D), and
Bacteroides-enriched enterotype (Figure 5F). This suggests that selected OTUs from the machine learning procedure discriminated patients along a symptom severity gradient together with enterotype stratification.
Gut Microbial Signature for IBS Severity and
Association With Diet and Use of Medications
A total of 111 individuals (89 IBS and 22 healthy) fol-lowed a 4-day food diary to assess nutrient intake. Average
daily intakes were calculated for energy, proportion of fat, carbohydrates, fiber, protein, and total intake of FODMAPs (Supplementary Table 5). By using a co-inertia analysis followed by a Monte Carlo test (see Supplementary Material), the overall association between dietary data and the gut microbial signature for IBS severity was tested, and no significant association could be detected (RV, 0.10; P > .05), indicating that the microbial signature for IBS severity is independent of overall nutrient intake, as well as intake of FODMAPs. Similar analyses regarding the influence of medications (Supplementary Table 6), including laxatives or bulking agents, acid suppressants (mainly proton pump inhibitors), antidiarrheals, and antidepressants drugs, did not show any significant associations with the microbial signature for IBS severity.
Discussion
In this study we characterized both fecal and mucosal microbiota in a large cohort of IBS patients and healthy subjects. By using a machine learning approach, we show that IBS symptom severity is associated with a distinct fecal microbiota signature that also is detected in the intestinal mucosa. This signature also is associated with microbial richness, exhaled CH4, presence of Methanobacteriales, and
enterotype stratification (assessed by using the Dirichlet multinomial mixture model), as well as stool consistency and transit time. Lower microbial richness and exhaled CH4,
as well as a reduced prevalence of Methanobacteriales and Prevotella enterotype, were observed in subjects with se-vere IBS. Interestingly, the prevalence of Prevotella enter-otype decreased as the severity of symptoms increased, in parallel to the increased prevalence of Bacteroides enter-otype. A graphic summary of the mainfindings is shown in
Figure 6.
We explored the data using a combination of approaches that are well described for microbiota analysis (ie, univariate and multivariate analyses). However, when using these classic ecologic approaches, no clear differences were observed between healthy subjects and IBS patients, or between IBS subtypes as defined by the Rome III criteria. No differences were detected in fecal microbiota between IBS and healthy subjects regarding a-diversity (microbial rich-ness), orb-diversity (pairwise JSD distance comparisons) at any taxonomy level (from phyla to species). Similarfindings were observed for mucosal microbiota. A trend toward a reduction in the richness of fecal microbiota was observed in IBS subjects. Rajilic-Stojanovic et al8did not report a change ina-diversity, but an almost 2-fold increase of the ratio of major bacterial phyla Firmicutes:Bacteroidetes in 62 IBS patients (Rome II criteria) compared with 46 healthy sub-jects. In a previous study from our group, although no overall differences in microbiota composition between 37 IBS (Rome II criteria) patients and 20 healthy subjects were observed, nevertheless 2 specific IBS subclusters with altered fecal microbiota composition were identified. Interestingly, the 2 IBS subclusters accounted for 60% of IBS patients in the study, and harbored an increased Firmicutes:Bacteroidetes ratio compared with that of healthy subjects and other IBS
CLINICAL
patients.9 Other studies, similar to ours, however, did not report significant differences between IBS and healthy sub-jects in either fecal or small intestinal microbiota, or reported conflicting results.15,37Recently, a larger cohort from Pozuelo et al38 similar to our study, reported in contrary a trend
toward a higher abundance of Bacteroidetes in 113 IBS (Rome III criteria) compared with 66 healthy subjects, as well as a lower richness in IBS subjects, probably driven by the high proportion of IBS-D subjects in that cohort. These dis-crepancies could be owing to several factors including Figure 5.Clinical and microbial ecology parameter interactions with microbial signature for IBS severity. A co-inertia analysis was performed between microbial signature OTU relative abundance for IBS severity and clinical parameters. (A) Scatter plot of 2first clinical data PC loadings. Each clinical parameter is labeled in red. (B) Scatter plot of 2first PC loadings for microbial signature OTU relative abundance. Color accounts for weight in the model for IBS severity. Negative weights indicate OTUs associated with severe IBS. Size accounts for OTU prevalence enrichment in healthy microbiota compared with severe IBS microbiota. Positive enrichment means that an OTU was found more frequently in healthy subjects than in severe IBS patients. (C–F) Scatter plot of 2first com-ponents of co-inertia analysis. Eachdotrepresents a fecal microbiota sample. (C) Size accounts for microbial richness and colors for the IBS symptom severity group. (D) Size accounts for exhaled CH4and color for Methanobacteriales presence. (E) Color accounts
for IBS subtypes. (F) Eachdotrepresents IBS fecal microbiota sized with IBS-SSS and colored by enterotypes.
January 2017 Intestinal Microbiota and IBS Severity 119
CLINICAL
heterogeneity of IBS cohorts (ie, proportion of IBS subtypes, with a majority of 1 subtype, and differences in symptom severity), as well as the use of different methods (machine learning vs descriptive statistics) and 16S rRNA gene variable regions used to analyze microbiota (Supplementary Table 7
and references within), and also an absence of validation
cohorts. However, differences between IBS patients and healthy subjects were observed in our study based on enterotype distribution, with healthy subjects being more likely to belong to thePrevotellaenterotype than IBS patients, with a concomitant increase in the prevalence of the Bacter-oidesenterotype in IBS.
Figure 6.Graphic summary of the methods and results of the study. An exploratory (n¼149) and a validation set (n¼46) of IBS patients and healthy subjects were included in the study. DNA was extracted from fecal and sigmoid biopsy samples to assess gut microbiota by 16S rRNA gene sequencing. Methanobacteriales were detected by quantitative PCR in fecal samples. Most of the IBS patients from the exploratory set were sampled twice. Subsequent analyses of 16S sequencing data included various approaches. First, ecologic analysis included a- and b-diversity assessment and enterotype detection. Second, the machine learning procedure was used to select gut microbiota OTUs and to train models based on IBS severity on the exploratory set. The resulting microbial signature allowed classifying mucosal samples of the exploratory set, and the stool samples of the validation set, based on IBS severity. Third, the microbial signature for IBS severity was taxonomically char-acterized and evaluated against clinical parameters. The microbial signature for IBS severity was associated with low microbial richness, low CH4exhaled,Bacteroidesenterotypes enriched, and absence of Methanobacteriales.
CLINICAL
We also explored paired mucosal and fecal microbiota data. The distinction between fecal and mucosal colonic microbiota in terms of composition already was detectable at the phylum level, with increased proportions of Bacter-oidetes and Proteobacteria in biopsy specimens, and a higher abundance of Firmicutes and Actinobacteria were observed in fecal samples. Our data also are supported in part by Rangel et al,16who observed different microbiota composition between mucosal and fecal samples in both healthy subjects and IBS patients, although the microbial diversity in biopsy specimens and fecal samples from their study was lower among IBS patients. In our study, the dif-ference in microbiota composition between fecal samples and biopsy specimens was accompanied by lower richness in biopsy specimens as compared with fecal samples in both healthy subjects and IBS patients, which is consistent with previous reports.39,40 Although microbiota from paired mucosal and fecal samples were structurally distinct and with differenta-diversity, their respective microbialb -diversity co-varied, which is consistent with the data ob-tained from the rhesus macaque microbiota.41 A larger number of biopsy samples would be needed to decipher whether mucosal microbiota is associated more strongly with IBS severity than fecal microbiota.
In this study, we complemented the microbiota compo-sition analysis by quantification of microbial groups able to produce CH4,42 so-called methanogens, which prevent H2
accumulation in the gut. Production of CH4 using H2 is
restricted to Archaea, with the order Methanobacteriales containing Methanobrevibacter smithii and Methanosphaera stadtmanae as the dominant methanogens in human beings.42,43 Evidence has emerged suggesting that CH4 is
linked to constipation,44 and it has been reported that M smithii is found more commonly in patients with IBS-C.45In our study, 33% of study subjects harbored detectable levels of Methanobacteriales, with no difference between healthy subjects and IBS patients. Interestingly, there was a signifi -cant correlation between exhaled CH4 and the detection of
Methanobacterialesby quantitative PCR, which is in line with previous findings.45 In our study, the presence of Meth-anobacteriales differed according to IBS subtypes. IBS-D patients had more undetectable Methanobacteriales compared with the other IBS subtypes. Moreover, Meth-anobacteriales detection was associated positively with mi-crobial richness in the enterotype Clostridiales in our study, which is in accordance with the study by Vandeputte et al.46 This enterotype also was associated with longer transit time, which is consistent with another recent study.47
We explored the data using a robust statistical analysis based on a machine learning algorithm because large mi-crobial data sets generated from sequencing technologies might generate overfitting and overestimation.48 Recently, there has been a growing interest in the use of machine learning techniques to detect microbiota signature in health and diseases.33,49In our study, the LASSO procedure iden-tified 90 bacterial OTUs that could be used as a composite gut microbial signature for IBS severity. The signature was robust and it still remained valid after cross-validation and testing in the validation cohort. The microbial signature was
enriched in taxonomically diverse phylotypes. At the family level, a similar proportion of OTUs within Lachnospiraceae and Ruminococcaceae were associated with health or IBS severity. OTUs known to be associated with health were more prevalent in healthy subjects than in severe IBS pa-tients. These OTUs include Faecalibacterium, Oscillibacter, Blautia, and Coprococcus species, which previously were reported to belong to the healthy microbiota phylogenetic core.50,51 The phylogenetic core may represent co-evolved species within the gut microbiome that support essential gut microbial functions.51 Finally, the microbial signature for IBS severity was tested against clinical and microbial parameters. IBS severity thus was confirmed to be the strongest factor associated with the microbial signature along with the presence of methanogens, exhaled CH4,
enterotype, and microbial richness. Overall, clinical param-eters other than IBS severity were not associated strongly with the microbial signature. Because recent studies re-ported transit time as a strong confounding factor for microbiota composition,46,47 it seems important to stress that OATT and IBS subtypes were not confounding factors for the microbial signature for IBS severity.
A limitation of the present study that could prevent extrapolation of the results to the general IBS population was that all patients were included at a secondary/tertiary referral center. It is well known that IBS patients seen in referral centers have more severe GI and psychological symptoms, as well as a reduced quality of life, and therefore do not reflect the general IBS population. Because it is well recognized that diet and intake of medications are 2 factors that shape gut microbiota,47,52we further examined whether the microbial signature for IBS severity was influenced by these 2 factors. Our analysis on global intake of nutrients (protein, carbohydrates, fat, and calorie intake), and intake of FODMAPs did not support a relationship between these food categories and our gut microbiota signature for IBS severity. Regarding the intake of medications, although patients with severe IBS, as expected, were more likely to be treated with antidepressants than patients with milder forms of IBS, the gut microbiota signature for IBS severity was neither asso-ciated significantly with intake of antidepressants, nor with intake of other groups of medications.
To conclude, by using a large cohort and classic ecologic approaches, we could not observe differences between healthy subjects and IBS patients. However, the machine learning approach allowed identification of a gut microbial signature for IBS severity, which also could be reproduced in a validation cohort. Importantly, because of its relatively low sensitivity, this microbiota signature cannot be used as a clinical predictor of IBS severity, but as a way to explore relevant features (ie, OTUs), which deserve to be explored in future IBS microbiota studies.
Our study highlights the heterogeneity of IBS patients, and the difficulty in stratifying patients based on a microbiota profile when using only classic ecologic approaches. The use of machine learning has allowed us to circumvent the issues related to large microbial data sets and to better explore the microbial data. We were able to identify several interesting links between gut microbiota and the clinical profile.
January 2017 Intestinal Microbiota and IBS Severity 121
CLINICAL
Supplementary Material
Note: To access the supplementary material accompanying this article, visit the online version of Gastroenterology at
www.gastrojournal.org, and at http://dx.doi.org/10.1053/ j.gastro.2016.09.049.
References
1. Almquist E, Törnblom H, Simrén M. Practical manage-ment of irritable bowel syndrome: a clinical review. Minerva Gastroenterol Dietol 2016;62:30–48.
2. Sood R, Law GR, Ford AC. Diagnosis of IBS: symptoms, symptom-based criteria, biomarkers or “ psycho-markers”? Nat Rev Gastroenterol Hepatol 2014;11: 683–691.
3. Rajilic-Stojanovic M, Jonkers DM, Salonen A, et al. In- testinal microbiota and diet in IBS: causes, conse-quences, or epiphenomena? Am J Gastroenterol 2015; 110:278–287.
4. Ohman L, Simrén M. Intestinal microbiota and its role in irritable bowel syndrome (IBS). Curr Gastroenterol Rep 2013;15:323.
5. Kassinen A, Krogius-Kurikka L, Mäkivuokko H, et al. The fecal microbiota of irritable bowel syndrome patients differs significantly from that of healthy subjects. Gastroenterology 2007;133:24–33.
6. Salonen A, de Vos WM, Palva A. Gastrointestinal microbiota in irritable bowel syndrome: present state and perspectives. Microbiology 2010;156:3205–3215. 7. Simrén M, Barbara G, Flint HJ, et al. Intestinal microbiota
in functional bowel disorders: a Rome foundation report. Gut 2013;62:159–176.
8. Rajilic-Stojanovic M, Biagi E, Heilig HGHJ, et al. Global and deep molecular analysis of microbiota signatures in fecal samples from patients with irritable bowel syn-drome. Gastroenterology 2011;141:1792–1801.
9. Jeffery IB, O’Toole PW, Öhman L, et al. An irritable bowel syndrome subtype defined by species-specific alter-ations in faecal microbiota. Gut 2012;61:997–1006. 10. Durbán A, Abellán JJ, Jiménez-Hernández N, et al.
Instability of the faecal microbiota in diarrhoea-predominant irritable bowel syndrome. FEMS Microbiol Ecol 2013;86:581–589.
11. Shankar V, Homer D, Rigsbee L, et al. The networks of human gut microbe-metabolite associations are different between health and irritable bowel syndrome. ISME J 2015;9:1899–1903.
12. Duboc H, Rainteau D, Rajca S, et al. Increase in fecal primary bile acids and dysbiosis in patients with diarrhea-predominant irritable bowel syndrome. Neuro-gastroenterol Motil 2012;24:513–e247.
13. Codling C, O’Mahony L, Shanahan F, et al. A molecular
analysis of fecal and mucosal bacterial communities in irritable bowel syndrome. Dig Dis Sci 2010;55:392–397. 14. Ng SC, Lam EFC, Lam TTY, et al. Effect of probiotic
bacteria on the intestinal microbiota in irritable bowel syndrome. J Gastroenterol Hepatol 2013;28:1624–1631. 15. Durbán A, Abellán JJ, Jiménez-Hernández N, et al. Structural alterations of faecal and mucosa-associated
bacterial communities in irritable bowel syndrome. Environ Microbiol Rep 2012;4:242–247.
16. Rangel I, Sundin J, Fuentes S, et al. The relationship between faecal-associated and mucosal-associated microbiota in irritable bowel syndrome patients and healthy subjects. Aliment Pharmacol Ther 2015;42: 1211–1221.
17. Harrell L, Wang Y, Antonopoulos D, et al. Standard colonic lavage alters the natural state of mucosal-associated microbiota in the human colon. PloS One 2012;7:e32545.
18. Longstreth GF, Thompson WG, Chey WD, et al. Func-tional bowel disorders. Gastroenterology 2006; 130:1480–1491.
19. Francis CY, Morris J, Whorwell PJ. The irritable bowel severity scoring system: a simple method of monitoring irritable bowel syndrome and its progress. Aliment Pharmacol Ther 1997;11:395–402.
20. Zigmond AS, Snaith RP. The hospital anxiety and depression scale. Acta Psychiatr Scand 1983;67: 361–370.
21. Böhn L, Störsrud S, Liljebo T, et al. Diet low in FODMAPs reduces symptoms of irritable bowel syndrome as well as traditional dietary advice: a randomized controlled trial. Gastroenterology 2015;149:1399–1407.e2.
22. Heaton KW, O’Donnell LJ. An office guide to whole-gut transit time. Patients’ recollection of their stool form. J Clin Gastroenterol 1994;19:28–30.
23. Törnblom H, Van Oudenhove L, Sadik R, et al. Colonic transit time and IBS symptoms: what’s the link? Am J Gastroenterol 2012;107:754–760.
24. Matsuki T, Watanabe K, Fujimoto J, et al. Use of 16S rRNA gene-targeted group-specific primers for real-time PCR analysis of predominant bacteria in human feces. Appl Environ Microbiol 2004;70:7220–7228.
25. Godon JJ, Zumstein E, Dabert P, et al. Molecular mi-crobial diversity of an anaerobic digestor as determined by small-subunit rDNA sequence analysis. Appl Environ Microbiol 1997;63:2802–2813.
26. Edgar RC. UPARSE: highly accurate OTU sequences from microbial amplicon reads. Nat Methods 2013; 10:996–998.
27. Yu Y, Lee C, Kim J, et al. Group-specific primer and probe sets to detect methanogenic communities using quantitative real-time polymerase chain reaction. Bio-technol Bioeng 2005;89:670–679.
28. Oksanen J, Blanchet F, Kindt R, et al. Vegan: community ecology package. R package version 1.17-1, 2010. R Package Version 2010:1–17.
29. Arumugam M, Raes J, Pelletier E, et al. Enterotypes of the human gut microbiome. Nature 2011;473:174–180. 30. Holmes I, Harris K, Quince C. Dirichlet multinomial
mix-tures: generative models for microbial metagenomics. PloS One 2012;7:e30126.
31. Tibshirani R. Regression shrinkage and selection via the lasso: a retrospective. J R Stat Soc Ser B Stat Methodol 2011;73:273–282.
32. Fan R-E, Chang K-W, Hsieh C-J, et al. LIBLINEAR: a library for large linear classification. J Mach Learn Res 2008;9:1871–1874.
CLINICAL
33. Zeller G, Tap J, Voigt AY, et al. Potential of fecal micro-biota for early-stage detection of colorectal cancer. Mol Syst Biol 2014;10:766.
34. Dray S, Chessel D, Thioulouse J. Co-inertia analysis and the linking of ecological data tables. Ecology 2003; 84:3078–3089.
35. Tap J, Furet J-P, Bensaada M, et al. Gut microbiota richness promotes its stability upon increased dietary
fibre intake in healthy adults. Environ Microbiol 2015; 17:4954–4964.
36. Benjamini Y, Hochberg Y. Controlling the false dis-covery rate: a practical and powerful approach to multiple testing. J R Stat Soc Ser B Methodol 1995; 57:289–300.
37. Dlugosz A, Winckler B, Lundin E, et al. No difference in small bowel microbiota between patients with irritable bowel syndrome and healthy controls. Sci Rep 2015; 5:8508.
38. Pozuelo M, Panda S, Santiago A, et al. Reduction of butyrate- and methane-producing microorganisms in patients with irritable bowel syndrome. Sci Rep 2015; 5:12693.
39. Ringel Y, Maharshak N, Ringel-Kulka T, et al. High throughput sequencing reveals distinct microbial pop-ulations within the mucosal and luminal niches in healthy individuals. Gut Microbes 2015;6:173–181.
40. Carroll IM, Ringel-Kulka T, Keku TO, et al. Molecular analysis of the luminal- and mucosal-associated intesti-nal microbiota in diarrhea-predominant irritable bowel syndrome. Am J Physiol Gastrointest Liver Physiol 2011; 301:G799–G807.
41. Yasuda K, Oh K, Ren B, et al. Biogeography of the in-testinal mucosal and lumenal microbiome in the rhesus macaque. Cell Host Microbe 2015;17:385–391.
42. Chaudhary P, Gaci N, Borrel G, et al. Molecular methods for studying methanogens of the human gastrointestinal tract: current status and future directions. Appl Microbiol Biotechnol 2015;99:5801–5815.
43. Dridi B, Henry M, El Khéchine A, et al. High prevalence of
Methanobrevibacter smithiiand Methanosphaera stadt-manae detected in the human gut using an improved DNA detection protocol. PLoS One 2009;4:e7063. 44. Sahakian AB, Jee S-R, Pimentel M. Methane and the
gastrointestinal tract. Dig Dis Sci 2010;55:2135–2143. 45. Kim G, Deepinder F, Morales W, et al.Methanobrevibacter
smithiiis the predominant methanogen in patients with constipation-predominant IBS and methane on breath. Dig Dis Sci 2012;57:3213–3218.
46. Vandeputte D, Falony G, Vieira-Silva S, et al. Stool consistency is strongly associated with gut microbiota richness and composition, enterotypes and bacterial growth rates. Gut 2016;65:57–62.
47. Falony G, Joossens M, Vieira-Silva S, et al. Population-level analysis of gut microbiome variation. Science 2016; 352:560–564.
48. Knights D, Costello EK, Knight R. Supervised classifi -cation of human microbiota. FEMS Microbiol Rev 2011; 35:343–359.
49. Forslund K, Hildebrand F, Nielsen T, et al. Disentangling type 2 diabetes and metformin treatment signatures in the human gut microbiota. Nature 2015;528:262–266. 50. Tap J, Mondot S, Levenez F, et al. Towards the human
intestinal microbiota phylogenetic core. Environ Micro-biol 2009;11:2574–2584.
51. Qin J, Li R, Raes J, et al. A human gut microbial gene catalogue established by metagenomic sequencing. Nature 2010;464:59–65.
52. Spanogiannopoulos P, Bess EN, Carmody RN, et al. The microbial pharmacists within us: a metagenomic view of xenobiotic metabolism. Nat Rev Microbiol 2016;14:273–287.
Received January 26, 2016. Accepted September 29, 2016.
Reprint requests
Address requests for reprints to: Magnus Simrén, MD, Department of Internal Medicine & Clinical Nutrition, Institute of Medicine, Sahlgrenska Academy,
Univerity of Gothenburg, 40530 Gothenburg, Sweden. e-mail:
[email protected]; fax: þ4-631-741-2917; or Muriel Derrien, PhD, Danone Nutricia Research, Avenue de la Vauve, Palaiseau, France. e-mail:[email protected]; fax:þ3-316-935-7042.
Acknowledgments
The authors acknowledge Anne Druesne and Chenhong Zhang for technical assistance with DNA extraction and Johan van Hylckama Vlieg for valuable discussions. Martin Balvers and Jolanda Lamberts are deeply acknowledged for their bioinformatics support in microbiota analysis. The quantitative polymerase chain reaction used was operated under Yakult License (YIFSCAN technology, Tokyo, Japan). The authors thank Crea Nostra (www. creanostra.fr) for the graphic summary icons inFigure 6.
Conflicts of interest
These authors disclose the following: Boris Le Nevé, Muriel Derrien, Rémi Brazeilles, Stéphanie Cools-Portier, and Julien Tap are employees of Danone Research; Muriel Simrén has received unrestricted research grants from Danone and AstraZeneca, and has served as a consultant/advisory board member for AstraZeneca, Danone, Novartis, Almirall, Albiroe, Shire, Nestlé, Glycom, and Chr Hansen, and has served on the speaker’s bureau for Takeda, Tillotts, Shire, Almirall, Menarini, and Danone; Lena Öhman has receivedfinancial support for research from Danone Research, has served as a consultant for Genetic Analyses, and has received lecture fees from AbbVie and Takeda; Joël Doré has received financial support for research from Danone Research, Pfizer, and PiLeJe, and has served as a consultant/ advisory board member for Danone Research, AlphaWasserman, Enterome Bioscience, and MaaT Pharma; and Hans Törnblom has served as a consultant/advisory board member for Almirall, Allergan, Danone, and Shire, and has been on the speakers’ bureau for Tillotts, Takeda, Shire, and Almirall. The remaining author discloses no conflicts.
Funding
This research was supported by the Swedish Medical Research Council (grants 13409, 21691, and 21692), AFA (Arbetsmarknadens Försäkringsaktiebolag) Insurance, The Marianne and Marcus Wallenberg Foundation, Centre for Person-Centered Care, Sahlgrenska Academy, University of Gothenburg, the Faculty of Medicine at the University of Gothenburg, VINNOVA, as well as by Danone Nutricia Research.
January 2017 Intestinal Microbiota and IBS Severity 123
CLINICAL
Supplementary Materials and Methods
Questionnaires
Patients with IBS who were enrolled in the study completed questionnaires to characterize their symptom severity and bowel habits. The IBS-SSS was used to assess the severity of IBS symptoms.1 This is a well-validated ques-tionnaire that is based on 5 items: intensity and frequency of abdominal pain, severity of abdominal distension, bowel habits dissatisfaction, and interference with daily life. The maximum score is 500 and patients can be categorized as having mild (<175), moderate (175–300), or severe (>300) IBS symptoms. General anxiety and depression were evalu-ated by the HAD scale.2This is a 14-item questionnaire used to measure the severity of anxiety and depression on 2 subscales with 7 items each. Each item is scored between 0 and 3, with higher scores indicating more severe symptoms and with a total score range per subscale of 0–21.
The patients reported all bowel movements in a daily diary for 2 weeks, based on the Bristol Stool Form scale.3The stool consistency was scored on a 7-point scale: type 1 (separate hard lumps similar to nuts, difficult to pass), type 2 (sausage shaped but lumpy), type 3 (similar to a sausage but with cracks on the surface), type 4 (similar to a sausage or snake, smooth and soft), type 5 (soft blobs with clear-cut edges), type 6 (fluffy pieces with ragged edges, a mushy stool), and type 7 (watery, no solid pieces, entirely liquid). Based on this information, the stool frequency (average number of stools/day) and stool consistency (average stool consistency/day) could be calculated. A total of 111 subjects (89 IBS and 22 healthy) completed a food diary for 4 days (3 weekdays and 1 day during the weekend). The diary included details regarding cooking methods, ingredients, brands of foods (if appropriate), time points for meals, and quantity consumed in grams or household measurements. Patients were given written instructions to enable accurate comple-tion of the food record. The subjects were instructed to consume their usual diet. Different food items and beverages were entered in DIETIST XP version 3.1 (Kostdata.se, Stockholm, Sweden), which converts food items into nutri-ents and energy amounts. Composite foods (eg, casseroles) were split into ingredients (food items). DIETIST XP software covers approximately 1600 foods and 52 nutrients. DIETIST XP is designed to estimate macronutrients and micro-nutrients and energy intake. From the food records, average daily intakes were calculated for energy, proportion of fat, carbohydrates, protein, and FODMAPs. All nutrients in the software DIETIST XP are based on food composition data from the National Food Administration in Sweden, except for the FODMAPs, which were calculated using a new Swedish database for content of lactose, fructose, galacto-oligosaccharides, fructans, and polyols in foods used in Swedish diets (Liljebo et al, unpublished data).
Oro-Anal Transit Time Measurement
For the OATT measurement, the participants ingested 10 radiopaque rings every morning for 5 days. On day 6,
they ingested 5 radiopaque rings at 8:00 AM and 5 radi-opaque rings at 8:00 PM to better define participants with accelerated transit. On the morning of day 7 the radi-opaque rings still present in the bowel were counted at arrival at the laboratory, using fluoroscopy (Exposcop 7000 Compact; Ziehm GmbH, Nüremberg, Germany). OATT expressed in days was calculated by dividing the number of retained radiopaque rings by the daily dose (ie, 10).4All medications with known effects on the GI tract (proton pump inhibitors, laxatives, antidiarrheals, opioid analge-sics, prokinetics, spasmolytics, antidepressants) were dis-continued at least 48 hours before intake of the first radiopaque rings.
Breath CH
4and H
2Measurements
This test was performed after an overnight fast (ie, not after intake of any substrate), and after the subjects had received thorough instructions to avoid a diet rich infiber and poorly absorbed carbohydrates the day before the test. The amount of exhaled H2and CH4was measured in parts per
million in end-expiratory breath samples collected in a sys-tem used for the sampling and storing of alveolar air (GaSampler System; QuinTron Instrument Company, Mil-waukee, WI) and analyzed immediately using a gas chro-matograph (QuinTron Breath Tracker; QuinTron Instrument Company).
Collected Data and Missing Values
A total of 196 subjects were included in this study. Information about sex, age, and BMI were available for all 196 subjects, exhaled H2 and CH4 in the fasting state and
HAD in 185 subjects, Bristol stool form data in 166 subjects, and OATT in 181 subjects. IBS severity and subtypes were available in 133 of 139 IBS patients. Methanogen qPCR detection was performed on 231 of 278 fecal samples.
Microbial DNA Extraction From
Biopsy Specimens
Once collected, biopsy specimens were placed immedi-ately in liquid nitrogen and stored at -80C until further analysis. Mucosal adherent microbiota DNA was isolated using the adapted protocol from Godon et al5for low biomass samples.
Nucleic acids were precipitated by adding 1 mL of isopropanol in each tube. Samples were stored overnight at 4C. After centrifugation for 1 hour (12,700 rpm; 4C), pellets were dissolved in 450mL phosphate buffer (Na2HPO4, pH 8,
0.1 mol/L) and 50mL potassium acetate (5 mol/L acetate, 3 mol/L potassium) for 90 minutes at 4C and then centrifuged (30 min; 12,700 rpm; 4C). Supernatants were transferred in a sterile tube with 2 mL RNase (10 mg/mL). Tubes were incubated for 30 minutes at 37C. A total of 50mL of sodium acetate and 1 mL of 100% ethanol was added and tubes were mixed gently. After being stored overnight at -20C, tubes were centrifuged for 1 hour (12,700 rpm; 4C). The resulting pellet was washed with 1 mL of ethanol (70%) and centri-fuged for 5 minutes (12,700 rpm). The supernatant was discarded and the washing procedure was repeated once. Once dried, up to 100mL of 10 mmol/L Tris Cl pH 8, 1 mmol/L EDTA pH 8 was added to each tube to dissolve the purified DNA. DNA was stored at -20C until further analysis.
Microbial Composition Assessment
Quality filtering was performed using SDM software.6 Reads were filtered further for minimal and maximal length, any ambiguous nucleotides, barcode and primer er-rors, and homopolymeric nucleotide runs. The default criteria parameter adapted to the 454 sequencing platform were provided by LotuS. High-quality sequence criterion (read average quality, 27; minimal sequence length, 250; no ambiguous bases, maximum of homopolymer, 8; no mismatch allowed in primers barcode and primers, windows quality threshold average of 25 from quality window of 50 bases) was used to build OTUs. High-quality and midquality sequences were mapped to count the occurrence of estab-lished OTUs in a single sample. OTU clustering at 97% identity was performed with UPARSE, which embedded UCHIME as chimera readsfilterer. Each representative OTU sequence was aligned and taxonomically assigned using Greengenes database34 (release version 13.8, August 2013) and RDP II database35 (release version 11).
OTU Prevalence and Phylogenetic Assessment
The prevalence of each OTU from the gut microbiota signature for IBS severity was estimated in both healthy subjects and severe IBS patients, and was defined as the proportion of subjects for whom a specific OTU was detected. The prevalence of each OTU in severe IBS patients then was subtracted from the prevalence of the same OTU in healthy subjects. Hence, OTUs with a positive value were enriched in healthy subjects, and OTUs with a negative value were enriched in severe IBS patients. To assess the phylogenetic relationship between OTUs, pairwise nucleo-tide sequence identities were computed between OTU representative sequences using the SeqinR R package.7 A principal coordinate analysis then was performed to assess the phylogenetic specificity of the signature.Co-inertia Analysis and RV Coef
fi
cient
Co-inertia analysis is an ordination method for coupling 2 (or more) sets of parameters (eg, clinical parameters and
microbiota OTU proportion) by looking at their linear combinations. Thus, co-inertia analysis enables the simul-taneous ordination of several tables. Co-inertia analysis is related to other multivariate analyses such as canonical correlation analysis. In the case of co-inertia analysis, the co-inertia (the sum of the square of covariance) between the 2 sets is maximized and decomposed. Hence, the co-inertia value is a global measure of the co-structure be-tween the 2 data sets. Co-inertia is high when the 2 sets vary together and low when they vary independently.8
Depending on the data set, co-inertia analysis is coupled with principal component analysis or correspondence anal-ysis. In this study, we used co-inertia analysis for 2 types of data set coupling: (1) 2 independent principal coordinate analyses were computed based on fecal and mucosal microbiota composition using JSD distance metric and then subjected to a co-inertia analysis (Figure 1); and (2) prin-cipal component analysis were computed on microbiota OTU signatures for IBS severity and successively coupled with a principal component analysis computed from clinical parameters (Figure 5), diet, and medication intake.
The overall relatedness of the 2 data sets was measured by the RV coefficient.8The RV coefficient is the coefficient of correlation between 2 tables (eg, in this study, between the 2 fecal and mucosal microbiota JSD distance matrices). A Monte Carlo test was used to test the robustness of the RV coefficient.
Statistical Modeling By Machine Learning
We used a custom pipeline in R (R version 3.10) to extract the most discriminative features from fecal microbiota OTU composition to distinguish patients with severe IBS from the mild or moderate IBS and heathy controls. Here, we used the LASSO logistic regression classifier9 implemented in LIB-LINEAR,10 similar to Zeller et al,11because it generates a parsimonious classification model that selects only a few features out of a potentially very large set.
Briefly, our pipelines were as follows (see Zeller et al11 for more details).
1. Feature transformation: we applied a log-transformation and subsequently standardized fea-tures (by centering to mean 0 and dividing by each features’SD to which we added the 10th percentile of SDs across all features).
2. Partitioning data for 10-fold stratified cross-validation (we resampled data set partitions 10 times to obtain more stable accuracy estimates).
3. Fitting a LASSO model on the training data of each cross-validation fold: the LASSO hyperparameter was optimized for each model in a nested 5-fold cross-validation on the training subset using the area un-der the precision–recall curve as model selection criterion and also enforcing at least 5 nonzero coefficients.
4. Application of the trained LASSO models to obtain the corresponding cross-validation test predictions.
Because of the resampled cross-validation (and also in external validation), there were several test pre-dictions for each test examples. To obtain a single prediction score per example, we averaged all test predictions (from 10 or 100 models in cross-validation or external cross-validation, respectively).
5. Model evaluation using AUROC analysis: 10-fold cross-validation repeated 10 times, we obtained the mean test prediction scores, which we subjected to model performance analysis (Figure 3).
6. Model interpretation and marker extraction: features (bacterial OTUs) with potential association with IBS severity were extracted as nonzero coefficients from all 100 LASSO models (trained in 10 times resampled 10-fold cross-validation).
Supplementary References
1. Francis CY, Morris J, Whorwell PJ. The irritable bowel severity scoring system: a simple method of monitoring irritable bowel syndrome and its progress. Aliment Pharmacol Ther 1997;11:395–402.
2. Zigmond AS, Snaith RP. The hospital anxiety and depres-sion scale. Acta Psychiatr Scand 1983;67:361–370. 3. Heaton KW, O’Donnell LJ. An office guide to whole-gut
transit time. Patients’ recollection of their stool form. J Clin Gastroenterol 1994;19:28–30.
4. Törnblom H, Van Oudenhove L, Sadik R, et al. Colonic transit time and IBS symptoms: what’s the link? Am J Gastroenterol 2012;107:754–760.
5. Godon JJ, Zumstein E, Dabert P, et al. Molecular microbial diversity of an anaerobic digestor as deter-mined by small-subunit rDNA sequence analysis. Appl Environ Microbiol 1997;63:2802–2813.
6. Hildebrand F, Tadeo R, Voigt A, et al. LotuS: an efficient and user-friendly OTU processing pipeline. Microbiome 2014;2:30. 7. Charif D, Lobry J. SeqinR 1.0-2: a contributed package to the R Project for statistical computing devoted to biological sequences retrieval and analysis. In: Bastolla U, Porto M, Roman HE, et al, eds. Structural approaches to sequence evolution. Biological and medical physics, biomedical en-gineering. Berlin: Springer, 2007:207–232; Available at:
http://dx.doi.org/10.1007/978-3-540-35306-5_10. 8. Dray S, Chessel D, Thioulouse J. Co-inertia analysis and
the linking of ecological data tables. Ecology 2003; 84:3078–3089.
9. Tibshirani R. Regression shrinkage and selection via the lasso: a retrospective. J R Stat Soc Ser B Stat Methodol 2011;73:273–282.
10. Fan R-E, Chang K-W, Hsieh C-J, et al. LIBLINEAR: a library for large linear classification. J Mach Learn Res 2008;9:1871–1874.
Supplementary Figure 1.Clinical and demographic distribution characteristics for IBS patients and healthy subjects in the 2 study cohorts. (A) Density probability is represented by aviolin plotand interquartile range is represented byboxplotin white. No difference was observed between the exploratory and validation set. As expected, without correction for test multiplicity, HAD anxiety and Depression scores were higher in IBS patients than in healthy subjects (P<.05). (B) Gender distribution in healthy subjects and IBS patients (P>.05). BSF, Bristol Stool Form.