CELLULAR OPTOGENETICS FOR SPATIOTEMPORAL CONTROL OF KINASE SIGNALING AND BIOLOGICAL TROJAN HORSES FOR LIGHT-MEDIATED DRUG
RELEASE
Colin Padraic O’Banion
A dissertation submitted to the faculty at the University of North Carolina at Chapel Hill in partial fulfillment of the requirements for the degree of Doctor of Philosophy in the Division of
Chemical Biology and Medicinal Chemistry in the Pharmaceutical Sciences Department in the Eshelman School of Pharmacy
Chapel Hill 2016
Approved by: David S. Lawrence Michael B. Jarstfer
Rihe Liu James E. Bear
ii © 2016
iii
ABSTRACT
Colin Padraic O’Banion: Cellular Optogenetics for Spatiotemporal Control of Kinase Signaling and Biological Trojan Horses for Light-mediated Drug Release
(Under the direction of David Lawrence)
Light provides an instantaneous, orthogonal, and spatially targeted tool to control cellular biochemistry and perform photochemistry. In the first three chapters of my thesis, I will discuss light as a tool for controlling intracellular communication. Intracellular signaling via kinases is highly controlled in space and time. While many tools exist that allow us to modulate signaling events on a global scale or observe signaling events with high spatial and temporal resolution, there are relatively few tools that are amenable to studying subcellular compartmentalized signaling. To this end, I have developed two optogenetic proteins for investigating the localized functions of 1) protein kinase A and 2) its second messenger cAMP. The optogenetic protein kinase A takes advantage of the Cry2-Cib photodimerizing pair. In short, a protein kinase A catalytic subunit with low constitutive activity was fused to Cry2 such that, upon stimulation with light, it translocates to whatever subcellular region Cib is localized to and activity is restored. In order to investigate localized cAMP signaling, a photoactivated adenylate cyclase was engineered to be expressed at specific subcellular locations. Upon activation with light, large increases in cellular cAMP levels are observed resulting in down-stream signaling events. I am still tweaking the photoactivated adenylate cyclase to control local cAMP signaling.
iv
v
To my family and friends. Mom, Dad, and Dorothy you have provided me with endless support both in life and science. Friends, thanks for keeping me sane throughout this entire
vi
ACKNOWLEDGEMENTS
I would like to thank my advisor Dr. David Lawrence for all of his support along the way. He has provided me with an ideal training environment for my learning style and I am incredibly grateful for the mentoring that he’s provided me.
All of the members of the Lawrence lab have been indispensable in my pursuit of a PhD. I would like to thank Dr. Melanie Priestman, Dr. Robert Hughes, Dr. Nathan Oien, Dr. Weston Smith, Dr. Zach Rodgers, Dr. Qunzhao Wang, Dr. Song Ding, Dr. Luong Nguyen, Dr. Anwesha Goswami, Marissa Cann, David Friedman, and Christina Marvin. You all have provided me with guidance and collaboration in science and life.
Thank you to my committee, you’ve provided me with a great deal of insight and guidance through these years. You never fail to reel me in when I get too far out there. A big thanks to Dr. Jim Bear. Your insights into ways to approach my projects have been absolutely indispensable, and the reagents your group provided to me have allowed me to make progress when I was stuck.
I would like to thank Dr. Leslie Parise and Dr. Stephen Holly for collaborating with us to finish up the PARs section of the work outlined in Chapter 5.
Thank you Dr. Debbie Cholon and Dr. Martina Gentzsch for our continued efforts in getting CFTR experiments to work… I know we’ll get it some day!
vii
I would like to acknowledge Dr. Matthew Parrot for collaborating with us to photolyze cobalamin with Cherenkov Radiation.
I’d especially like to thank the chemists in the Lawrence lab (Dr. Qunzhao Wang, Dr. Weston Smith, Dr. Luong Nguyen, Dr. Zach Rodgers, Dr. Thomas Shell, and David
Friedman). Thank you for putting up with my constant requests for new compounds. I would like to acknowledge my friends and collaborators Dr. Nat Moorman and Heather Vincent (as well as other members of the Moorman lab) for our work together drinking beers and loading viruses with therapeutics. I hope that this turns into a great collaboration.
Finally, I need to thank my family and friends. My father has been a constant source of inspiration and guidance to me throughout my entire life and especially during my time at UNC. Mom, you’re the best, thank you for being such a strong supporter of my dreams and ambitions.
Friends, I could not have done this without you. Be it long evenings of chatting science over beers or blowing off steam to keep a thread of sanity in our lives, it made my time in graduate school a blast. The thread, Luke, Katie, Bryce, Geden, Perfetti, Cindy, Puz, Stevie Keys, Joey, Lance, Dat, Jarod, and everyone else, you guys are the best. I look forward to working and playing with you all in the future and hope that we all attain our dreams. Also, thanks to the craft brewers of the world and the Beer Study, you’ve provided countless moments of scientific insight during conversations over your delicious wares.
viii
TABLE OF CONTENTS
ABSTRACT ... iii
ACKNOWLEDGEMENTS ... vi
LIST OF FIGURES ... xi
LIST OF TABLES ... xvii
LIST OF ABBREVIATIONS ... xviii
CHAPTER 1: CAMP, PKA, AND OPTOGENETICS: ILLUMINATING SPATIAL AND TEMPORAL INTRACELLULAR SIGNALING ... 1
Introduction ... 1
Section 1.1: cAMP the first second messenger ... 3
Section 1.2: The cAMP dependent protein kinase: a ubiquitous signaling pathway as a model for compartmentalized signaling ... 5
Section 1.3: Tools for imaging and controlling cAMP/PKA signaling ... 10
Section 1.4: Optogenetics: a route to spatial and temporal control of kinase signaling .... 15
CHAPTER 2: DEVELOPING AN OPTOGENETIC PKA CATALYTIC SUBUNIT... 23
Introduction ... 23
Results and Discussion ... 25
Section 2.1: In vitro validation of C subunit mutant activity ... 25
Section 2.2: Generation of OPKA constructs and assessment of subcellular recruitment ... 27
Section 2.3: Development and characterization of a PKA reporter ... 29
Section 2.4: Determining the relative activities of OPKA constructs ... 30
Section 2.5: OPKA activity is spatially selective ... 31
ix
Section 2.7: Discussion ... 41
Section 2.8: Materials and Methods ... 47
CHAPTER 3: AN OPTOGENETIC ADENYLATE CYCLASE FOR SPATIAL AND TEMPORAL CONTROL OF CAMP MICRODOMAINS ... 60
Introduction ... 60
Section 3.1: Generation of a small library of subcellular targeted PACs ... 62
Section 3.2: Validating light activation of PACs ... 63
Section 3.3: Quantifying light induced cAMP production by PACs in MVD7 cells. ... 69
Section 3.4: Investigating subcellular PAC activity in MVD7 cells with the VASP reporter ... 71
Section 3.5: PKA dynamics in the nucleus via long term stimulation of PACs ... 76
Section 3.6: Discussion: towards spatial segregation of subcellular cAMP and biological studies utilizing PACs ... 79
Section 3.7: Materials and Methods ... 83
CHAPTER 4: PHOTOCHEMICAL PROTECTING GROUPS AND CELLULAR CARRIERS FOR DEVELOPING DRUG DELIVERY PLATFORMS... 91
Section 4.1: Challenges in drug delivery and the treatment of disease ... 91
Section 4.2: Photoprotecting groups as a route to spatial and temporal control of biological function ... 95
Section 4.3: Erythrocytes and neural stem cells as drug delivery depots ... 99
CHAPTER 5: THE PLASMA MEMBRANE AS A RESERVOIR, PROTECTIVE SHIELD, AND LIGHT-TRIGGERED LAUNCH PAD FOR PEPTIDE THERAPEUTICS... 107
Section 5.1: Abstract ... 107
Section 5.2: Background ... 107
Section 5.3: Light-triggered release of a cell permeable peptide. ... 109
Section 5.4: Light-triggered release of a peptide hormone. ... 115
x
Section 5.6: Conclusions ... 125
Section 5.7: Materials and Methods ... 126
CHAPTER 6: NEURAL STEM CELL MEDIATED DELIVERY OF COBALAMIN PHOTOTHERAPEUTICS TO GLIOBLASTOMA ... 159
Section 6.1: Introduction ... 159
Section 6.2: Delivery of NSC loaded drug-like phototherapeutics to HeLa cells ... 162
Section 6.3: Investigation of loading non-photocleavable Cy5-Cbl derivatives with different lipid tails... 162
Section 6.4: Assessing migratory aptitude of NSCs loaded with Cy5-alkynyl-Cbl compounds ... 169
Section 6.5: Assessment of Cbl cytotoxicity ... 170
Section 6.6: Light mediated release of Colchicine-Cbl in NSCs ... 172
Section 6.7: Future directions and discussion ... 173
Section 6.8: Materials and Methods ... 186
xi
LIST OF FIGURES
Figure 1.1 cAMP is generated via reaction of ATP with adenylate cyclase and is
rapidly hydrolyzed by intracellular phosphodiesterases. ... 4
Figure 1.2: cAMP binds to the R subunits on the PKA holoenzyme releasing C subunits to phosphorylate various substrates. ... 6
Figure 1.3: Overall PKA architecture.. ... 7
Figure 1.4: AKAP79 associates with AMPARs and β-ARs at the post-synaptic density where it regulates local activity.. ... 9
Figure 1.5: A schematic representation of the mechanism of action of the first cAMP/PKA live cell imaging tool... 11
Figure 1.6: Representative schematics of ICUE, CNG, and AKAR activity reporters. ... 13
Figure 1.7: Shows the various chromophores for both fluorescent proteins and photosensory domains. ... 16
Figure 1.8: Spectral properties of bPAC... 20
Figure 2.1: Schematic representation of OPKA and Cry2-Cib. ... 26
Figure 2.2: In vitro data showing cAMP independent C subunit activity ... 26
Figure 2.3: Graphs representing association and dissociation of OPKA constructs. ... 28
Figure 2.4: Description of ICUE and AKAR reporters. ... 30
Figure 2.5: Characterization of PKA reporter. ... 31
xii
Figure 2.7: 1 min light experiments with OPKA. ... 34
Figure 2.8: Subcellular compartment specific OPKA activity ... 35
Figure 2.9: Identification of uknown phosphoprotein using OPKA. ... 36
Figure 2.10: Gels from OPKA proteomics experiment. ... 37
Figure 2.11: IP experiments identifying COPE as phosphoprotein. ... 38
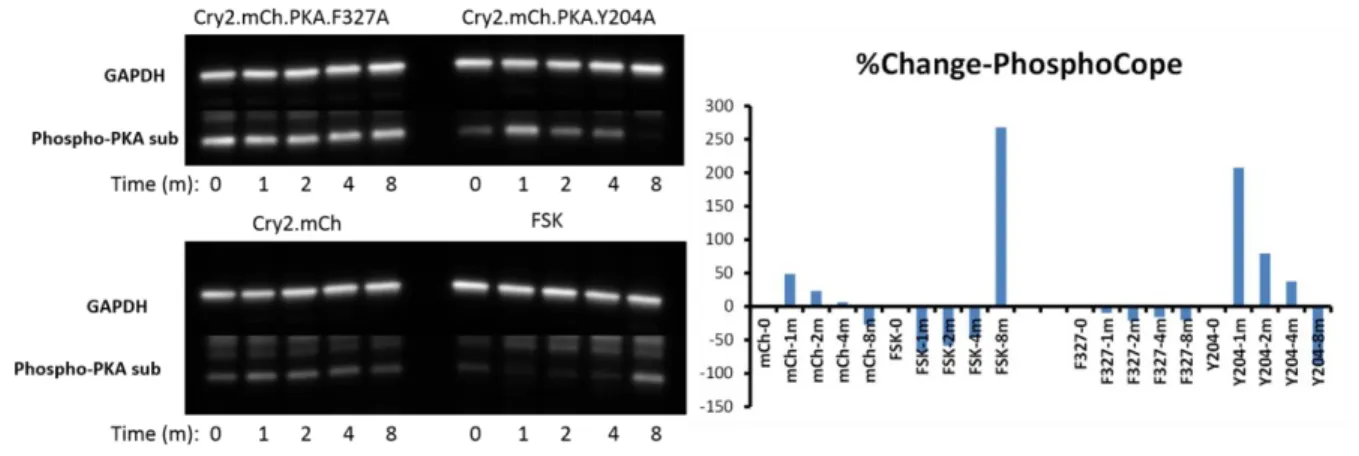
Figure 2.12: Time course experiments of OPKA phosphorylation of COPE. ... 39
Figure 2.13: Quantitation of Wesern blots comparing 293T cells fed with glucose vs. galactose. ... 40
Figure 2.14: OPKA mediated phosphorylation of mitochondria. ... 41
Figure 2.15: Axonal branching images. ... 43
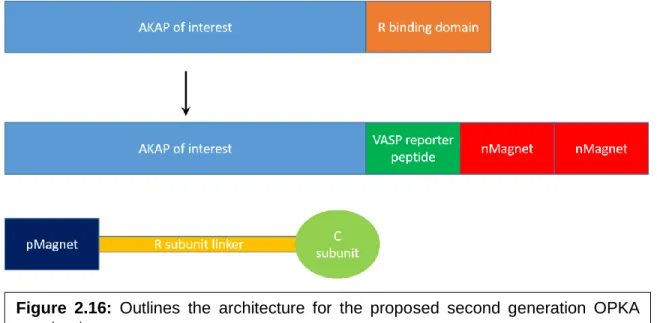
Figure 2.16: Outlines the architecture for the proposed second generation OPKA constructs. ... 47
Figure 3.1: PAC design and representative images. ... 63
Figure 3.2: PAC activation results in VASP and Drp1 phosphorylation ... 64
Figure 3.3: rat2 FP4-mito cells transduced with lentivirus containing Nu-AC before and after FACS. ... 66
Figure 3.4: Dose response curve for forskolin induced VASP phosphorylation. ... 67
xiii
Figure 3.6: Comparison of VASP phosphorylation in rat2 FP4 cells. ... 69
Figure 3.7: Quantitation of cAMP produced by PACs in MVD7 cells. ... 70
Figure 3.8: General scheme for VASP reporter experiments in MVD7 cells. ... 71
Figure 3.9: Examples of single excitation experiments in MVD7 cells. ... 72
Figure 3.10: VASP reporter experiments by Western blot. ... 73
Figure 3.11: Representative graphs of lightration experiments ... 74
Figure 3.12: Outlines the experimental design and results from a 1 second pulse of 440 nm light on MVD7 cells with PACs and reporters at indicated locations.. ... 75
Figure 3.13: Effects of PDE inhibition on PAC induced reporter phosphorylation ... 76
Figure 3.14: Long term light experiments with PACs ... 79
Figure 3.15: Mitochondrial motion in response to PAC activation. ... 81
Figure 3.16: PKA C subunit translocation to nucleus... 83
Figure 3.17: Schematic representation of pLL 5.5. ... 84
Figure 4.1: Outlines the structure and mechanism of action by which Mylotarg functions…. ... 94
Figure 4.2: A sample of different nitrobenzyl caged biomolecules. ... 96
Figure 4.3: The optical window of tissue ... 97
xiv
Figure 4.5: Description of RBC treatments for cerebral ischemia ... 101
Figure 4.6: Reprentative image of NSC migration to GBM ... 104
Figure 4.7: Representative drawing of NSC migration to GBM experimental paradigm ... 105
Figure 4.8: Various mechanisms of NSC migration to GBMs. ... 106
Figure 5.1: Schematic representation of lipid pools as a protecting group for peptides ... 109
Figure 5.2: Loading of Ac-Dap(5-TAMRA)-GRTGRRFSY-amide is temperature dependent.. ... 110
Figure 5.3 Dark transfer of stearoyl-dmnb-Dap(TAMRA)GRTGRRFSY-amide from erythrocyte to HeLa cell membranes ... 111
Figure 5.4: Photolysis of RBCs loaded with cell penetrating peptide in presence of HeLa cells. ... 112
Figure 5.5: Proteolytic stability of 6, and its non-lipidated counterpart.. ... 113
Figure 5.6: Proteolysis of peptide 6 in the presence of chymotrypsin or trypsin as a function of time. ... 114
Figure 5.7: Partial photolysis of peptide 6 in water as assessed by LC-MS. ... 114
Figure 5.8: Comparision of lipid anchoring strategies for MSH peptides. ... 115
Figure 5.10: Time dependent proteolytic stability of peptide 7 anchored to the surface of erythrocytes. ... 117
Figure 5.9: Proteolytic stability of peptides 7 ... 117
xv
Figure 5.12: Binding of MSH peptides to HEK293T cells co-expressing MC1R and
enhanced green fluorescent protein.. ... 119
Figure 5.13: Specificity of MSH peptide for MC1R. ... 120
Figure 5.14: Photolysis of peptide 7 ... 121
Scheme 5.2: Structure of the lipidated PAR agonist analogue 9 ... 122
Figure 5.15: Stability of peptides 9 on erythrocytes and 3b against chymotrypsin and trypsin ... 123
Figure 5.17: Light-mediated platelet aggregation. ... 124
Figure 5.16: Time dependent incubation of peptides 9 (on erythrocytes) and 3b with chymotrypsin and trypsin. ... 124
Figure 5.18: Traces of platelet aggregation from three different blood donors. ... 125
Figure 6.1: A MRI of patient diagnosed with GBM immediately after tumor resection ... 159
Figure 6.2: Outlines an exterior loaded RBC approach to delivery of phototherapeutics. ... 160
Figure 6.4: Transfer of Bodipy from NSCs to HeLa cells upon photolysis (non-lipidated Bodipy-Cbl) ... 164
Figure 6.3: Transfer of Bodipy from NSCs to HeLa cells upon photolysis (lipidated Bodipy-Cbl). ... 164
Figure 6.5: A low magnification image of the experiment described in Figure 6.3. ... 165
xvi
Figure 6.7: OH-Cbl-Cy5 retention over time in NSCs ... 166
Figure 6.9: Investigation of mitochondrial fluorescence in NSC loading. ... 168
Figure 6.8: Fluorescent confocal micrographs of Cbl compounds loaded in NSCs ... 168
Figure 6.10: NSC migration to GBMs after loading with Cbl compounds. ... 169
Figure 6.11: Dose response curves to Cy5-alkynyl-Cbl compounds. ... 171
Figure 6.12: Photolysis of COL-Cbl loaded NSCs ... 172
Figure 6.13: Description of BRET system using Lumifluors ... 175
Figure 6.14: 24 h loading of NSCs with COL-Cbl and luciferase mediated photolysis. ... 176
Figure 6.15: Luciferase mediated photolysis of NSCs loaded with COL-Cbl ... 177
Figure 6.16: Descriptions of the different modes of photon emission for positron (β+) decay. ... 179
Figure 6.17: FDG mediated photolysis of PTX-Cbl ... 180
Figure 6.18: Initial hCMV loading experiments. ... 183
xvii
LIST OF TABLES
Table 1.1: List of bPAC mutations………21
Table 2.1: List of reporter PKA mutant activities………25
Table 2.2: List of measure PKA mutant activities………..25
Table 3.1: List of localization sequences for bPAC………...61
xviii
LIST OF ABBREVIATIONS
8BrcAMP 8-bromo-cAMP
ADCs Antibody-drug conjugate
AKAPs A-kinase anchoring proteins
AKAR A-kinase activity reporter
AMPAR α-amino-3-hydroxy-5-methyl-4-isoxazolepropionic acid receptor
ATP Adenosine triphosphate
BBB Blood brain barrier
BFP Blue fluorescent protein
BLUF Blue light using flavin adenine dinucleotide
Bodipy Boron dipyrromethene
bPAC Beggiatoa photo-activated adenylate cyclase BRET Bioluminescent resonance energy transfer
BSA Bovine serum albumin
C PKA catalytic subunit
cAMP Cyclic adenosine monophosphate
Cbl Cobalamin
CFP Cyan fluorescent protein
CFTR Cystic fibrosis transmembrane conductance regulator
cGMP Cyclic guanosine monophosphate
Cib Cryptochrome-interacting basic-helix-loop-helix 1
CMV Cytomegalovirus
CNGs and HCNs Cyclic nucleotide gated ion channels
COL Colchicine
xix
CPTcAMP 8-chlorophenylthio-cAMP
Cry Cryptochrome
Cry2 Cryptochrome 2
CY Cytoplasm
DCM Dichloromethane
DEX Dexamethasone
DiD 1,1'-dioctadecyl-3,3,3',3'-tetramethylindodicarbocyanine
DMF Dimethylformamide
DMNB Dimethoxynitrobenzyl
DOX Doxorubicin
DTT Dithiothreitol
EDT Ethanedithiol
EIA Enzyme-linked immuno assay
EPACs Exchange proteins directly activated by cAMP euPAC Euglenia gracilis photo-activated adenylate cyclase
FBS Fetal bovine serum
FCCP carbonyl cyanide 4-(trifluoromethoxy)phenylhydrazone FDG 2-[18F]-fluoro-2-deoxy-D-glucose
FRET Förster resonance energy transfer
GBM Glioblastoma multiforme
GEF Guanine exchange factor
GFP Green fluorescent protein
GPCR G-protein coupled receptor
hCMV Human cytomegalovirus
xx
ICUE Indicator of cAMP using EPAC
IP Immunoprecipitation
LA-Cib Lifeact-Cib
LC Liquid chromatography
LOV Light, oxygen, voltage
LTP Long term potentiation
MAP2 Microtubule associated protein 2
MAPK Mitogen activated protein kinase
mC-Cry2 mCherry-Cry2
MCR Melanocortin receptor
MCs Melanocortins
MeOH Methanol
MM Mitochondrial matrix
MRI Magnetic resonance imaging
MS Mass spectrometry
NIH National Institutes of Health
NIR Near infrared
NSC Neural stem cells
Nu Nucleus
OMM Outer mitochondrial membrane
OPKA Optogenetic PKA
OXPHOS Oxidative phosphorylation
PAC Photo-activated adenylate cyclase
PARs Protease-activated receptors
xxi
PDEs Phosphodiesterases
PET Positron emission tomography
PHR Photolyase homology region
PHY Phytochrome
PKA Protein Kinase A
PKAcs Protein Kinase A catalytic subunit
PKC Protein kinase C
PM Plasma membrane
POIs Proteins of interest
PP2B Protein phosphatase 2B
PPIs Protein-protein interactions
PPs Protein phosphatases
PTX-Cbl Paclitaxel-Cbl
R PKA regulatory subunit
RBCs Erythrocytes, red blood cells
sAC Soluble adenylate cyclase
SAR Structure activity relationship
siRNA Small interfering RNA
TFA Trifluoroacetic acid
TIS Triisopropylsilane
tmACs Transmembrane adenylate cyclases
TOM Translocase of the outer membrane
TRAILs Tumor necrosis factor-related apoptosis-inducing ligand
UV Ultraviolet
xxii
WT Wild-type
YFP Yellow fluorescent protein
αMSH α-melanocyte stimulating hormone
1
CHAPTER 1: CAMP, PKA, AND OPTOGENETICS: ILLUMINATING SPATIAL AND
TEMPORAL INTRACELLULAR SIGNALING
Introduction
Plants and animals are highly complex, multicellular organisms that require
extremely precise regulation of both macro and micro-scale processes in order to survive. Multicellular organisms contain systems of different organs, which are composed of highly-specialized tissues. These tissues are composed of many different types of cells, and each group of cells is responsible for carrying out a specific role.
2
The cyclic adenosine monophosphate (cAMP)/protein kinase A (PKA) pathway is involved in many cellular process and is highly compartmentalized and regulated in both space and time. cAMP (a small molecule) is generated by adenylate cyclases that respond to external (global) or internal (local) stimuli and, in turn, activate PKA to phosphorylate specific
substrates and carry out cellular processes ranging from cell survival to energy production. PKA and associated signaling proteins are sequestered to specific subcellular
compartments by A-kinase anchoring proteins (AKAPs) to generate distinct signaling microenvironments. These signaling nodes provide spatial specificity to PKA so that this otherwise ubiquitous signaling pathway is only activated in the right location and at the right time.
There are many tools available today to both control and monitor cAMP/PKA activity in living cells. Pharmacological activators and inhibitors, genetic modification of pathway members, and Förster resonance energy transfer (FRET) based live cell imaging tools are widely used to study cAMP/PKA signaling dynamics and its effect on cellular, systems, and organismal physiology. While FRET sensors allow us to visualize cAMP/PKA activity with high spatial and temporal resolution, the vast majority of studies utilize global
3
of this section of my dissertation is to outline two distinct projects aimed at developing optogenetic tools to control cAMP/PKA at multiple levels of the signaling pathway.
First, I will describe the development of a bacterial photoactivated adenylate cyclase (PAC) into a tool for spatial and temporal control of intracellular cAMP in mammalian cells. This tool will furnish control of the initial second messenger in the pathway, and then I will describe an optogenetic PKA (OPKA) developed to directly control kinase activity at specific subcellular sites. These tools, taken together, represent a toolbox for dissecting specific subcellular pools of cAMP and PKA and may be extended to investigate the roles of these specific signaling molecules in cellular systems.
Section 1.1: cAMP the first second messenger
cAMP was initially discovered by Sutherland and colleagues in 1957 as a soluble, heat resistant active factor that induced hyperglycemia, via glycogenolysis, in liver slices after treatment with epinephrine or glucagon[1] and the structure of cAMP was concurrently
discovered by Cook and colleagues.[2] cAMP is the prototypical “second messenger”, an
intracellular signaling molecule that is classically generated in response to extracellular stimuli. Second messengers act to integrate and amplify the extracellular signal such that cells can generate an appropriate physiological response to the changing environment. Sutherland’s work with cAMP paved the way to define a wide array of second messaging signaling pathways and culminated with him being awarded the Nobel Prize for Physiology and Medicine in 1971.[3] cAMP signaling was quickly recognized to be ubiquitous in
prokaryotic and eukaryotic cells[4] and, as of August 2016 returned over 100,000 papers on
PubMed.
cAMP is highly regulated. It is formed via a cyclization reaction of adenosine triphosphate (ATP) catalyzed by adenylate cyclases (ACs)[5] yielding cAMP and
4
thought to only exist as membrane bound, G protein coupled receptor (GPCR) coupled enzymes[4] (transmembrane adenylate cyclases or tmACs). However, in 1975, AC activity
was identified in the soluble fraction of rat testis[7] and was termed “soluble adenylate
cyclase” (sAC). ACs are encoded by ten different genes with the symbol ADCY1-10. ADCY1 – 9 encode tmACs while ADCY10 encodes the sAC. AC isoforms are differentially expressed in tissues with multiple splice variants. The sAC ADCY10 is, in fact, an
enormous gene comprised of 33 exons under the control of multiple promoters.[8] While
tmACs are localized to the plasma membrane (PM) or sarcoplasmic reticulum[4], in
myocytes, sACs are localized to a variety of subcellular locations including the nucleus and mitochondria.[9] tmACs are activated by G
s proteins[10] and the pharmacological activator
forskolin[11][12], and they are inactivated by G
i proteins.[10] Interestingly, confounding
evidence has been reported in which tmACs are internalized upon receptor desensitization and endocytosis but can either be silenced or have sustained signaling in response to the action of β-arrestin.[13] sACs, on the other hand, are GPCR and forskolin insensitive and are
activated by Ca2+, bicarbonate, and local redox status.[8] Thus tmACs act to integrate and
amplify extracellular signals for global regulation of intracellular cAMP signals while sACs function as local sensors and regulators of cellular microdomains.
cAMP has four primary effectors in mammalian cells: the cAMP dependent protein kinase (PKA), cyclic nucleotide gated ion channels (CNGs and HCNs), the exchange
proteins directly activated by cAMP (EPACs)[14] and recently, the Popeye domain containing
proteins.[15] CNGs are cation channels that bind cyclic nucleotides to increase their open
5
only open at hyperpolarized membrane potentials.[16] CNGs have a higher affinity for cyclic
guanosine monophosphate (cGMP) than cAMP and HCNs preferentially bind cAMP over cGMP.[17] cAMP binding results in an influx of cations that acts to depolarize the plasma
membrane. CNGs primarily function to regulate sensory signal transduction. They are expressed in olfactory neurons and retinal epithelia.[16] HCNs are found in neurons, retinal
epithelial cells, and cardiac pacemaker cells[16] and are important in cardiac pacemaking and
learning and memory.[16] EPACs are two distinct genes, EPAC1 and EPAC2, and are cAMP
regulated guanine exchange factors (GEF).[18] EPAC1 is ubiquitously expressed while
EPAC2 expression is tissue dependent. The cAMP dependent GEF activity functions to activate the small GTPases Rap1 and Rap2. EPACs are involved in a myriad of cellular functions including adhesion[19], secretion[20], differentiation[21], proliferation, apoptosis and
gene expression.[22] Popeye domain containing proteins have only recently been described
as cAMP binding proteins and are an active area of study involved in cell-cell contact formation, vesicular transport, muscle physiology, and are implicated in cardiac arrhythmia and muscular dystrophy.[15] While each of the aforementioned cAMP effectors are important
in cellular physiology, the primary focus of this work is on PKA. For an in depth report on cyclic nucleotide gated ion channels, EPACs, and Popeye domain containing proteins please see reviews by Biel et al.[16], Cheng et al.[22], and Schindler et al.[15] respectively.
Section 1.2: The cAMP dependent protein kinase: a ubiquitous signaling pathway as a model for compartmentalized signaling
PKA was discovered in 1968 by Krebs and colleagues[23] as a cAMP dependent
kinase in rabbit skeletal muscle that activates phosphorylase kinase. Since its discovery, a vast amount of research aimed at characterizing PKA structure and function has emerged and it is now considered to be the “prototypical kinase.”[24] It is important to note that the
6
cells from single celled protists to humans.[26] PKA is implicated in a myriad of diseases
including cardiac disease, cancer, neurodegenerative disorders, and metabolic disease.[27]
While much is known about PKA signaling in terms of disease and enzymology, this review will focus on PKA signaling as a compartmentalized process.
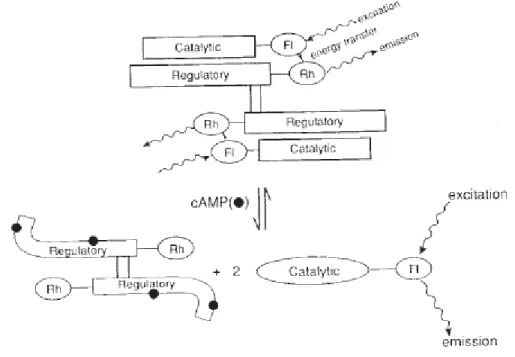
PKA is a serine/threonine kinase of the AGC kinase family and exists in its resting state as an inactive tetrameric holoenzyme composed of two regulatory subunits (R) and two catalytic subunits (C), which, upon binding of cAMP to the R subunits results in release of the C subunit such that it catalyzes the transfer of the γ-phosphate of ATP to a protein substrate (Figure 1.2). There are seven total PKA genes (RIα, RIβ, RIIα, RIIβ, Cα, Cβ, and Cγ) in humans that undergo alternative splicing yielding a number of possible isozymes highly dependent on tissue specific expression patterns.[28] PKA isoforms are primarily
described by the R subunit composition due to the fact that C subunits are largely
interchangeable and were thought to be mostly redundant. However, recent structural studies are revealing that the various R2C2 holoenzyme isoforms do not share symmetry and
thus are not structurally redundant illustrating yet another level of allosteric regulation of the PKA family of enzymes (see below).[29]
7
Initially, RI and RII isozymes were defined by the elution conditions for purification. RII was found to be primarily associated with the particulate fraction in heart
homogenates[30] and RI was primarily soluble.[31] Differences in affinity for ATP and cAMP
have also been reported with RI type holozymes containing a high affinity and essential Mg-ATP binding site[32] and RI being more sensitive to cAMP than RII.[33] The R subunits
dimerize through an N-terminal helix bundle and bind the C subunit via inhibitor sites found in a flexible linker that separates the dimerization domain from the cAMP binding domains at the C-terminus of the R subunits.[29] C subunit binding sites on R subunits resemble peptide
substrates and bind the active site of the C subunit thus sequestering and inactivating the C subunit. Inhibitory sites differ between RI and RII isoforms in that the RI subunit contains a pseudo substrate inhibitory C subunit binding site where the phospho-site is Ala or Gly and the RII subunit contains a Ser in that position which can be phosphorylated by the C subunit.[29] The C subunit is cotranslationally phosphorylated at Ser 338 and
posttranslationally at Thr 197. Both of these phosphorylation events are required for C subunit activity and stability.[34] In addition, the C subunit contains a myristylation site that
appears to function as a positive allosteric regulator of catalytic activity.[35]
PKA is ubiquitously expressed in all cells and is necessary for organismal survival.[28]
Early studies of PKA in animal hearts revealed differential distribution of RI and RII isozymes
(see above)[31] and work from the Mayer lab in 1979 showed that elevation of cAMP in
8
perfused hearts by either the β-adrenergic agonist isoproterenol or prostaglandin E1 resulted
in differential phosphorylation of PKA substrates.[36] Isoproterenol and prostaglandin E 1 both
act via Gs coupled GPCRs but bind to different receptors. These studies brought forth the
concept of PKA compartmentalized signaling. The discovery that a portion of intracellular RII associated with the microtubule associated protein 2 (MAP2) in 1981[37] and subsequent
characterization of the MAP2-RII complex in 1982[38] opened an entirely new field of
compartmentalized PKA signaling by subcellular localization through AKAPs.
There have been over 50 AKAPs identified in eukaryotes[39] and they represent a
diverse set of scaffolding proteins that bind PKA. AKAPs interact with the R subunit’s dimerization/docking domain[40] via a 14 – 18 residue binding domain to sequester pools of
PKA to subcellular compartments in close proximity to specific pools of substrates.[41] While
AKAPs primarily bind RII isoforms of PKA, there are a number of bispecific AKAPs that bind RI and RII.[40] Other signaling and regulatory proteins associate with AKAPs such as ACs[42],
PDEs[43], protein phosphatases (PPs)[44], GTPases[45], kinases, receptors[44b], ion
channels[46], the cytoskeleton[38, 47], and even RNA(Figure 1.4).[47] By sequestering
regulatory elements of cAMP/PKA signaling, AKAP complexes function as signaling nodes that can react to local or global changes in cAMP and regulate local changes in effector activity.[48] AKAPs are thought to be the primary mechanism for compartmentation of
cAMP/PKA signaling. For example, Kapiloff’s group has demonstrated that mAKAP binds PKA, PDE4D3, Epac, Rap1, and several members of the mitogen activated kinase (MAPK) pathway.[48] Upon constitutive elevation of cAMP levels, MAPK phosphorylates PDE4D3
9
result in Epac activation, Rap1 activation, and Rap1 mediated suppression of MAPK activity
as well as PKA activation which then phosphorylates and activates PDE4D3. The result is a decrease in local cAMP concentrations, which deactivates Epac1 and releases Rap1
mediated repression of MAPK signaling resulting in cardiac hypertrophy.[48]
Another example of compartmentalized signaling through AKAPs is exemplified by PKA anchoring of AKAP79/150 to the post-synaptic density (Figure 1.4). Here, AC V/VI, PKA, protein kinase C (PKC), and protein phosphatase 2B (PP2B, calcineurin) are recruited to the AKAP which associates with β-adrenergic receptors (β-ARs) and the α-amino-3-hydroxy-5-methyl-4-isoxazolepropionic acid receptor (AMPAR), an inward rectifying glutamatergic cation channel.[41] Localized cAMP dependent signaling events act to
increase the amount of AMPARs in the post-synaptic density membrane and may play a
10
role in long term potentiation (strengthening of synapses associated with learning and memory).[49] Evidence for a role of AKAP79/150 and PKA regulation of proper synaptic
function is supported by another study that showed that AKAP150 (mouse homolog) deletion resulted in strength and coordination deficits indicating an important role for the complex in the cerebellum.[50]
The preceding examples are intended to highlight the complex, multidimensional regulation of PKA signaling that occurs at discrete signaling nodes inside of cells. The vast majority of studies use biochemical and genetic approaches to monitor changes in cellular physiology. However, these studies usually use global activators of cAMP signaling such as forskolin or the cell permeable cAMP analogs bromo-cAMP (8BrcAMP) and
8-chlorophenylthio-cAMP (CPTcAMP). Genetic and biochemical experiments lack temporal resolution essentially capturing a snap-shot of cellular signaling in time and space.
Therefore, it is important that the research community develop new tools to investigate PKA signaling with a high degree of spatial and temporal resolution. The section that follows outlines the current state of the art in tools for spatial and temporal studies of cAMP/PKA signaling.
Section 1.3: Tools for imaging and controlling cAMP/PKA signaling
11
fluorescein is excited (Figure 1.5).[51] This imaging tool served as a bi-functional sensor for
cAMP and PKA dynamics. First, as stated above, cAMP binding to the R subunit decreased intermolecular FRET signifying cAMP binding and C subunit dissociation. Then, they
observed the translocation of free C subunit from the cytoplasm to the nucleus indicating an important role for PKA signaling in the nucleus.
While this tool revolutionized the field by providing the first live cell cAMP/PKA
sensor and allowed investigators to begin investigating cAMP/PKA compartmentalization, it required microinjection, a technically challenging technique, and was therefore, replaced by genetically encoded imaging tools over the next ten years.
The first genetically encoded cAMP/PKA sensor was reported in 2000 by Tsien, Taylor, and Pozzan.[52] The sensor was, essentially, a genetically encoded version of Tsien
and Taylor’s chemically modified sensor outlined above and was, undoubtedly, a product of the rapidly expanding field of molecular and synthetic biology. The sensor is a green fluorescent protein (GFP) C subunit and a blue fluorescent protein (BFP) R subunit fusion.
12
In the absence of cAMP, BFP undergoes intermolecular FRET with GFP. Upon increased intracellular cAMP, the C and R subunit dissociate and FRET is lost.[52] The following year,
Taylor, Tsien and Zhang published the first report of a PKA activity reporter, the A kinase activity reporter (AKAR) which consisted of a cyan fluorescent protein (CFP) and yellow fluorescent protein (YFP) tethered together by a PKA substrate peptide and the
phosphoserine binding domain 14-3-3. Upon phosphorylation of the PKA substrate peptide, 14-3-3 binds phosphoserine resulting in a large conformational change in the protein,
resulting in a spatially reoriented CFP and YFP and thereby generating a FRET emission.[53]
Jin Zhang quickly followed up her report of the first generation of AKARs with a unimolecular cAMP sensor termed the “indicator of cAMP using Epac” (ICUE) which takes advantage of the cAMP induced conformational changes in Epac1 such that CFP and YFP fused to opposite ends of Epac1 undergoes a loss of FRET upon cAMP binding.[54] Unimolecular
FRET sensors provide multiple benefits relative to bi-molecular sensors including ease of expression and an increased dynamic range and have become the primary method used to quantify cellular and subcellular cAMP/PKA activity.[55] CNGs have also been used as
electrophysiological and Ca2+ dye coupled sensors of cAMP dynamics at membranes and
have even been engineered into FRET sensors.[55] Figure 1.6 shows schematic diagrams of
13
These tools, especially the ICUE and AKAR sensors, have been widely used to characterize cellular and subcellular cAMP/PKA activity and have been instrumental in decoding compartmentalized and temporal signaling. However, they only allow for investigators to monitor activity evoked from some stimulus and do not allow for investigation of the activation of specific pools of PKA.
14
mutated PKA’s ATP binding site by replacing Met 120 with Ala such that it would be specifically inhibited by the compound 1-NM-PP1. They generated transgenic animals silencing endogenous C subunit and expressing the mutant C subunit such that it would only be sensitive to 1-NM-PP1. Using this approach, the group investigated the temporal effects of PKA inhibition in sperm motility.[56] Zhang took a different chemical genetics approach to
control cAMP generation in space and time by generating a truncated version of the sAC that is solely regulated by bicarbonate. Therefore, adding bicarbonate to the media of cells expressing sAC resulted in intracellular increases in cAMP. Through this work, Zhang and colleagues made a controversial argument for the presence of PKA holoenzyme in the nucleus based on activity changes versus diffusion rates across the nuclear membrane.[57]
Interestingly, the majority of other tools that have been developed to control cAMP/PKA signaling in a spatial and temporal manner are all controlled by light. Light presents itself as an ideal switch for spatial and temporal control of processes. Light is instantaneous in its action and it can be delivered with extreme precision in the form of fiber optics and lasers. In addition, exposing cells to light does not require media exchange, which removes potential interference in sensitive assays such as focal plane, pH, or mechanical force. cAMP that has been inactivated by the photo-caging group
dimethoxynitrobenzyl (DMNB) has been used in a number of studies to investigate the roles of cAMP in neuronal differentiation[58], ion channel electrophysiology[59], insulin secretion[60]
and other cellular processes. Our group used the nitrobenzyl group to generate a caged C subunit by covalently modifying a Cys residue near the active site with a maleimide linked to a fluorophore. In addition, the photolabile nitrobenzyl moiety had a fluorescent quencher and PKA inhibitory peptide in the leaving group position. Therefore, upon photolysis of the nitrobenzyl group with UV light, the peptide inhibitor and fluorescent quencher were
15
innovation and temporal control of PKA activity, spatial control was limited and the caged enzyme needed to be microinjected into cells.
In 2002, a PAC was reported to regulate light directed motion in the algae Euglena
gracilis.[62] This enzyme (euPAC) was quickly adapted as a tool and has been used to probe
neuronal activity[63] and even to stimulate axonal regeneration in zebrafish.[64] However, it is
plagued by large size and significant dark activity and has, therefore, not been widely
adopted by the cAMP community. Another PAC from the bacterium Beggiatoa spp. (bPAC) was reported by two separate groups in 2011[65] and has since been used to investigate
cAMP/PKA signaling in a number of systems and will be detailed in the following section. To my knowledge, there is only a single genetically encoded, light activated PKA modulator that has been reported as of this date. The Hahn group constructed a light activated PKA inhibitor (PKI) peptide linked to a light, oxygen, voltage (LOV) domain to inhibit PKA activity in a spatial and temporal manner.[66]
Section 1.4: Optogenetics: a route to spatial and temporal control of kinase signaling Optogenetics is a young, rapidly growing field that utilizes and develops light (opto) controlled proteins (genetics) for spatial and temporal control of cellular signaling. The roots of the field can be traced back decades to the discovery of microbial opsins and rhodopsins, a group of retinal binding transmembrane proton and chloride pumps or cation channels that are activated by light to control ion flow across cellular membranes.[67] An obvious use for
light activated ion channels is as tools to specifically activate neurons, and, in 2005, the Deisseroth group overcame a number of technological challenges to develop engineered channelrhodopsins[68] that would become generally useful tools in neurobiology. As of
September 1st 2016, there are 447 results on PubMed for “optogenetics review” indicating
the wide adoption of this technology in little more than ten years.
16
bacteria and nearly all eukaryotes. While the initial optogenetics work was exclusively dedicated to light regulated ion channels, a number of other light sensing proteins have become highly attractive targets for optogenetic development. These natural
photoreceptors fall into two broad categories of blue light and red / near infrared (NIR) light sensing domains that use flavin and bilirubin derived chromophores, respectively.[69] The
blue light receptors are comprised of the light, oxygen, voltage (LOV), blue light using flavin adenine dinucleotide (BLUF), and cryptochrome (Cry) photosensory domains while the red light receptors are all derived from the phytochrome photosensory (PHY) domain. Figure 1.7 outlines the chromophore structures and spectral regions in which these photosensors absorb and are activated by light.
17
BLUF, Cry, and PHY domains all primarily function as light driven homo or
heterodimerizing domains and the LOV domain undergoes a large conformational change upon excitation with light.[70] The advent of genome scale sequencing and bioinformatics
has revealed a rich collection of prokaryotic and eukaryotic photosensory domains fused to biological effectors including transcription factors, kinases, phosphodiesterases, and nucleotide cyclases.[70-71] In addition to natural photo-regulated proteins, light sensing
domains have been used to engineer many different optogenetic tools for spatial and
temporal control of cellular signaling such as GTPases[72], phosphodiesterases[73], nucleotide
cyclases[65, 74], kinases[66], cytoskeletal proteins[75], GPCRs[76], nuclear translocation[77] and
apoptosis.[78] There are two primary modes of developing cellular optogenetic tools: 1)
photo-induced dimerization for control of protein-protein interactions (PPIs) and 2) light-driven enzyme activation.
Photo-induced dimerization is the most widely used approach to engineering cellular optogenetic tools. Indeed, photodimerization is a principle mechanism of action for many natural photoreceptors and the vast majority of enzymes that are activated by blue light require dimerization for activation.[73-74, 79] For the remainder of this section, I will focus on
the photodimerizing pair cryptochrome (Cry) – cryptochrome-interacting basic-helix-loop-helix 1 (Cib) and the light activated adenylate cyclase bPAC.
The Cry-Cib photodimerization was developed as a tool for rapid and reversible induction of protein interactions in living systems.[80] Cryptochrome 2 (Cry2), from
Arabidopsis thalania, contains an N-terminal photolyase homology region (PHR), which is a
flavin and pterin binding domain that is responsible for light-responsive activity.[81] Tucker
and colleagues found that the PHR domain alone is necessary and sufficient for light induced interactions with Cib.[80] Cib is a natural binding partner for Cry2. However, wild
type (WT) Cib is a nuclear protein[81] and was, therefore, truncated to remove its N-terminal
18
mCherry-Cry2 (mC-Cry2) and GFP-Cib-CAAX (plasma membrane targeted) constructs were generated in order to visualize subcellular translocation in response to light. With the
addition of various effector domains, Cry2-Cib has been used for a variety of cellular applications including gene transcription[80], kinase activation[82], cytoskeletal
reorganization[75a], and apoptosis.[78]
Our group has taken advantage of the Cry2-Cib photodimerizing system to develop a generalizable method for engineering light activated proteins of interest (POIs). The
approach takes advantage of the Michealis-Menten equation:𝑣0=
𝑘𝑐𝑎𝑡[𝐸][𝑆]
𝐾𝑚+[𝑆] . The rate of
catalysis is dependent on the intrinsic kcatof the enzyme and its Kmfor substrate as well as the concentrations of both the enzyme [E] and substrate [S].[83] Therefore, an enzyme with
reduced activity via impaired turnover or substrate binding could be restored to WT
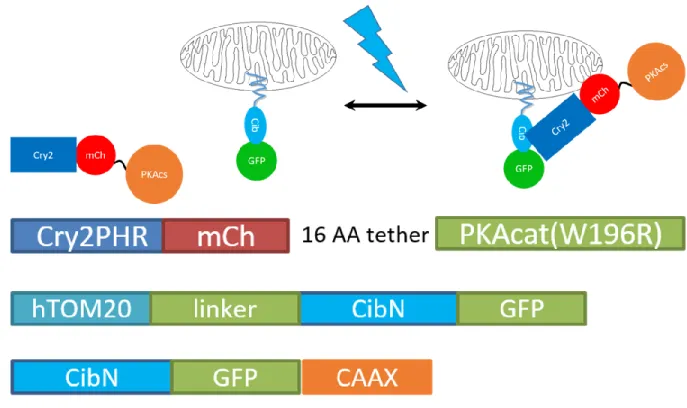
enzymatic activity by locally concentrating the protein near a substrate. We essentially need to make an inefficient catalyst and increase its local concentration to restore apparent activity. We have developed a generalized approach to developing both catalytic and non-catalytic optogenetic proteins. First, we mutate the POI so that it is constitutively active and then we add additional mutations to reduce the inherent activity of the POI. Then, we make a fusion of the POI to Cry2PHR and localize Cib to our subcellular compartment of interest. Upon transfection into cells, we are left with a POI that is inactive when diffuse in the
cytosol, and, upon irradiation with blue light, translocates to the subcellular compartment in which Cib is expressed and the increase in local concentration restores activity of the POI. We have published two examples using this approach to this date. The initial study reported a light-activated cofilin[75a], one of the primary regulators of actin dynamics, and the second
reported light-activated Bax for control of apoptosis.[78]
19
negatively regulated via phosphorylation at Ser 3 and actin severing is regulated by a number of residues including Asp 94, Ser 120, and Lys 96. We found that the combination of Ser 3 Ala and Ser 120 Ala mutations are sufficient to produce a reduced,
constitutively active cofilin. Upon fusion to Cry2 and recruitment to either the actin cytoskeleton via a lifeact-Cib (LA-Cib) or plasma membrane (PM) via Cib-CAAX, we observed cytoskeletal reorganization and light directed lamellipodia formation and motion, respectively.[75a]
Our optogenetic Bax was developed with the same general approach. However, Bax functions by oligomerizing at the outer mitochondrial membrane (OMM) and is not catalytic. Therefore, the focus was on disrupting inherent OMM association and oligomerization. Mutational studies on Bax fused to the C-terminus of mC-Cry2 revealed that a single mutation (Ser 148 Glu) was sufficient to eliminate mitochondrial localization and Bax oligomerization in the dark. However, when illuminated over a two h period, mC-Cry2-BaxS148E was rapidly recruited to the OMM and cells underwent apoptosis.[78]
In the work presented here, I report the extension of our generalized approach to engineering optogenetic proteins to kinases by developing a light-activated PKA C subunit which will be discussed in Chapter 2.
Light activated adenylate cyclases have received attention for their potential uses in dissecting spatial and temporal cAMP signaling. A number of BLUF regulated PACs and a single LOV regulated PAC have been reported from a number of prokaryotic and eukaryotic organisms.[63, 65, 84] Each PAC has unique biochemical characteristics and are generally
evaluated on their light:dark activity ratio. The ideal PAC would be completely inactive in the dark, but there is varying dark activity in each PAC. bPAC, from the sulfur oxidizing
20
in 2007). Since its publication, bPAC has been used to probe the function of a number of cellular and tissue specific processes including GPCR signaling[85], renal function[86], sperm
function[87], parasite-host interactions[88], and axonal regeneration.[89]
bPAC is a 350 amino acid protein with an N-terminal BLUF domain and C-terminal type III AC domain. Upon irradiation with blue light (λmax/dark = 441 nm) bPAC rapidly
generates large amounts of cAMP and reverts to its off state with a half-life of 12.3 s. In addition, bPAC is very sensitive to light with a KMfor light of 4 µW mm-2[65a] (Figure
1.8).Mutational analysis of bPAC has also revealed a number of amino acid substitutions that result in changes in enzymatic activity and is reported in Table 1.
22
Given the fact that bPAC has a high ratio of light:dark activity, is small, expresses well in mammalian cells, and is well characterized, we decided to engineer bPAC into a tool for spatial and temporal control of subcellular pools of cAMP. I will describe our efforts along these lines to date in Chapter 3.
The first section of my dissertation is aimed at describing my efforts to engineer an optogenetic PKA C subunit by taking advantage of our generalized approach to develop optogenetic POIs using Cry2-Cib and develop bPAC into a useful tool for studying
23
CHAPTER 2: DEVELOPING AN OPTOGENETIC PKA CATALYTIC SUBUNIT
1Introduction
Biochemical optogenetics is an emerging field in which proteins of interest are fused with naturally occurring bacterial, algae, and plant photoreceptors.[90] The constructs are
engineered such that they are inactive in the dark, and active in the light via changes in localization or direct enzymatic activation.[91] This method has been used to generate tools
to control gene expression, cytoskeletal dynamics[75a], kinase activity[92], and GTPase
activity.[93] However, the vast majority of biochemical optogenetic tools that have been
generated are highly specific to the protein of interest (POI). Our group has developed optogenetic tools to control actin dynamics (via cofilin)[75a] and apoptosis[78] (via Bax) using
an approach that takes advantage of key mutations to provide a POI fused to the PHR domain of cryptochrome 2 (Cry2) coexpressed with its photodimerizing partner Cib. The mutations in the POI are designed to render it inactive when it is diffuse in the cytosol, and restore activity upon sequestration to subcellular compartments and thus increasing the local concentration of the POI.
Cellular signaling is highly compartmentalized in time and space. Individual cells must be able to respond to, and integrate, extracellular signals while concurrently regulating subcellular and organellar microenvironments in response to local cues. Therefore, cells have evolved highly regulated signaling pathways to control and modulate cellular
homeostasis. PKA is an exemplary model for compartmentalized cellular signaling. It is involved in many cellular processes and is activated by a single second messenger, cAMP.
24
Depending on when, and where, in a cell cAMP is generated, different cellular behaviors occur.[94] How is it, that a single second messenger and effector can illicit many different
phenotypes? PKA is sequestered to various subcellular locations by AKAPs that function as localized scaffolds for a number of signaling molecules including ACs, PKA, PPs, and PDEs, thus creating localized signaling nodes such that PKA can be regulated both by global cAMP signals and also changes in the local cellular microenvironment such as pH and calcium levels.[94a] For example, PKA regulates mitochondrial dynamics and metabolism at
the outer mitochondrial membrane (OMM)[95], but functions to control migration and
membrane dynamics at the plasma membrane (PM).[96]
There are many methods that allow us to observe what is occurring inside of cells in response to global stimulation, but there are relatively few that allow for control of
intracellular biochemistry at specific subcellular locations and with high temporal resolution. Therefore, we set out to make an optogenetic PKA catalytic subunit (OPKA). We have previously reported a strategy to develop optogenetic proteins of interest using the cryptochrome (Cry2) – Cib photodimerizing pair. In order to generate constructs that are inactive in the dark and active in light, we made mutations that decrease activity in regions of the protein important in regulation of activity. We have successfully engineered tools to control protein-protein interactions that resulted in light dependent control of actin dynamics and apoptosis via an optogenetic cofilin and Bax, respectively. Therefore, we hypothesized that we could extend this strategy to PKA, and potentially other enzymes, by inserting mutations that would decrease the KM for the PKA substrate kemptide (LRRASLG, Table
2.1).[97] Thus, the mutations would result in an enzyme that, when diffuse in the cytosol,
25
Table 2.1
PKA
Mutant KM kemptide (µM) Kcat (s
-1) K
cat/KM KM ATP (µM)
WT 11 20 1.8 20
E203A 292 20 0.068 26
F327A 696 26 0.037 249
Y204A 341 0.9 0.002 22
Results and Discussion
Section 2.1: In vitro validation of C subunit mutant activity
The PKA catalytic subunit (PKAcs) was cloned into the pMCSG11 bacterial expression vector as a 6X His-tag fusion via PCR and ligation independent cloning. We then generated a cAMP independent mutant of PKAcs via a W196R mutation (Table 2.2, Figure 2.2). Next, we aimed to reduce PKAcs activity by generating constructs that
contained one of three different mutations from the literature[97] that were known to decrease
PKAcs KM for the substrate kemptide (Table 2.1: E203A, Y204A, and F327A). These PKAcs
variants were expressed in E. coli and purified via affinity chromatography. Activity of the different PKAcs mutants was quantified by coupled assay and resulted in activities of 7.4 ± 1.0, 0.95 ± 0.2, and 0.21 ± 0.02 s-1 for E203A, Y204A, and F327A respectively (W196R
PKAcs activity: 17.0 ± 2.8 s-1).
Table 2.2
Enzyme Activity (s-1) % Activity
WT PKA 17.0 ± 2.8 100 ± 16
F327A PKA 0.28 ± 0.02 1.6 ± 0.1
F327A + H87Q PKA 0.18 ± 0.02 1.1 ± 0.1
F327A + W196R PKA 0.21 ± 0.02 1.2 ± 0.1
F327A + H87Q + W196R PKA 0.01 ± 0.001 0.07 ± 0.01
E203A + W196R PKA 7.4 ± 1.0 43 ± 6.0
26
Figure 2.2: In vitro data showing cAMP independent C subunit activity. All experiments run in triplicate expressed as mean +/- standard deviation. Experiments performed by Dr. Melanie Priestman.
27
Section 2.2: Generation of OPKA constructs and assessment of subcellular recruitment
In order to assess the activity of our PKAcs variants in cells, we cloned each mutant as both C-terminal and N-terminal fusions to Cry2-mCherry under the CMV promoter in the pmCherry N1 vector (Addgene). The PKAcs was linked to Cry2-mCherry via a 16 amino acid flexible linker (see methods and materials). First, we quantified the light driven association and dissociation dynamics of the Cry2-mCherry-PKA fusions (referred to as OPKA) in MVD7 cells (a gift from Dr. James E. Bear)[98] via live-cell fluorescent microscopy
(Figure 2.3). We co-expressed the OPKA constructs with either an OMM, PM, or actin-targeted Cib [75a, 78] in MVD7 cells and imaged mCherry fluorescence every 30 s over 15 min
28
Figure 2.3: Top: Graphs representing association and dissociation of OPKA constructs with the OMM (left), cytoskeleton (middle), and PM (right). Note that OPKAWT and OPKAE203A
29
Section 2.3: Development and characterization of a PKA reporter
We then sought to determine the activity of our OPKA variants in dark and light in live cells. However, current live cell PKA activity imaging tools such as the AKARs are spectrally incompatible with blue light sensing photoreceptors as they are constructed using CFP/YFP or GFP/RFP FRET pairs[54, 99] and Cry2 maximally absorbs light between 400 –
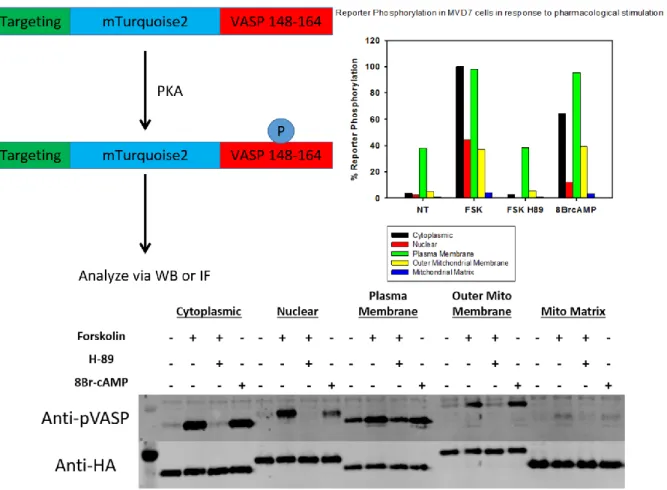
500 nm which overlaps with the excitation spectrum of CFP and GFP (Figure 2.4). In addition, we were unable to analyze PKA dependent phosphorylation of endogenous substrates at subcellular locations due to the fact that there is a distinct lack of antibodies against phosphorylated forms of localized substrates. Therefore, we generated a fixed time point reporter to analyze subcellular PKA activity. The reporter is composed of an
N-terminal subcellular targeting sequence fused to a core fluorescent protein (mTurquoise2) via a HA-tag linker and fused to a C-terminal PKA substrate peptide composed of amino acids 148 – 164 of the protein VASP (Figure 2.5). VASP is a well characterized PKA substrate[100] that is phosphorylated at Ser157 and has highly specific antibodies against the
phosphorylated form that are commercially available. The Tom20[101], Cox VIII[102] and
Lyn[99a] kinase N-terminal targeting domains were used for targeting the reporter to the
OMM, mitochondrial matrix (MM) or PM respectively. we also generated non-targeted, and nuclear (Nu) (via the addition of a C-terminal SV40 nuclear localization sequence[103])
targeted reporters. MVD7 cells are a triple knockout cell line for all VASP family member proteins (Ena, Mena, and VASP)[98] and were therefore, useful for quantifying PKA
30
Western blot for its ability to be phosphorylated in a PKA specific manner (Figure 2.5, 2.6). Therefore, we moved forward, using the reporter to quantify subcellular PKA activity.
Section 2.4: Determining the relative activities of OPKA constructs
In order to determine the relative activities of our different constructs the OPKA variants were coexpressed in MVD7 cells with OMM reporter and OMM-Cib. The cells were then stimulated with 470 nm light for 1 min in the presence or absence of the PKA inhibitor H89 and subsequently analyzed by semi-quantitative immunofluorescence (Figure 2.7). WT and E203A OPKA phosphorylated the reporter to the same extent in both light and dark. However, Y204A and F327A OPKA showed light dependent increases in reporter
phosphorylation with Y204A OPKA activation resulting in greater reporter phosphorylation Figure 2.4: Left: schematic representation of ICUE and AKAR real-time cAMP and PKA sensors respectively. Reprinted with permission from publisher [98b]. Right: overlay of flavin
31
than F327A OPKA. H89 treatment followed by light stimulation resulted in inhibition of reporter indicating a PKA specific phosphorylation event.
Section 2.5: OPKA activity is spatially selective
Since PKA is highly regulated in time and space, we wanted to validate that our OPKA tool was capable of phosphorylating substrates at specific subcellular locations in a time and dose dependent manner while leaving other cellular locations untouched by enzymatic activity. Therefore, we performed “lightration” experiments in MVD7 cells with OPKAY204A and OPKAF327A recruited to the PM or OMM. We coexpressed our OPKA
32
stimulated the cells with 470 nm LED light from 0 – 300 s before fixing and analyzing reporter phosphorylation via immunofluorescence. As expected from our initial 1 min reporter experiments, Y204A OPKA activation yielded faster phosphorylation of the reporter at both the OMM and PM than OPKAF327A (Figure 2.8). After 300 s, both OPKA constructs
had phosphorylated the reporters to the same extent. In order to show spatial selectivity of OPKA, we coexpressed OPKAY204A or OPKAF327A with PM, OMM, or actin targeted Cib and
varied the location of the reporter between the OMM and PM and performed a lightration from 0 – 300 s with 470 nm LED light. We observed a time and location dependent increase in reporter phosphorylation such that, only the reporter that was localized to the same
33
34
Figure 2.7: Top: representative images of light dependent PKA phosphorylation of the OMM-reporter by OPKAY204A. Bottom: relative phosphorylation of OMM-reporter in
35
Figure 2.8: OPKAy204A and OPKAF327A both phosphorylate the reporter when it is recruited
only to the same subcellular compartment as the reporter. The magnitude of reporter phosphorylation by OPKAy204A is greater than that of OPKAF327A. Data is presented as
36
Section 2.6: Light-induced spatially specific phosphorylation of endogenous PKA substrates with OPKAY204A
Finally, we set out to validate that OPKA was capable of phosphorylating
endogenous PKA substrates at specific subcellular regions. Given that there is a lack of phospho-specific antibodies for discreet subcellular PKA substrates, we turned to proteomic analysis to quantify PKA activity at the OMM and PM. 293T I17 cells were transfected with Y204A OPKA and either OMM or PM-Cib and stimulated with light. For the PM-Cib
experiment, whole cell lysates were used, and for the OMM-Cib experiment, we performed subcellular fractionation to isolate mitochondria. We then probed for differences in overall PKA phosphorylation between the light and dark via Western blot using an antibody that detects phospho-PKA substrates (Cell signaling technologies). In both cases, we found that there were increases in specific bands that were associated with the respective subcellular compartment (Figure 2.9, 2.14).
The PM-Cib experiment, initially performed with OPKAF327A, revealed an unknown
phospho-protein of interest upon performing Western blot analysis with the phospho-PKA substrate antibody (Figure 2.9). To identify the unknown phospho-protein, lysates were run
37
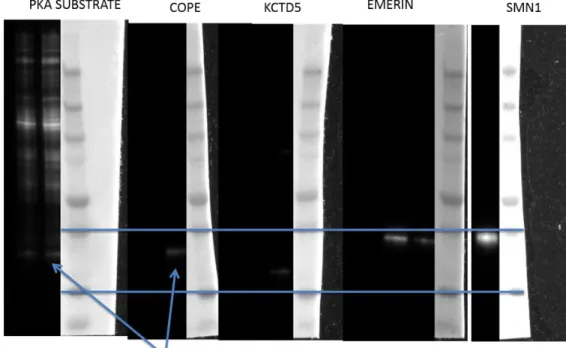
on an SDS-PAGE gel and the 25 – 37 kDa region was cut for tryptic digest and phospho-proteome analysis via liquid chromatography (LC) and tandem mass spectrometry (MS) (Figure 2.10). MS analysis revealed a number of enriched phospho-proteins present in the region of interest (top hits listed in Figure 2.10). Antibodies against COPE, KCTD5,
EMERIN, and SMN1 were purchased in order to perform immunoprecipitations (IP) in order to identify the phospho-protein of interest identified in the initial experiment. IP for each of the antibodies revealed that COPE (coatomer protein epsilon) had the same electrophoretic mobility shift as the unknown phospho-protein of interest and was phosphorylated in
response to light activation of OPKA (Figure 2.11). COPE is a protein involved in protein trafficking associated with cellular membranes including the PM and has been shown to interact with the cystic fibrosis transmembrane conductance regulator (CFTR).[104] COPE is
phosphorylated at Ser 99, which lies inside of a classic PKA consensus site (RRDSI).[105]
We performed a time course light experiment in order to optimize detection of
phospho-COPE for further validation by MS. HEK 293T cells were transfected with OPKAY204A,
OPKAF327A, or Cry2-mC and exposed to blue light for 0, 1, 2, 4, or 8 min before lysis and
Western blot analysis with the phospho-PKA substrate antibody. Indeed, there was an increase in the phospho-PKA substrate band associated with COPE in cells expressing
Figure 2.10: 25 – 37 kDa regions from whole cell lysates were cut for tryptic digest. The bottom panel shows the gel and regions excised. From left to right: no treatment, forskolin, OPKA dark, OPKA light. The top panel is a list of the most highly enriched phospho-proteins identified in the original proteomics experiment. Experiments performed by Dr. Robert Hughes.
38
OPKAy204A and cells treated with forskolin (Figure 2.12). It is interesting to note that
OPKAF327A appears to have high basal levels of COPE phosphorylation, but is normally less
active than OPKAY204A. It is also interesting to note that forskolin treatment does not appear
39
to induce COPE phosphorylation until 8 min, while the maximal response from OPKAY204A
occurred after 1 min and then gradually decayed over time.
Given that the largest light-dependent change in COPE phosphorylation appeared after only 1 min of light exposure, we submitted the 1 min time point to the UNC Proteomics Core for further validation by MS. We are currently awaiting results.
For the mitochondrial experiment, HEK 293T cells were grown on galactose for at least 24 hs prior to an experiment in order to decrease mitochondrial associated PKA signaling. In yeast, PKA plays a central role in metabolic signaling. When yeast cells are grown on glucose, high levels of PKA activity are present and almost all of the cellular ATP content is generated by glycolysis. However, when yeast are grown on non-fermentable media, the PKA activity decreases, especially that which is associated with mitochondria, and ATP is generated by oxidative phosphorylation (OXPHOS).[106] There is considerable
evidence in the literature that PKA plays a central role in metabolic switching at the OMM[107]
in mammalian cells. However, to my knowledge, substrate mediated changes in PKA activity at mitochondria have not been investigated in higher eukaryotes. Therefore, we reasoned that HEK 293T cells that were glucose starved, and therefore preferentially metabolizing ATP via OXPHOS, should have lower basal PKA activity and, thus, any
40
increase in PKA phosphorylation at the OMM would be enhanced. Indeed, cells grown on galactose and subsequently treated with forskolin had a greater increase in PKA activity in mitochondria than those maintained in glucose when mitochondrial fractions were probed via Western blot with the phospho-PKA substrate antibody (Figure 2.13). Therefore, we cultured HEK 293T cells on galactose containing media and subsequently transfected them with OPKAY204A and OMM-Cib. Untransfected cells were treated with forskolin (10 µM for 30
min) and OPKA transfected cells were treated with light (470 nm blue LED flood lamp for 30 min). Following treatment, we lysed the cells and isolated the mitochondrial fraction via differential centrifugation and a kit (Pierce) in the presence of phosphatase inhibitors. We then probed the mitochondrial and whole cell lysates for changes in phospho-PKA
substrates via Western blot (Figure 2.14). We observed a marked increase in mitochondrial fractions expressing OPKA and treated with light (Figure 2.14). These samples were then submitted to the UNC Proteomics Core for mitochondrial phosphoproteome analysis. We are currently awaiting results.