DESIGN, IMPROVEMENT, AND BENCHMARKING OF A LIGHT-INDUCED HETERODIMER PAIR: THE AWAKENING OF iLID
Ryan Alexander Ellis Hallett
A dissertation submitted to the faculty of the University of North Carolina at Chapel Hill in partial fulfillment of the requirements for the degree of Doctor of Philosophy in the Department of
Biochemistry and Biophysics.
Chapel Hill 2015
Approved by:
Brian Kuhlman
Henrik Dohlman
Klaus Hahn
Kevin Slep
© 2015
ABSTRACT
Ryan Alexander Ellis Hallett: Design, Improvement, and Benchmarking of a Light-Induced Heterodimer: The Awakening of iLID
(Under the direction of Brian Kuhlman)
Cellular optogenetic tools are engineered protein photoreceptors that allow
researchers to probe intricate protein-protein interaction networks with the flip of a light
switch. These tools can be turned on with high spatial and temporal resolution to change the
activity or localization of a protein inside a cell. In order for a tool to be widely useful it
should be generalizable for multiple applications, orthogonal to the system it is used in, and
have low levels of activity in the inactive state. Light-inducible heterodimerization is one of
the most general optogenetic approaches. Each half of the pair can be fused with any
intracellular protein or localization sequence, imparting light induced control over a wide
variety of signaling pathways. However, utility of existing light inducible dimers is still limited
due to poor dynamic range between active and inactive states or unknown mechanism of
action, which can impede analysis.
It is the aim of this thesis to design a general cellular optogenetic tool with large
dynamic range, usable in eukaryotic systems, and clear mechanism of activity. In order to
create a tool fitting these criteria, we have engineered a light inducible heterodimer pair from
the SsrA peptide – SspB protein interaction, using the blue light sensitive photoreceptor,
LOV2 from Avena sativa. Irradiation of AsLOV2 with blue light induces a conformational
change in its C-terminal Jα helix. Our initial incorporation of the SsrA peptide into the Jα
helix resulted in a modest change in affinity for SspB with light. Using a protocol of
we were able to engineer an improved light-inducible dimer system, iLID, that exhibits over 50-fold increase in affinity for its partner upon irradiation with blue light. The iLID system comes with two partners, SspB nano and SspB micro, which enables researchers to induce interactions in the nanomolar or micromolar ranges. We have further showed that both iLID pairs can be used to reversibly co-localize proteins of interest in mammalian cells and control small GTPase signaling.
Seeing as all of us are just pieces of all that was before our time, thank you to all people, places, and things found here on Earth, now and in all times past. In your own little tiny way,
ACKNOWLEDGEMENTS
I would like to sincerely thank the huge team of people that went into making this work a success. Oana Lungu brought the LOV domain to the Kuhlman lab and was an excellent mentor in my days as a lowly roton. Seth Zimmerman is an incredible cell biologist and has been able to make a large number of excellent in vivo experiments work that I would not have been able to tackle alone. Gurkan Guntas painstakingly screened a library that would have taken me many lifetimes to explicitly test and because of that, we now have iLID. Hayretin Yumerefendi has been an incredible resource for knowledge both in the
photoreceptor field as well as every other molecular biology technique I could think to ask about. Tishan Williams taught me most of what I know about crystallography and has
opened my eyes to the wonderful world of boardgames; for that I couldn’t be more appreciative. Andrew Leaver-Fay has patiently answered every one of my computer questions over the past 5 years and I owe my ability to operate Rosetta to him and Tim Jacobs. Although it was a long time ago, I wouldn’t be where I’m at today without the incredible guidance of Carrie Purbeck Trunzo, she taught me to be bright where ever I am and I don’t plan on stopping anytime soon. And finally, Brian Kuhlman has set the bar for what a leader and mentor should be. Working with Brian has taught me the incredible impact a leader can have on the people he works with. I will strive to make whatever space I find myself in as open and encouraging as his lab here at UNC. Also, thanks to him, I will always look at a nearby mountain and think to myself, “eh, I bet we can make it up there”.
Burger-Calderon, and Tasha Jurgensen are some of the best people you could hope to live life with and made my time here at UNC about more than just work and studying. Thanks to the 2013 Champion Southern Rail Softball team for giving me my all-time top athletic
achievement. Thank you to every single last Greenleafer (member of my church, Greenleaf Vineyard) for the years of support, incredible discussions and growth, countless prayers, and showing me what the hands and feet of Jesus look like here around town. I would also like to thank my family, Mom, Dad, Nancy, and TC. My parents have always supported my inquisitive nature (even when it drove them nuts) and because of that I’ve found my calling in a field where asking the next question is the only constant. And most importantly, a huge thank you to Amy Hallett, my unbelievably loving wife who has not only made me many meals to-go while writing this, but supports and encourages me every day in a way I never thought even possible.
TABLE OF CONTENTS
ABSTRACT ... iii
ACKNOWLEDGEMENTS ... vi
TABLE OF CONTENTS ... viii
LIST OF TABLES ... xiv
LIST OF FIGURES ... xv
LIST OF ABBREVIATIONS ... xvii
Introduction ... 1
1.1 The Origin of Optogenetics ... 1
1.1.1 Initial Neurobiology Applications ... 1
1.1.2 Promise of Tools in Cell Biology ... 3
1.2 Light Reactive Protein Domains ... 3
1.2.1 LOV Domains ... 4
1.2.2 Cryptochromes ... 6
1.2.3 Phytochrome Domains ... 8
1.2.4 BLUF proteins and Xanthopsins ... 9
1.3 Successful Optogenetic Dimerization Applications ... 10
1.3.1 Dimerization Strategies ... 10
1.3.2 CRY2-CIB1 ... 13
1.3.3 TULIPs: Tunable Light-Controlled Interacting Protein Tags ... 14
1.5 Figures ... 17
Designing photoswitchable peptides using the AsLOV2 domain ... 21
2.1 Overview ... 21
2.2 Introduction ... 22
2.3 Materials and Methods ... 24
2.3.1 Identifying Peptides Compatible with LOV2 Caging ... 24
2.3.2 Cloning ... 25
2.3.3 Protein Expression and Purification ... 26
2.3.4 Peptides ... 27
2.3.5 Fluorescence Polarization Experiments ... 27
2.3.6 Illumination ... 28
2.3.7 LOV-SsrA Design ... 29
2.3.8 LOV-SsrA Thermal Reversion ... 29
2.3.9 Surface Plasmon Resonance ... 29
2.3.10 Actin Co-sedimentation Assays ... 30
2.3.11 Analysis of Actin Co-sedimentation Assays ... 30
2.3.12 Isothermal Calorimetry Binding Experiments ... 31
2.3.13 Initial LOV-ipaA competition inhibition measurements ... 31
2.3.14 Structural Software and Data Presentation Methods ... 31
2.3.15 Yeast Two-Hybrid Assays ... 32
2.4 Results ... 32
2.4.1 Identifying Peptides Compatible with AsLOV2 Caging ... 32
2.4.2 Design of LOV-ipaA ... 34
2.4.3 Dark- and Lit-State Binding between LOV-ipaA and Vinculin D1 ... 35
2.4.5 Design and Optimization of LOV-SsrA ... 38
2.4.6 LOV-ipaA Binding to Full-Length Vinculin: Actin Cosedimentation Assays ... 40
2.4.7 Photo-Activatable Yeast Transcription ... 42
2.5 Discussion ... 43
2.6 Supporting Information ... 45
2.6.1 FASTA sequences of LOV-ipaA and LOV-SsrA ... 45
2.6.2 Matlab code for fitting LOV-ipaA polarization competition assay ... 45
2.7 Tables ... 48
2.8 Figures ... 50
Engineering an improved light-induced dimer (iLID) for controlling the
localization and activity of signaling proteins ... 60
3.1 Overview ... 60
3.2 Introduction ... 61
3.3 Materials and Methods ... 64
3.3.1 Design and Construction of Computationally Directed Library ... 64
3.3.2 Construction of the shuffled library ... 65
3.3.3 Phage Display Selection Against SspB ... 65
3.3.4 Photoswitch Evaluation by Soluble Protein ELISA ... 66
3.3.5 Growth and Purification of Recombinant Proteins ... 67
3.3.5 Fluorescence Polarization Binding Assays ... 68
3.3.6 Thermal Reversion Assay ... 68
3.3.7 Crystallization and Structural Determination of iLID ... 68
3.3.8 Mammalian Cell Culture and Transfection ... 69
3.3.9 Mammalian Cell Localization/GEF Microscopy and Image Analysis ... 69
3.3.10 Mammalian Cloning and Vector Information ... 70
3.4.1 Computational library screened by phage display and protein ELISA ... 71
3.4.2 In vitro Characterization ... 72
3.4.3 Structural Characterization of iLID ... 73
3.4.4 Reversion and paired down iLID ... 74
3.4.5 Subcellular recruitment ... 75
3.4.6 Light induced GTPase signaling through GEF localization ... 76
3.5 Discussion ... 78
3.6 Supporting Information ... 80
3.6.1 Fasta Sequences of Phage Display Constructs ... 80
3.7 Tables ... 81
3.8 Figures ... 85
Correlating the in vitro and in vivo activities of light induced dimers:
a guide for applications in cellular optogenetics ... 96
4.1 Overview ... 96
4.2 Introduction ... 97
4.3 Methods ... 99
4.3.1 Cloning, Expression, and Purification ... 99
4.3.2 Fluorescent Probe Generation ... 101
4.3.3 Fluorescent Polarization Binding Assay ... 101
4.3.4 Multi-Angle Light Scattering ... 102
4.3.5 Dynamic Light Scattering ... 102
4.3.6 Absorption Recovery after Activation ... 102
4.3.7 Yeast Plasmids Generation ... 102
4.3.8 Yeast Transformation and Mating ... 103
4.3.9 β-Galactose Assay ... 103
4.3.11 Mammalian Cell Culture and Transfection ... 104
4.3.12 Mammalian Cell localization/GEF Microscopy ... 104
4.3.13 Image analysis and quantification ... 104
4.4 Results ... 105
4.4.1 Dark and Lit-state Binding Affinities ... 105
4.4.2 Light-dependent CRY2 Homo-oligomerization ... 107
4.4.3 Reversion Kinetics ... 107
4.4.3 Controlling Sub-cellular Localization ... 108
4.4.4 Mitochondrial re-localization assay ... 111
4.4.5 Light Controlled Transcription in Yeast ... 112
4.4.6 Manipulation of lamellipodial protrusion ... 114
4.5 Discussion ... 115
4.5.1 Reversion Kinetics ... 116
4.5.2 Functional Considerations ... 118
4.6 Tables ... 120
4.7 Figures ... 122
Light Mediated Ubiquitin Transfer ... 136
5.1 Introduction ... 136
5.2 Materials and Methods ... 138
5.2.1 Protein Expression & Purification ... 138
5.2.2 In vitro Ubiquitination Assays ... 139
5.2.3 Mammalian Clones and Methods ... 139
5.3 Results ... 140
5.3.1 In Vitro Ubiquitination Assays ... 140
5.4 Discussion ... 142
5.5 Figures ... 144
Conclusions and Final Thoughts ... 151
6.1 Light Inducible Peptide Caging ... 151
6.2 Computationally Guided Improvement of Functional Protein Domains ... 152
6.3 Leveling the Optogenetic Playing Field; Is LOV All You Need? ... 154
LIST OF TABLES
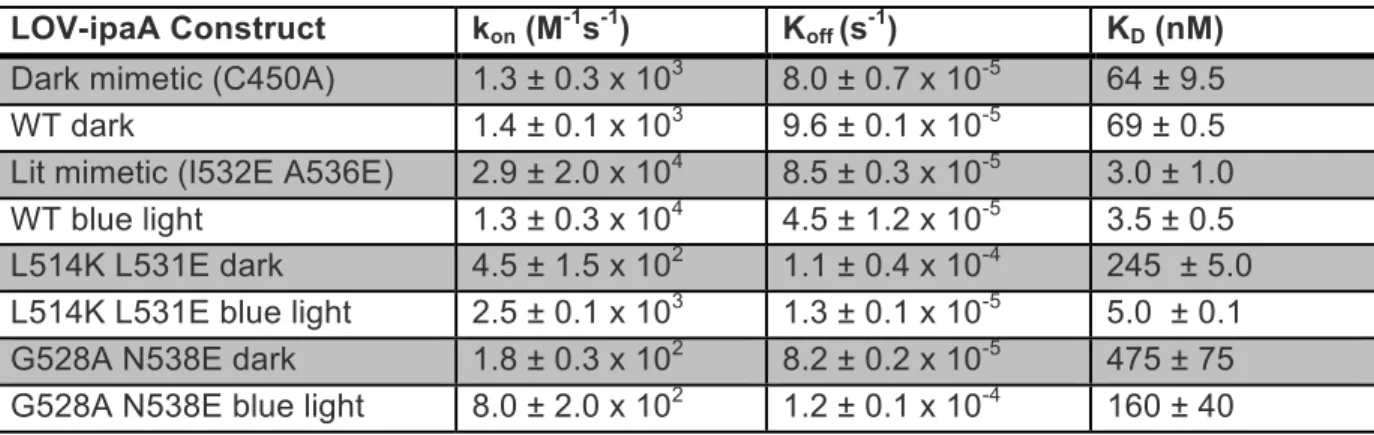
Table 2.1 Kinetic rates of LOV-ipaA binding vinculin D1 ... 48
!
Table 2.2 Lit and dark binding affinities for LOV-SsrA constructs to SspB ... 48
!
Table 2.3 Apparent binding affinity of LOV-ipaA to full-length vinculin ... 49!
Table 3.1. Beginning and Improved iLID affinities ... 81
!
Table 3.2. Reversion Mutation Affinities ... 81!
Table 3.3. Top ELISA Sequence Affinities ... 81
!
Table 3.4. Rosetta predicted point mutations included in library ... 83!
Table 3.5. Data collection and refinement statistics ... 83!
Table 3.6. Construct Information ... 84!
Table 4.1 In vitro characterization ... 120!
Table 4.2 In vivo membrane localization ... 120!
Table 4.3 In vivo mitochondrial localization ... 121!
LIST OF FIGURES
!1.1 Structure of AsLOV2 ... 17!
1.2 Structure of CRY1 and CRY3 PHR domains from Arabidopsis thaliana ... 18
1.3 Structure of Arabidopsis thaliana PhyB ... 19
1.4 Comparison of xanopsin, BLUF, and LOV domain ... 19
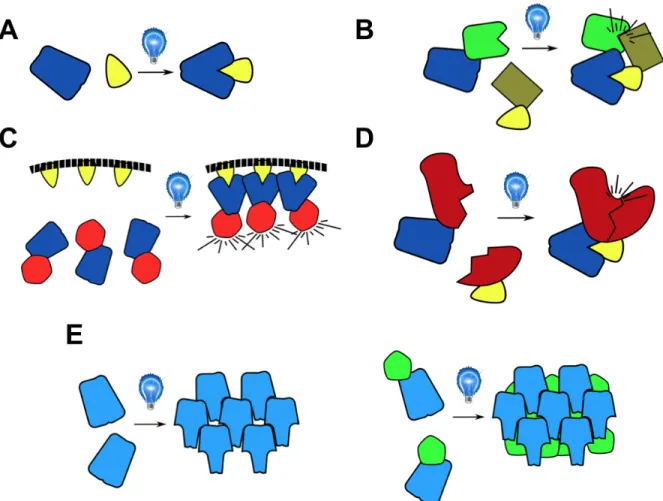
1.5 Schematic of light induced heterodimerization and oligomerization ... 20
2.1 Caged peptide schematic. ... 50
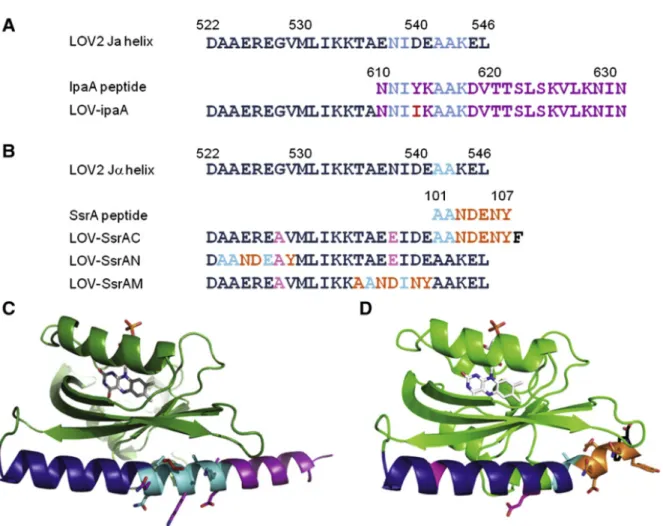
2.2 Sequence alignment of AsLOV2 and peptides ... 51
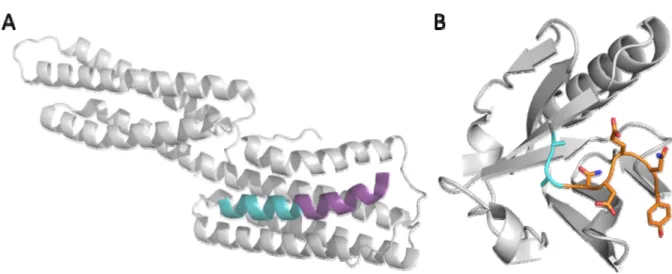
2.3 Crystal structures of peptides binding native partners. ... 52
2.4 LOV-ipaA binding assays. ... 53
2.5 LOV-ipaA binding to vinculinD1 measured by ITC. ... 54
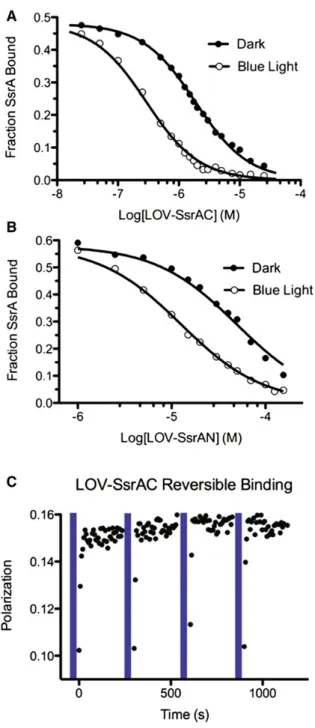
2.6 LOV-SsrA binding to SspB ... 55
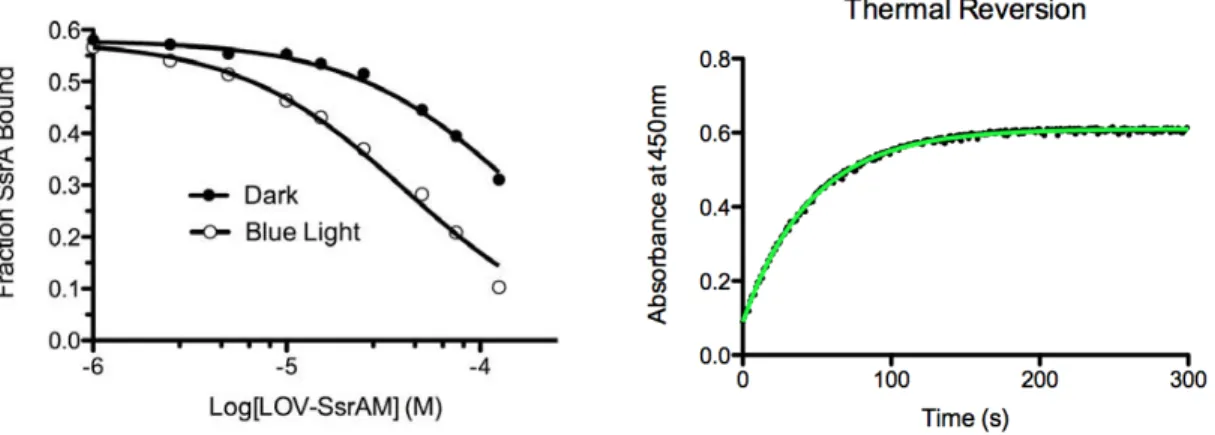
2.7 LOV-SsrAM binding to SspB and kinetics of LOV-SsrAC ... 56
2.8 LOV-ipaA bound to vinculin preferentially binds actin ... 57
2.9 LOV-ipaA/VinculinD1 Yeast Two-Hybrid. ... 58
2.10 LOV-ipaA/VinculinD1 yeast two-hybrid controls and mimetics ... 59
3.1 Binding of LIDs expressed via Tat and SRP pathways to SspB ... 85
3.2 Schematic overview of selection and screening protocol for improved variants ... 86
3.4 Sequence alignment of top four sequences ... 87
3.5 Characterization of iLID nano and iLID micro ... 88
3.6 In vitro binding data for top four sequences ... 89
3.7 Binding of SspB R73Q to ssrA peptide ... 90
3.8 Structure of iLID yields insight to role of mutated residues ... 91
3.9 In Vitro Binding of Reverted iLID Mutants. ... 92
3.10 Affinities of Reverted iLID Mutations ... 92
3.11 Thermal Reversion of iLID and iLID C530M ... 93
3.13 The maximum recruitment of sspB to activated LIDs in cells ... 94
3.14 Activating GTPase pathways through GEF recruitment ... 94
3.15 Spatial control of GEF DH/PH domains by iLID produces localized control of Rac and Cdc42 activity ... 95
4.1 Construct schematic and binding affinities of heterodimer pairs ... 122
4.2 CRY binding to CIB1 with MTHF. ... 123
4.3 CRY2/CIB1 native gel shift binding assay ... 123
4.4 CRY2 multi-angle light scattering and dynamic light scattering ... 124
4.5 CRY2 multi-angle light scattering with MTHF ... 124
4.6 CRY2 and CIB1N size exclusion chromatography ... 125
4.7 Photoreceptor reversion kinetics ... 125
4.8 Photoswitch membrane localization kinetics ... 126
4.9 Orientation specific localization for CRY2 and TULIPs ... 127
4.10 CRY2PHR oligomerization effects switching in unexpected ways ... 128
4.11 Photoswitch mitochondrial localization ... 129
4.12 Yeast two hybrid transcription comparison ... 130
4.13 oLID yeast two-hybrid ... 131
4.14 Light dependent yeast growth ... 132
4.15 DHPH domain targeting to membrane ... 133
4.16 Proposed avidity mechanism for CRY2 binding to CIB1N ... 134
4.17 Incomplete P2A cleavage activates transcription in yeast two-hybrid.. ... 135
5.1 Light Mediated Ubiquitination Schematic ... 144
5.2 Clone schematic for in vitro and in vivo ubiquitination assays. ... 145
5.3 LOV-SsrA in vitro ubiquitination assay ... 146
5.4 Quantification of LOV-SsrA in vitro ubiquitination assay ... 147
5.5 LOV Trap in vitro ubiquitination assay ... 148
5.6 Quantification of LOV Trap in vitro ubiquitination assays ... 149
LIST OF ABBREVIATIONS
ChR2 Channelrhodopsin-2
SPARK Synthetic photoisomerizable azobenzene-regulated K+ channel LOV Light Oxygen Voltage
PAS Per-Arnt-Sim
FMN Flavin mononucleotide
AsLOV2 Avena sativa phot1 LOV2 domain
UV Ultraviolet
FAD Flavin adenine mononucleotide MTHF 5,10-methyltetrahydrofolate PHR Photolyase homology region CCT Cryptochrome carboxyl-terminus RMS Root mean square
ATP Adenosine triphosphate
FADH! Neutral semiquinone state of FAD
GAF Cyclic GMP phosphodiesterase, Adenylate cyclase, FhlA PHY Phytochrome specific
PCB Phycocyanobilin PΦB Phytochromobilin BV Biliverdin IX alpha
Pfr Far-red absorbing state of PCB Pr Red absorbing state of PCB
BLUF Blue-Light Sensors Using Flavin Adenine Dinucleotide AtLOV2 Arabidopsis thaliana LOV2 domain
PA Photoactivatable
DHFR Dihydrofolate reductase PYP Photoactive yellow protein GTP Guanosine triphosphate GDP Guanosine diphosphate TAMRA Carboxytetramethylrhodamine iLID Improved light inducible dimer oLID Original light inducible dimer
TULIPs Tunable, light-controlled interacting protein tags for cell biology
GI Gigantea
PMSF Phenylmethanesulfonylfluoride
CPRG Red D galactopyranoside
ONPG o nitrophenyl D galactopyranoside
Chapter 1
Introduction
This dissertation is primarily focused on advancing the optogenetic field through creation of new light activated tools, the benchmarking of existing tools, and application of such tools to novel cellular uses. This introduction will cover the origins of optogenetics, the underpinnings of blue-light sensitive protein domains, an overview of uses, and evaluation of current limitations.
1.1 The Origin of Optogenetics
1.1.1 Initial Neurobiology Applications
incorporation of a photoactive moiety into the Drosophilia K+ Shaker channel. It was known that Shaker voltage gated ion channels are blocked by the binding of quaternary ammonium ions. Using available structural information, an azobenzene moiety with a cysteine reactive group on one end and an ammonium ion on the other, was incorporated into an extracellular loop of the Shaker channel approximately 15-18 Å away. Azobenzene is a photoreactive molecule, two phenyl groups connected by an N=N double bond. Irradiation with light ~360 nm causes the double bond to isomerize from the trans to cis conformation5. The trans state can be reverted to cis through exposure to ~500 nm light or will decay naturally
through thermal conversion5. Once incorporated, the azobenzene acts as a photoactive ion gatekeeper, with trans-azobenzene positioning the ammonium ion to block the ion channel. Photoisomerization of the moiety releases inhibition and allows for ion transfer. Using this strategy, researchers demonstrated the ability to induce action potentials with short-wavelength light and silence them with long-short-wavelength light in rat hippocampal neurons expressing the chemically modified SHAKER constructs4. The downside to this method was the need for chemical modification post-expression in addition to incorporation of the
SHAKER gene. While these pioneering techniques gave a new level of spatial control to neurobiologists, there was still the issue of timescale. Both techniques operated on the second to minute timescale, about a thousand fold slower than necessary to induce single action potentials. A third innovation to the field less than a year later reduced the timescale of control to the millisecond level6, and solidified optogenetics as more than just a passing trend. This advancement was made possible through use of an algal photoreceptor, Channelrhodopsin-2 (ChR2). ChR2 had recently been discovered as a naturally occurring light-regulated cation channel from Chlamydomonas reinhardtii7, and using lentiviral
excitation could be used to excite ChR2. These three initial optogenetic milestones demonstrated simple and viable methods for control of mammalian neurons with light and paved the way for the decade of advancement that would follow.
1.1.2 Promise of Tools in Cell Biology
While initially limited to neurobiology, the promise of optogenetic cellular control extended into almost all cell biology fields. The aforementioned initial experiments set the precedent for what characteristics of optogenetic tools are needed to be useful in studying biological questions. In order to be useful, optogenetic tools need to be genetically
encoded, respond quickly to external stimuli, respond reversibly, and be designed such that they are simple to use for a variety of applications. While these initial optogenetic tools were only really useful in the neurobiology field, they highlighted the degree of spatial and
temporal control that light afforded researchers. As the field expanded to create
generalizable tools that could be used by any cell biologist, the design strategies seen in those first optogenetics tools surfaced again; structure based design of novel
photoreceptors, direct harnessing of naturally occurring photoreceptors, and incorporation of
photoactive moieties into functional protein domains. A researcher’s view of a given cellular pathway is limited by the resolution and capabilities of the technology they use to probe their
system. To meet these needs, novel tools with a variety of spectral properties, kinetic rates, and molecular characteristics have been engineered from a wide assortment of natural photoactive macromolecules.
1.2 Light Reactive Protein Domains
functionalities to choose from. Protein photoreceptors vary in the wavelength of activation, timescale of reversion, response upon activation, chromophore usage, and compatibility within host organism. This diversity has allowed for many different cellular uses and highlights the importance of photoreceptor selection for a given application. Surprisingly, use and reengineering of a photoreceptor to become a molecular tool is not contingent upon detailed understanding of its mechanism of action; as such newly discovered and poorly understood protein domains have been added to the optogenetic toolkit. However, for many applications this is a drawback and should contribute to the selection criteria for a given photoreceptor. It is noteworthy to mention that there are a wide variety of photoactive chemical moieties8 (like azobenzene for one), which have been used to control cellular processes like protein expression9,10 and cell cycle progression11, however they are outside the scope of this work.
1.2.1 LOV Domains
with a nearby cysteine residue in the LOV domain while in this metastable intermediate state15,16. After formation, the covalent adduct and FMN cofactor thermally reverts back to their ground states. The kinetics of this process vary widely among LOV domains, from seconds to minutes to hours and even days15,17,18. In their natural context, the formation of this covalent adduct propagates a conformational change throughout the protein, and modulates the activity of a response domain at the carboxyl-terminus of the LOV domain. Known response elements regulated by LOV domains are histidine kinases, transcription factors, phosphodiesterases, and proteins that regulate circadian rhythm12. In the
optogenetics engineering field, a handful of LOV domains have been plucked out of their native habitat to be used as the basis for creating novel molecular switches; of most
important to this work is the LOV2 domain from Avena Sativa (AsLOV2). AsLOV2 regulates its carboxyl-terminal kinase domain through light-dependent displacement of the Jα helix, a helix connecting the FMN-containing PAS fold with the kinase (Figure 1.1)19,20. It is currently unknown exactly how the signal is transduced from the FMN-cysteine adduct to the Jα helix, however key residues involved in this process have been identified21,22. As its role in the photoactivation process is paramount, many groups have studied the dynamics of the Jα helix extensively. In one study, NMR was used to measure the free energy change of the transition from dark to lit state. They measured the equilibrium of AsLOV2 to be 1.6% Jα-unbound / 98.4% Jα-Jα-unbound in the dark, and 8% Jα-Jα-unbound / 92% Jα-bound under blue light; an approximately 3.8 kcal mol-1 change in free energy between lit and dark states23. It was also found that the amino terminal helix of AsLOV2, the A’α helix, unfolds upon
irradiation with blue light22,24. This was first proposed based on small structural
by circular dichroism, change in tryptophan fluorescence, and correlations of residue specific CPMG values all measured in both the light and dark, it was concluded that the A’α helix undocked first, which then allowed the Jα helix to undock24. This work was followed up shortly thereafter with an even more extensive list of mutations and various biophysical characterizations, indicating a wide variety of photocycle half-lives, from ~23 minutes to 2 seconds, as well as the promise of some mutations that increase the signal change between the lit and dark states25. This breadth of structural information and biophysical
characterization concerning AsLOV2 and other LOV domains, have rendered them some of the most popular photoreceptor domains in the optogenetic repertoire.
1.2.2 Cryptochromes
Cryptochromes are another class of blue light sensing photoreceptors and the first to be studied at the protein level26. Best studied in Arabidopsis thaliana, three cryptochromes have been discovered: CRY1, CRY2, and CRY327–29. In recent years, CRY2 has emerged as one of the most useful photoreceptors in optogenetics. Similar to the LOV domains of the phototropins, cryptochromes absorb blue light, with a maximum absorption at 450 nm
and smaller absorption peaks in the near ultraviolet (UV) range30. Their absorption spectrum is largely imparted by their cofactor, flavin adenine dinucleotide (FAD), which
similar to FMN, absorbs maximally at 450 nm27. Distinct from LOV domains, cryptochromes have an additional cofactor, 5,10-methyltetrahydrofolate (MTHF) used in harvesting
additional light in the UV range30. Cryptochromes generally consist of two domains, an amino terminal photolyase homology region (PHR) and a specialized cryptochrome
carboxyl-terminus (CCT), which varies between cryptochrome variants (and is missing from CRY3)31. Despite their structural similarity to photolyase domains, the cryptochromes in Arabidopsis do not have DNA repair activity. The cryptochrome PHR domain of CRY1 and
structural information for CRY2 PHR or either CRY1 or CRY2 CCT domain currently. The overall topology of CRY1 PHR and CRY3 PHR are very similar (RMS of 1.9 Å, PDB codes: 1u3d & 2j4d), both consist of an amino terminal α/β domain, a short linker, and an α domain. However, one interesting difference is the presence of a MTHF binding site in CRY3, but not in CRY1 (Figure 1.2B). Additionally, an adenosine triphosphate (ATP) binding site is seen in the CRY1 structure (Figure 1.2A), which corroborates previous in vitro data32. The
cryptochrome PHR domain binds all cofactors noncovalently, which is the most frequent explanation for why either ATP or MTHF are not found in purified protein samples34. The FAD binding site is made up of three conserved tryptophan residues within the α domain, but their specific role in photoactivation is somewhat unclear35. Mutation of each of these residues in CRY1 results in decreased ability to respond to blue light, however, in CRY2 similar mutations result in constitutive activation36. Recently, an electron transfer pathway not utilizing the canonical tryptophan triad has been proposed37. In any case, when
irradiated with blue light, the FAD cofactor is reduced to form a neutral semiquinone radical (FADH!)38–40. This species is considered by some to be the active signaling state of
AtCRY1 and AtCRY2. Post excitation and activation, the cryptochromes undergo a
conformational change, leading to the displacement of the CCT domain41. It has also been shown that CRY2 PHR domain binds CIB1 after exposure to blue light42. CRY1 and CRY2 both become phosphorylated after exposure to blue light43,44, adding another layer of complexity to this mechanism. More recently, CRY2 has been shown to oligomerize in a light dependent fashion, but through currently unknown means45. Despite a general uncertainty on the overarching mechanism, site of conformational change, and
1.2.3 Phytochrome Domains
Phytochromes have been found to absorb light across almost the entire spectra of visible light, but most commonly sense red and far-red light48–51. They are found in plants, fungi, bacteria, and cyanobacteria. The phytochrome core photoreceptor is made up of three domains: a PAS domain, a GAF (cyclic GMP phosphodiesterase/adenylate cyclase/FhlA) domain, and a PHY (phytochrome specific) domain (Figure 1.3)49.
Phytochromes form a covalent bond with their chromophore between a conserved cysteine residue in either the PAS or GAF domain and the C3 carbon of the A-ring in the
chromophore49. The bound phytochrome chromophore varies between organisms, but it is usually a linear tetrapyrrole (bilin) derivative49. In plants and cyanobacteria, that derivative is phycocyanobilin (PCB) or phytochromobilin (PΦB); in bacteria or fungi the chromophore is biliverdin Ixα (BV)49,52. Irradiation with red light (660 nm - 680 nm) causes an isomerization of the chromophore, most frequently about a double bond connecting the C-ring and D-ring (Figure 1.3C)49. This isomerization induces a conformational change in the bound protein and is passed along to an effector domain. The isomerized chromophore is also light sensitive, however the spectrum is red-shifted, now responding to far-red light. Irradiation of the far-red absorbing (Pfr) state with far-red light (740 nm - 760 nm) causes another
chromophore, rendering them light insensitive until chromophore addition. This has been
sold as an advantage since steps are normally taken to prevent early exposure of a
photoreceptor to light before an experiment. The other major advantage of the PhyB
photoreceptor is independent control over both the Pr and Pfr states. This gives users direct
control of reversion timescale and allows them to be synced in either state with a flash of
light. It has been shown that the Pfr state of PhyB interacts with PIF3, but not the Pr state57.
In the field of optogenetics, the red light dependent PhyB interaction with PIF3 and PIF6 has
been utilized for light-dependent heterodimerization53,57,58. However, many specific
applications involving phytochromes from bacteria (bacteriophytochromes) have been
reported utilizing either their native effector domains or engineering domains from other
organisms leading to red light induced activity, including transcription59 and adenylate
cyclase activity60. An in-depth look at light-induced dimerizing applications will be reviewed
in section 1.3.
1.2.4 BLUF proteins and Xanthopsins
While LOV domains, cryptochromes, and phytochromes are the most prevalent
photoreceptors used in cell biology, it is important to mention the remaining classes of
photoreceptors: blue-light sensors using flavin adenine dinucleotide (BLUF) and
xanthopsins. BLUF domains are small protein domains (~100 - 250 amino acids) similar in
size to LOV domains (Figure 1.4). The BLUF chromophore, FAD, becomes excited upon
absorbing a photon of blue light, which rearranges a hydrogen bond network involving a
conserved tyrosine and glutamine61,62. This rearrangement is propagated through a nearby
β-scaffold, changing interactions with a C-terminal α-helix, Ccap, which changes interactions
with effector domains or interaction partners63. Interestingly, it has been shown that AppA,
PixD, and YcgF all form protein-protein interactions in the dark, but these complexes
blue and near-uv region of visible light64. Xanthopsins use 4-hydroxy-cinnamic acid (p-Coumaric acid) as their chromophore64. Absorption of a photon causes a cis- to trans- isomerization of the chromophore, which after a number of intermediate states, becomes deprotonated65. It is the negative charge formed by this deprotonation that is thought to cause a partial unfolding event in the amino terminal cap that induces signaling65. The most widely known xanthopsin, photoactive yellow protein (PYP) from Halorhodospira halophila, has been used to control light dependent DNA binding66,67.
1.3 Successful Optogenetic Dimerization Applications
While traditional optogenetics aims to modulate the potential across a cell
membrane, cellular optogenetics aims to modulate protein-protein interaction networks in order to better understand the cellular signaling environment. While many proteins have been engineered to be light sensitive through incorporation of a photoreceptor68–71, this section will focus on more generic applications. Specifically, the use of dimerization to control a variety of processes like transcription, degradation, and motility will be covered. Additionally, the CRY2/CIB1 and TULIP heterodimerization pairs will be reviewed in detail due to their characterization in chapter 4.
1.3.1 Dimerization Strategies
Cellular homeostasis depends on many protein – protein interactions occurring in specific locations all around the cell simultaneously. In order to better study these
Direct co-localization of two proteins is the broadest category, useful for inducing
protein – protein interactions that have a direct effect. One great example of direct
co-localization was seen in the development of photoactivatable protein degradation tags72. In
this instance a target protein was fused to a LOV2 domain from Arabidopsis thaliana with an
ornithine decarboxylase degron incorporated into its carboxyl-terminus. Light induced
changes from AtLOV2 allowed the degron to interact with the proteasome and caused
degradation of the target protein72. Using this technique they showed almost complete
ubiquitin-independent degradation of red fluorescent protein (RFP) in yeast after 4 hours of
blue light exposure. Follow up studies to this work later showed this mechanism was
tunable, allowing for both shorter and longer lived degron variants73. Gene transcription has
also been controlled with this strategy through light induced localization of a DNA binding
protein (zinc finger protein) with an activation domain (VP16)74–76.
Light induced localization change has most frequently been used as a way to
regulate cell motility, whether directly through guanosine triphosphatase (GTPase)
localization or indirectly through guanine nucleotide exchange factor (GEF) localization. In
the direct application, one half of a heterodimer pair is plasma membrane localized and the
other is fused to a constitutively active variant of the GTPase without a membrane
localization sequence53,77. As GTPases are natively targeted to the plasma membrane
through attachment of a prenyl group where they interact with effectors, removal of this
makes its activity conditional on induced localization (for the constitutively active GTPase
variant)78. In the indirect application, a GEF is localized to the plasma membrane with light
to activate endogenous GTPase. This strategy has been utilized in yeast to control
polarized growth79. In this example, the GEF Cdc24 was fused to one half of a heterodimer
pair and the other half fused to the transmembrane protein Mid279. Light induced
recruitment of the GEF to the membrane led to the formation of a protrusion within 45° of the
Sequestration through hetero- and homo-oligomerization has only been achieved with a single photoreceptor, CRY245,47,80. In this approach, a single protein is fused to the protein that oligomerizes in response to light. Oligomerization occurs in such a way to sequester or activate the fused proteins’ function, creating a generalizable way to control protein function. This set-up is advantageous since it only requires the addition of a single component, instead of the two required from a heterodimer pair. Homo-oligomerization has been used to activate the Wnt/β-catenin pathway, Rac1 activity and RhoA activity through direct fusion to CRY245. Light-induced hetero-oligomerization has also been demonstrated by combining the CRY2 oligomerization with CRY2 light-depended CIB1 binding. Hetero-oligomerization, with CRY2, CIB1, and an additional multimeric protein, has been used to inactivate Tiam1, Vav2, Rac1, RhoG, and Cdc4280. While clearly powerful, this method is less precise as the mechanism of CRY2 oligomerization is unknown. A more precise and still generalizable method of light-induced protein activity uses the fluorescent protein Dronpa and its native light inducible monomerization. In this method, fusion of Dronpa to the N- and C- terminus of a protein causes the dimer or tetramer oligomer to occlude access to the protein. Irradiation with light at 490 nm induces monomerization of Dronpa and allows for the protein of interest to interact natively. In this manner, the GEF intersectin and a protease were caged, only active after irradiation with light81.
1.3.2 CRY2-CIB1
The blue light dependent interaction between CRY2 from Arabidopsis thaliana and
CIB1 was initially described in 200842 and first utilized as an cellular optogenetics tool in 201086. In this initial proof-of-principle and description, the minimal domain elements required for functionality were identified using a yeast two-hybrid approach. The PHR
domain from CRY2 (residues 1-498) and the N-terminal fragment (residues 1-170) were
enough to confer light induced transcription86. This assay showed that CRY2 binding to CIB1 and CIB1N resulted in substantially less background activity in the dark (and less
activity in the light) whereas CRY2 PHR binding to CIB1 and CIB1N resulted in much higher
dark state activity (and more activity in light). In all experiments, the CRY2 half of the switch
was fused to the Gal DNA binding domain and CIB1 fused to the activation domain. Light
induced transcription was also shown to be dose-dependent by delivering a series of 10
second pulses of blue light, 8 minutes apart, and showing a proportional increase of protein
product to number of blue light pulses86. In mammalian cells, the CRY2-CIB1 interaction was demonstrated in two ways. First, plasma membrane bound CIBN1-GFP (green fluorescent
protein) and mCherry-CRY2 were transfected and irradiated with blue light. Within 10
seconds of illumination, mCherry-CRY2 had fully accumulated at the membrane and after
~12 minutes of darkness it had returned fully to the cytoplasm86. This interaction was repeated in the same cell to determine if the interaction was reversible and repeated full
activation was observed. In a final display of protein control, a Cre recombinase split into
two halves was reconstituted through CRY2 and CIB1N binding, leading to loxP
recombination in 16.4% of cells after 24 hours of blue light86. Since its initial debut, this pair has been used by a number of labs in a variety of applications. The pair is functional in
zebrafish, where one group showed both light dependent activation and suppression of
dependent CRY2 binding and blocking of CIB1N’s native transcription activation42,83. In a
step toward being more biologically adaptable, CRY2/CIB1 was used to modulate
transcription of endogenous genes through colocalization of transcription activator-like
effectors (TALEs) with VP64 (a 4 copy fusion of the transcription activator, VP16)75. TALEs
can be engineered to bind any DNA sequence of choice due to a one to one relationship
between a repeat in the protein and interaction with a single base pair of DNA87. As a result,
the CRY2-TALE fusion can be localized to any locus in the genome and CIB1-VP64
recruitment induces transcription there. This system, called LITEs (light inducible
transcriptional effectors), was shown to produce more than 15-fold more mRNA after 8
hours of exposure to blue light than when left in the dark75. LITEs were also used to
site-specifically modify histones and modulate expression through localization of
methyltransferases and deacetylases75. A similar method of light induced DNA localization
is now possible by using a deactivated Cas9 (dCas9) to target a specific stretch of DNA88.
The CRY2-CIB1 system has been used to control cellular cytoskeletal function as well.
CIB1-Lifeact fusions allowed for light induced CRY2 localization to F-actin. Light induced
CRY2-(constitutively active)cofilin localized to F-actin and was shown to increase filopodia
formation as well as lamellipodia formation and movement89.
1.3.3 TULIPs: Tunable Light-Controlled Interacting Protein Tags
TULIPs were developed by engineering the AsLOV2 domain to selectively bind an
engineered PDZ domain (ePDZb) in response to light79. This was achieved by incorporating
a PDZ binding peptide into the Jα helix of AsLOV2, called LOVpep. Unfolding of the helix in
response to blue light frees the peptide and allows binding to ePDZb. They showed that
many mutations that had previously tuned the Jα helix lit/dark equilibrium also changed
dynamics of the LOVpep equilibrium, and thus were able to tune their extent to which the
caging (lower dark state binding), I532A, previously shown to increase Jα helicity and increase caging, and V529N, previously shown to decrease caging90. Therefore, in order from expected weakest dark state binding to tightest, the mutation pairs tested were: T406-7A+I532A, T406-7A, LOVpep alone, and V529N. This system also came with two other protein-binding partners, the starting PDZ domain that binds weaker than ePDZb, and the affinity-matured ePDZb1, which has a tighter affinity91. This modularity gave LOVpep three regimes of affinity it could switch over, each with a number of mutations in AsLOV2 to “fine tune” for a specific application. This wide range of switching was demonstrated by
monitoring colocalization of fluorescent protein fusions with each LOVpep and ePDZ variant in the presence and absence of light in yeast. The dynamic range varied from low levels of localization in both the lit and dark states (LOVpepT406-7A,I532A:PDZ) to almost full localization in both states (LOVpep V529N:ePDZb1)79. These findings directly correlated relative affinity and caging (albeit absolute affinities values unknown) to in vivo function. Applying these tools to functional activity, they were able to light-dependently control MAPK activation and cell polarity79. Since their public debut, TULIPs have only been used in a handful of applications. In a truly novel application, researchers fused LOVpep to PEX3, a peroxisome localization sequence and ePDZb1 to either kinesin or dynein. They found that blue light induced localization of kinesin led to peroxisome movement toward the outside of the cell and localization of dynein caused peroxisome movement toward the center of the cell92. This was as expected as kinesin directs transport toward the plus end of microtubules and dynein directs towards the minus end93. Light-induced motor protein localization to endosome and mitochondria also changed dynamics of each substructure92.
1.4 Drawbacks and Limitations of the Field
Cellular optogenetics affords a level of spatial and temporal control over cell
field that next-generation tools and approaches should be mindful of. As described, most existing tools respond to blue light, which does not penetrate more than 1 mm into tissue94. Red light penetrates farther, ~3-4 mm94, but this keeps cellular optogenetic tools relegated to cell culture and epidermal animal applications, unless light sources are implanted. In order to overcome this, tools that respond to longer wavelengths of light need to be developed.
Each tool discussed has a set of limitations that preclude it from one application and ideal for another. This highlights the needs for a wide variety of tools and methods. So far one of the largest drawbacks is a residual activity in the target off state. As most
heterodimer and oligomer tools rely on changes in affinity between states, overexpression of one component or both can drastically reduce dynamic range. This has been noticed
specifically in a few cases76,82, but undoubtedly would occur in any case where expression exceeded dark state affinity. Therefore, tools with increased dynamic ranges and methods to increase dynamic ranges are needed. Additionally, cellular optogenetic tools need to have precise characterization to better aid those who use the tools in choosing the correct tools for a given application. Explicit declaration of limitations and methods of use should be provided upon release of any tool. In order to fully compare tools as they are developed, a set of benchmark experiments could be developed to highlight the advantages and
disadvantages upon release. Finally, most uses of heterodimerization thus far have been proof of principle and validation using known mechanisms of protein signaling. If the field is to survive and leave an impact, it must use the newfound spatial and temporal control push the current boundary of cellular knowledge.
In the work that follows we describe the design (chapter 2), improvement (chapter 3), benchmarking (chapter 4), and novel application (chapter 5) of a new light-inducible
1.5 Figures
Figure 1.1 Structure of AsLOV2. A) AsLOV2 structure, PAS domain in green, Jα helix in blue, A’α helix in orange, FMN cofactor shown in black spheres B) Interactions between A’α and Jα helix C) C450 in dark state D) C450 in lit state, bound to FMN (PDB IDs A-C: 2v0u; D: 2v0w)
Figure 1.3 Structure of Arabidopsis thaliana PhyB. A) Dimer PhyB structure showing PAS (green), GAF (pink), and PHY (orange) domains. PCB cofactor is shown in black. B) PhyB showing individual monomer subunits. C) PCB cofactor with pyrrole ring naming shown. (PDB: 4our)
Figure 1.5 Schematic of light induced heterodimerization and oligomerization. A) Light inducible heterodimer pair (Used in B-D) B) Light induced co-localization of green and brown proteins. C) Light induced localization of red protein to membrane D) Light induced
Chapter 2
Designing photoswitchable peptides using the AsLOV2 domain
1This work was published in the journal Chemistry & Biology, Volume 19, Issue 4,
p507-517 on 20 April 2012. Oana Lungu developed the LOV-ipaA switch and performed
experiments relating to LOV-ipaA. Ryan Hallett developed the LOV-SsrA switch and
performed all experiments relating to LOV-SsrA. Eun Jung Choi developed the peptide
search algorithm. Mary J. Aiken performed LOV-ipaA binding experiments. This work was
guided and funded by Klaus Hahn and Brian Kuhlman.
2.1 Overview
Photocontrol of functional peptides is a powerful tool for spatial and temporal control
of cell signaling events. We show that the genetically encoded light-sensitive LOV2 domain
of Avena Sativa phototropin 1 (AsLOV2) can be used to reversibly photomodulate the
affinity of peptides for their binding partners. Sequence analysis and molecular modeling
were used to embed two peptides into the Jα helix of the AsLOV2 domain while maintaining
AsLOV2 structure in the dark but allowing for binding to effector proteins when the Jα helix
unfolds in the light. Caged versions of the ipaA and SsrA peptides, ipaA and
LOV-SsrA, bind their targets with 49- and 8-fold enhanced affinity in the light, respectively. These
switches can be used as general tools for light-dependent colocalization, which we
demonstrate with photo-activable gene transcription in yeast.
1This chapter previously appeared as an article in Chemistry & Biology. The original citation is as
2.2 Introduction
Peptides regulate a variety of biological processes by acting as competitive
inhibitors, allosteric regulators, and localization signals95–97. Photocontrol of peptide activity
is a powerful tool for precise spatial and temporal control of cellular function98,99. Typically,
photo-activation of peptides has been achieved by covalently modifying peptides with
chemical groups that inhibit function until they are removed by light10,100. Because such
derivatized peptides must usually be synthesized in vitro, one challenge of this approach is
getting the peptides into living cells or animals. Additionally, in most cases the
photo-induced reaction is not reversible. Recently, there has been considerable progress in the
use of naturally occurring photo-activable proteins to engineer light switches that are
genetically encoded and reversible46,68,101,102. In the majority of cases, the goal has been to
regulate the activity of folded protein domains. Here, we examine if the LOV2 domain
from Avena sativa phototropin 1 (AsLOV2) can be used to photomodulate the affinity of
peptides for binding partners103.
AsLOV2 is part of the PAS superfamily of domains16. It contains a flavin
mononucleotide (FMN) cofactor located in the center of the PAS fold, as well as a large α
-helical region C-terminal to the fold, termed the Jα helix19,104. Upon irradiation with blue light,
a covalent adduct is formed between a cysteine side chain in the PAS fold and a carbon
atom of the FMN15,105. Spectroscopy studies indicate that this leads to a large
conformational change in the domain, including the unfolding of the Jα helix106,107. When
irradiation ceases, reversion of the thiol bond and conformational change back into the dark
state occurs spontaneously within seconds to hours, depending on the LOV domain
ortholog108.
The large conformation change that occurs within the Jα helix has been previously
harnessed to create a photoswitchable GTPase termed PA-Rac68; a photoswitchable variant
LOV-TAP69,90; and a photo-activatable DHFR enzyme70. In these studies, entire protein domains were fused to the end of the Jα helix in order to sterically occlude binding with effector molecules or perturb the conformational state of the attached domain. Upon blue
light irradiation, unfolding of the Jα helix relieves the steric block or conformational strain. Because peptides are more flexible than are folded domains, it may not be sufficient to
place them at the end of the Jα helix to achieve a steric block; tighter caging may be obtained by embedding their functionality within the Jα helix (Figure 2.1). A similar strategy
has been successful for caging coiled-coil peptides in the light-sensitive photo-active yellow
protein (PYP)67. In the case of AsLOV2, the challenge is identifying sequences that incorporate the target binding of the peptide while maintaining the functionality of the Jα helix. One face of the Jα helix is exposed to solvent, while the other face forms hydrophobic interactions with a β sheet in the AsLOV2 domain. Residues on the surface of the helix are expected to be tolerant to mutation, whereas the buried residues should be more conserved.
Similarly, most peptides have sets of residues that are required for binding target proteins,
whereas other positions can be varied. These observations indicate that it may be possible
to identify chimeric sequences for the Jα helix that maintain key interactions with the AsLOV2 domain but incorporate residues critical to peptide function. In this study, we use
sequence comparisons along with molecular modeling to create AsLOV2 variants that
embed the binding properties of the ipaA109 and SsrA110 peptides in the Jα helix.
The usefulness of a photoswitch depends on how much the activity is enhanced by light
irradiation (dynamic range) as well as the absolute activity in the dark and in the light.
Naturally occurring protein switches vary considerably with regard to absolute activities and
dynamic range, indicating that the appropriate switching power for a particular application is
likely to be system dependent. For instance, the AsLOV2-derived PA-Rac switch binds to its
naturally cycles between the GDP and GTP bound state111. Studies with the wild-type AsLOV2 domain indicate that it should be possible to create AsLOV2-based switches that
show larger changes in activity upon light activation. Nuclear magnetic resonance (NMR)
studies have shown that light activation changes the ratio of docked to undocked Jα helix
from 98.4:1.6 in the dark to 9:91 in the lit state23. This corresponds to a 3.8 kcal mol−1change in free energy, which if efficiently harnessed could be used to create switches that have
greater than 100-fold changes in binding affinity for target molecules. In scenarios that
involve competitive binding to the Jα helix, that is, the helix is either docked against the LOV
domain or bound to an effector molecule, it may be necessary to stabilize the helix docked
state in order to take full advantage of the free energy perturbation that light activation
provides. Strickland et al. (2010) showed that mutations that stabilize the docked Jα helix
could be used to lower the dark state affinity of LOV-TAP for DNA and improve its dynamic
range from 5- to 70-fold. Here, we identify further mutations that stabilize a docked Jα helix
and show that the peptide switches can also be tuned by varying the location in which the
caged sequence is embedded in the Jα helix and by varying the intrinsic affinity of the
peptide for its target.
As an application of our tunable peptide photoswitches, we show that the caged ipaA
peptide can be used to induce gene expression through light-activated heterodimerization in
yeast, demonstrating that the caged peptides can be used as general tools for colocalizing
proteins in living cells.
2.3 Materials and Methods
2.3.1 Identifying Peptides Compatible with LOV2 Caging
The protein database was searched for PDB files that have multiple chains and at
comprehensive list of peptides that have been co-crystallized with binding partners. 3137
peptides were identified. To evaluate if a peptide was potentially compatible with caging by
the LOV2 domain we used a sliding window of 6 residues to compare the sequence of the
Ja-helix with the peptide under consideration. A favorable score was assigned to an aligned
residue pair if two residues in the alignment were similar or identical. The following sets of
amino acids were considered similar: (K, R), (D, E), (F, Y, W), (N, Q) and (S,
T). Additionally, the score for an aligned residue pair was adjusted depending on how
buried the LOV2 residue was in the LOV2 domain and how buried the peptide residue was
in the peptide/protein co-crystal. The rationale for this scheme was that buried residues are
more likely to be important for caging and binding to the target protein. For instance, if the
alignment under consideration matched a buried position from the Ja helix with a residue
buried in the peptide/protein complex than the match was considered very favorable if they
were identical or similar (4 or 3 points respectively), and unfavorable if they were dissimilar
(- 4 points). When matching two surface positions there was a weak bonus for identity or
similarity (2 or 1 point) and no penalty for dissimilarity. The total score for the alignment was
the sum of scores from the six residue pairs. The best scoring alignment had a score of 17
points, and over 200 alignments scored 9 points or better. Despite scoring well in this
scheme, a peptide may still be unsuitable for caging if it includes additional critical residues
(outside the six residue window) that do not align well with the Ja-helix or do not extend off
the end of the Ja-helix as in the case of LOV-ipaA.
2.3.2 Cloning
The LOV-ipaA gene was synthesized with a six histidine N-terminal tag (Genscript,
Piscataway, NJ, USA) and cloned into the pET21b vector. The genes for LOV-SsrA and
monomeric SspB were synthesized (Genscript) and cloned into pQE-80L and pTriEX4
vinculin D1 subdomain (residues 1–258) and full-length vinculin (residues 1–1066) were cloned into a pET15b vector.
2.3.3 Protein Expression and Purification
LOV-ipaA WT and mutants were expressed in E.coli strain BL21(DE3) cells
(Genese) at 16°C overnight in the dark. Cells were lysed in buffer containing 50 mM sodium phosphate pH 7.5, 150 mM NaCl and 5 mM 2-mercaptoethanol. Proteins were purified by affinity chromatography over HiTrap HisTrap columns (GE) and eluted with 150 mM Imidazole at pH 7.5. The proteins were further purified through size exclusion chromatography over a Sephadex S75 column (GE) equilibrated with 50 mM sodium phosphate, 150 mM NaCl and 5 mM 2-mercaptoethanol. VinculinD1 subdomain was expressed in E.coli strain BL21(DE3) cells (Stratagene) at 16°C overnight. Cells were lysed in buffer containing 50 mM Tris-HCl pH 8.0, 500 mM NaCl and 5 mM 2-mercaptoethanol. The protein was purified by affinity chromatography over HiTrap HisTrap columns (GE) and eluted with 500 mM Imidazole at pH 8.0. The protein was further purified by ion exchange chromatography using a HiTrap Q column (GE) eluted with a NaCl gradient. VinculinD1 was stored in 20 mM Tris-HCl with 2 mm DTT and 2 mM EDTA.
LOV-SsrA and SspB Constructs were expressed in BL21 E.coli cells and induced with 333mM IPTG overnight at 18°C. Proteins were purified through binding Ni-NTA
columns and eluted against an imidazole gradient. Size exclusion chromatography using an S75 column was performed as a final clean-up step and to switch buffer to PBS.
Protein concentrations for LOV-SsraC, LOV-SsraN, Sspb LOV-ipaA and vinculinD1 were determined using Bradford assays (Thermo). Protein concentrations for full-length vinculin were determined using absorbance at 280 nm measurements with an extinction coefficient of 62,000 M-1cm-1.
2.3.4 Peptides
Peptides containing the sequence TANNIIKAAKDATTSLSKVLKNIN,
TANNIIKAAKDATTSASKVLNIN, TANNIIKAAKDATTSLSKALKNIN, QIEEAANDENY, LIKKAANDINYAAK, and HVRDAANDEAYMLIK were synthesized at UNC-Chapel Hill and amine labeled using 5-(and-6)-Carboxytetramethylrhodamine (TAMRA) dye (Anaspec, Fremont, CA, USA). Peptide concentration was determined by measuring absorbance of the TAMRA dye at 555 nm using 65,000 M−1cm−1 extinction coefficient.
2.3.5 Fluorescence Polarization Experiments
All fluorescence polarization experiments were conducted using a Jobin Yvon Horiba FluoroMax3 fluorescence spectrometer. TAMRA-labeled peptides were excited with
decay equation to determine the polarization at time point zero. The fraction of TAMRA-ipaA
bound to vinculin was determined by normalizing each curve using the time point zero as
the calculated 85% bound point and the polarization of TAMRA-ipaA alone as the zero
fraction bound point in the dark. In the light, each curve was normalized with a zero fraction
bound point determined by mixing TAMRA-ipaA and LOV-ipaA at the concentration used in
the titration under blue light and setting the resulting polarization as the zero fraction bound
point. Normalized curves were fit for kon and KD rates using a numerical integration script in
Matlab. Six curves were used per fit, and two fits were averaged for each kinetic
measurement.
Binding of SspB to TAMRA-labeled peptides was performed in a 1cm quartz cuvette
with a starting peptide concentration of 25 nM in PBS at 25°C. Increasing concentrations of
SspB were titrated into the cuvette and polarization was recorded. Binding of LOV-SsrA
designs to SspB was measured through competition with the TAMRA-labeled peptide.
Competition binding experiments began with a solution containing 25 nM labeled peptide
and 40 nM SspB. Titrations of LOV-SsrA designs were exposed to blue light (455nm, 6.0
mW cm-2) for 2 minutes, and polarization readings were taken the instant the light was
switched off. After 5 minutes of darkness, a second polarization reading was taken.
Competition with the peptide-SspB complex allowed for fitting of an IC50 value for the
design and determination of KD according to Nikolovska-Coleska et al.
(Nikolovska-Coleska, et al., 2004). Reversibility of LOV-SsrAC binding to SspB was performed by
repeatedly irradiating the 1.5 µM LOV-SsrA titration point from the competition assay with
blue light (455nm, 6.0 mW cm-2) for 60 seconds and monitoring polarization for 4 minutes.
2.3.6 Illumination
For fluorescence polarization assays, all LOV2-containing proteins were continuously
of 455 nm (ThorLabs, product code LEDC1). The irradiation was directly 10 cm above a
sample chamber of 0.9 cm diameter. Illumination power was measured to be 6.0 mW cm-2 in
the sample holder. For yeast two- hybrid experiments, yeast plates were initially grown using
a set of 50 LED wide angle holiday string lights (Target, 120V, 0.04A) placed in a 41x 46 cm
array 30 cm above the plates, yielding good colony growth. Optimal growth was observed
using an array of 32 blue LED lights (Optek) arranged in series on a 5.5x5.5 cm array
placed 30 cm above the plates. Lights had maximal emission wavelength of 470 nm, and
were operated at 5 V, 0.5 A.
2.3.7 LOV-SsrA Design
Alignments between the SsrA peptide and LOV2 were modeled with the Rosetta
molecular modeling program. The domain assembly protocol was used to assemble the
C-terminally aligned designs. The fixed backbone design protocol was used to explore
mutations within LOV2-SsrA. C-terminal extensions to LOV2-SsrA were modeled using the
floppytail protocol in Rosetta. Designs were sorted by score and the lowest scoring designs
were examined. Monomeric SspB was developed using the fixed backbone design and
ridged-body docking protocols in Rosetta. SspB was confirmed to be a monomer using
SEC-MALS.
2.3.8 LOV-SsrA Thermal Reversion
Photocycle kinetics were determined by monitoring recovery of absorbance at
450nm of 10µM LOV-SsrAC after 60 seconds of irradiation with blue light (455nm, 6.0 mW
cm-2) with and without 20 µM SspB. All measurements were taken at 25oC.
2.3.9 Surface Plasmon Resonance
Surface plasmon resonance experiments were conducted using a Biacore 2000
coupling to the surface of a CM5 chip (GE Healthcare). Different concentrations of LOV-ipaA
mutants were flown over the immobilized protein, and the change in response units over
time was recorded. Data were fit simultaneously for kon and koff to a pseudo-first-order
binding model.
2.3.10 Actin Co-sedimentation Assays
Purified rabbit actin (Invitrogen) was polymerized for 30 min at room temperature in
10 mM Tris-HCl (pH 7.5) containing 100 mM KCl, 2 mM MgCl2, 2 mM DTT, and 1 mM ATP.
Vinculin (2 µM) and either ipaA peptide or LOV-ipaA mutants were mixed for vinculin:ipaA
rations of 1:0, 1:1, 1:2.5, 1:5, 1:10, 1:20, or 1:50 per sample. Polymerized actin (12 µM) was
added to each sample, within a volume of 45 µl per sample. Samples were incubated at
room temperature for 1 hr. They were then centrifuged in a TLA-100 rotor in a Beckman
Coulter Optimax XP ultracentrifuge at an acceleration of 150,000 g for 30 min cooled to
20°C. Samples were split into supernatant and pellet fractions. Pellets were resuspended
into 45 µl 2x tris-glycine SDS buffer. All fractions were denatured and run onto an 8%
SDS-PAGE polyacrylamide gel. Gels were Coomassie stained and analyzed using ImageJ
software to determine the fraction of vinculin present in the pellet versus total vinculin in
each sample112.
2.3.11 Analysis of Actin Co-sedimentation Assays
Apparent binding affinity of ipaA or LOV-ipaA to vinculin was determined by plotting
the fraction of vinculin bound to actin versus concentration of LOV-ipaA and fitting the curve
to the equation below using Prism software. A total of 3 gels were quantified and averaged
for each binding affinity measurement.
Where F is the fraction of vinculin bound to actin in the pellet, a is the minimum
fraction bound, b is the plateau for fraction bound (set to 0.39), K is the binding affinity, X0 is
the concentration of ipaA or LOV- ipaA added to the reaction, and V0 is concentration of
vinculin in the reaction (set to 2 mM).
2.3.12 Isothermal Calorimetry Binding Experiments
All ITC experiments were performed at UNC Chapel Hill in the Macromolecular
Interaction Facility using a MicroCal Auto ITC200. Purified LOV-ipaA L623A lit state (I532E
A536E), dark state (C450A) mimetics, and vinculinD1 were dialyzed for four hours in 50 mM
sodium phosphate, 150 mM NaCl and 5 mM 2-mercaptoethanol buffer.
2.3.13 Initial LOV-ipaA competition inhibition measurements
The binding affinity of synthesized TAMRA labeled ipaA peptide to vinculinD1 was
determined by titrating increasing concentrations of vinculinD1 into 2 nM TAMRA labeled
ipaA peptide and measuring fluorescence polarization at the emission wavelength of
TAMRA, 583 nm. The curve was fit using a one site binding model in Sigma Plot software.
The off rate of TAMRA labeled ipaA peptide binding to vinculinD1 was determined by using
50 nM TAMRA ipaA peptide 85% bound to vinculinD1 in a 0.3 cm path length cuvette. A
30-fold excess of unlabeled ipaA peptide was then added to the reaction. The reaction was
allowed to proceed for 3 hours at 25°C, with polarization of TAMRA dye emission measured
at intervals of 5 min and was fit to a one phase exponential decay equation to determine the
first order rate constant.
2.3.14 Structural Software and Data Presentation Methods
All model and crystal structure figures were made using Pymol. All gel images were
taken using a Kodak GelLogic 100 imaging system and slightly adjusted for optimal
plates were scanned using an HP ScanJet 4850 scanner and resulting images were
cropped of whitespace using Adobe Photoshop.
2.3.15 Yeast Two-Hybrid Assays
LOV-ipaA L623A WT, lit-state mutants, dark-state mutants, and ipaA were cloned
into a pGADT7 vector and transformed into S. cerevisiae Y187 strain, whereas the vinculin
D1 subdomain was cloned into a pGBKT7 vector and transformed
into S. cerevisiae Y2Hgold strain (Clontech, Mountain View, CA, USA). Empty vectors were
also transformed into the appropriate strains. Transformed colonies of Y2Hgold and Y187
were mated at 30°C overnight and plated on synthetic dextrose (SD) –Leu –Trp media. For
yeast two-hybrid experiments, mated colonies were serially diluted (1:5, from right to left on
plates shown) and replica plated onto SD –Leu –Trp media; SD –Leu –Trp media with
auerobasidin A and 5-bromo-4-chloro-3-indolyl-α-D-gactopyranoside (x-α-gal); SD –Leu –
Trp –His media with auerobasidin A and x-α-gal; and SD –Leu –Trp –His –Ade media with
auerobasidin A and x-α-gal. Plates were grown for three days at 30°C. For Miller assays,
mated colonies were picked and grown to saturation in SD –Leu –Trp media. Saturated
colonies were diluted to low-log phase and grown for 4 hr under dark or blue light conditions.
Cells were lysed open and treated with chlorophenol red-β-D-galactopyranoside (CPRG;
Roche) substrate to determine β-galactosidase activity in Miller units46.
2.4 Results
2.4.1 Identifying Peptides Compatible with AsLOV2 Caging
To identify protein binding peptides well suited for caging with the AsLOV2 domain,
we searched the protein database (PDB) for peptide sequences similar to portions of the Jα
helix. The similarity score for each position in the alignment was weighted based on how