MICROBIAL ECOLOGY OF A MANMADE OIL SPILL IN THE GULF OF MEXICO AND A NATURAL, HYDROTHERMAL OIL SEEP IN THE GULF OF CALIFORNIA
Luke Justin McKay
A dissertation submitted to the faculty of the University of North Carolina at Chapel Hill in partial fulfillment of the requirements for the degree of
Doctor of Philosophy in the Department of Marine Sciences.
Chapel Hill 2014
Approved by: Andreas Teske
Barbara MacGregor Carol Arnosti
© 2014 Luke Justin McKay
ABSTRACT
Luke Justin McKay: Microbial Ecology of a Manmade Oil Spill in the Gulf of Mexico and a
Natural, Hydrothermal Oil Seep in the Gulf of California (Under the direction of Andreas P. Teske)
Members of the Marinobacter genus play an important role in hydrocarbon degradation in the ocean – a topic of special significance in light of the recent Deepwater Horizon oil spill of 2010. The Marinobacter group has thus far lacked a genus level phylogenetic probe that would allow in situ identification of representative members. Here, two new 16S rRNA-targeted oligonucleotide probes (Mrb-0625-a and Mrb-0625-b) were developed to enumerate
The next sections of this dissertation focus on the hydrothermally active sediments at Guaymas Basin, which show a wide range of shallow subsurface temperatures: from 3°C to 200°C in the first 45 cm depth. A combination of extreme thermal gradients and compressed geochemical and metabolic zones limits the depth range of microbial colonization in Guaymas sediments. Using stable carbon isotopic values for methane and dissolved inorganic carbon compared to associated temperatures the upper thermal limits for the anaerobic oxidation of methane and organic carbon remineralization in Guaymas sediments are suggested to be 80oC and 100oC, respectively. At higher temperatures the isotopic imprints of these microbially mediated processes cannot be detected. Additionally, 16S rRNA gene clone libraries demonstrate differential biogeographical zonation patterns for archaea versus bacteria, with archaeal community structure being more heavily influenced by hydrothermal regimes. Chloroflexi and Deltaproteobacteria dominated the bacterial clone libraries, and anaerobic methane-oxidizing (ANME) archaea represented nearly half of the total archaeal clone library. Thermal zonation of ANME archaeal subgroups is strong: ANME-2c is restricted to low
temperature sediments (<25oC), ANME-1 is dominant at warmer temperatures, and the ANME-1 Guaymas archaea appear to have access to the deepest and hottest sediment horizons up to approximately 80oC.
In the last chapter of this dissertation, microbial life at extreme temperatures was investigated further by RNA-based methodologies. Using push core samples collected by the Alvin submarine at four high temperature sites with 40-cmsbf thermal maxima ranging from
100°C to 185°C, the composition of the active microbial community and its possible influence
on carbon and sulfur cycling was investigated. Here, evidence is presented indicating that
with average in situ temperatures between 70°C and 95°C, where temperatures may vary by
25°C in as little as a day. Strong microbially mediated sulfate reduction is implicated by sharp
decreases in porewater sulfate within the upper 15 cm of all four high temperature cores, while
stable isotopic evidence of methane oxidation is only expressed in a single core. Archaeal
sequence recovery was greater than bacterial sequence recovery in six out of eight samples from
the four cores, but bacterial sequence recovery was particularly strong for a single core, yielding
35% of the total archaeal and bacterial recovery from all samples. Although putative anaerobic
methane oxidizing (ANME) archaea were very common, distinct cores hosted diverse and
distinct sequence assemblages, including ANME-1 Guaymas, ANME-2c, and ANME-2d/GoM
Arc-1/Methanoperedenaceae. Dominant bacterial groups fell within the
Thermodesulfobacteriaceae family in the Thermodesulfobacteria phylum, the
Helicobacteriaceae family in the subphylum Epsilonproteobacteria, or were close relatives of
Desulfocapsaexigens in the subphylum Deltaproteobacteria. The most probable thermo- or
hyperthermophilic groups were investigated by co-occurrence of OTUs across the four hottest
samples within the sediment cores and appear to be ANME-1 Guaymas and an uncultured
representative of the Miscellaneous Crenarchaeotal Group (MCG)-15 for archaea, and members
ACKNOWLEDGEMENTS
I would like to express the utmost gratitude for guidance and support provided by my advisor, Andreas Teske. This work would not have been possible without technical
contributions by Vincent Klokman, Tony Gutierrez, Howard Mendlovitz, Barbara MacGregor, Daniel Albert, Daniel Hoer, Andrea Hale, Douglas LaRowe, and Dirk de Beer. Howard
TABLE OF CONTENTS
LIST OF TABLES... xi
LIST OF FIGURES... xii
CHAPTER I. DEVELOPMENT OF A GROUP-SPECIFIC 16S rRNA-TARGETED PROBE SET FOR THE IDENTIFICATION OF MARINOBACTER BY FLUORESCENCE IN SITU HYBRIDIZATION... 1
Introduction... 1
Sampling Procedure and Methodology... 3
Oligonucleotide probe design... 3
Oligonucleotide probe optimization...4
Sample collection... 5
Marinobacter enrichment setup...5
FISH analysis of Marinobacter enrichment... 6
Results and Discussion...7
Marinobacter phylogeny and probe coverage... 7
Probe optimization and formamide series...9
Marinobacter spp. response to oil-contaminated seawater...14
Trophic cascading by marine hydrocarbon degraders...19
II. THERMAL AND GEOCHEMICAL ZONATION OF MICROBIAL BIOGEOGRAPHY IN GUAYMAS BASIN HYDROTHERMAL
SEDIMENTS... 22
Introduction... 22
Methods...23
Temperature measurements... 23
Sediment sampling and site locations... 23
Porewater geochemistry... 24
16S rRNA gene sequencing and analysis... 24
Calculations of thermodynamic potential of the anaerobic oxidation of methane... 25
Results... 26
Bulk comparisons of temperature and porewater carbonchemistry... 26
Physicochemical descriptions of individual cores... 30
Sediment core 4569-9... 31
Sediment core 4569-2... 31
Sediment core 4569-4... 32
Sediment core 4571-4... 32
Sediment core 4567-28... 33
16S rRNA gene clone library data... 33
Discussion... 39
Synthesis and Conclusions... 55
III. ACTIVE MICROBIAL LIFE IN HIGH TEMPERATURE GUAYMAS BASIN SEDIMENTS... 57
Materials and Methods... 59
Core and temperature sampling...59
Sample preparation and measurement of carbon and sulfur geochemistry... 60
RNA extraction, processing, and reverse transcription PCR (rtPCR)...60
454-pyrosequencing and analysis...61
Results and Discussion...62
Thermal and geochemical structure of sediment cores... 62
Examination of alpha and beta diversity... 66
Archaeal and bacterial richness versus temperature and electron acceptor availability...70
Temperature ranges and thermal fluctuations... 71
16S rRNA sequence recovery and taxonomic classifications... 75
RNA recovery at increasing temperatures and identification of probable thermophiles... 86
Conclusion... 89
APPENDIX... 90
LIST OF TABLES
Table
LIST OF FIGURES
Figure 1 – Small subunit 16S rRNA phylogeny of Marinobacter species... 9 Figure 2 – Dissociation profiles of oligonucleotide probes... 11 Figure 3 – Epifluorescence micrographs of probe-conferred fluorescence
during the optimization of the Marinobacter probes... 13 Figure 4 – Epifluorescence micrographs of probe-conferred fluorescence
during a Marinobacter enrichment experiment... 15 Figure 5 – Cell abundances of Marinobacter species and the overall microbial
community during the enrichment experiment... 19 Figure 6 – Shallow subsurface sediment temperature profiles from 113 sites in
Guaymas Basin... 27 Figure 7 – Concentrations and stable isotopic values of methane and DIC
compared to in situ temperatures of Guaymas Basin sediments...29 Figure 8 – Shallow subsurface thermal and geochemical profiles from five
distinct sites in Guaymas Basin...31 Figure 9 – Archaeal and bacterial clone library distributions from five distinct
sites in Guaymas Basin... 36 Figure 10 – Small subunit 16S rRNA phylogeny of ANME-related archaea
and putative sulfur cycling bacteria... 39 Figure 11 – Thermodynamic potentials for the process of sulfate dependent
AOM in shallow Guaymas sediments...46 Figure 12 – Principle components analyses of archaeal and
bacterial beta diversity... 55 Figure 13 – Shallow subsurface thermal and geochemical profiles
from four distinct high temperature sites in Guaymas Basin... 63 Figure 14 – Rarefaction and principle components analyses of
454-pyrosequencing data...67 Figure 15 – Comparisons of thermal and geochemical controls on
Figure 16 – Thermal structure of shallow Guaymas Basin sediments over eight days and minimum, maximum, and mean temperatures
experienced by the sediment layer corresponding to sample P3...73 Figure 17 – Pyrosequencing recovery distribution of archaeal and bacterial
species... 77 Figure 18 – Small subunit 16S rRNA phylogeny of ANME-related archaea,
Deltaproteobacteria, and Epsilonproteobacteria... 82 Figure 19 – OTU network of high temperature samples and 16S phylogeny
LIST OF ABBREVIATIONS
FISH – fluorescence in situ hybridization sp. – species (singular)
spp. – species (plural)
PBS – phosphate buffered saline PFA – paraformaldehyde
FITC – fluorescein isothiocyanate TRITC – rhodamine isothiocyanate CY3 – cyanine 3 dye
6FAM – 6-Carboxyfluorescein
DAPI – 4',6-diamidino-2-phenylindole cmbsf – centimeters below seafloor PCR – polymerase chain reaction RT – reverse transcription
ANME – anaerobic methanotroph AOM – anaerobic oxidation of methane OMR – organic matter remineralization DIC – dissolved inorganic carbon
MCG – miscellaneous Crenarchaeotal group MBGB – Marine Benthic Group B
DHVE-6 – Deep Hydrothermal Vent Euryarchaeota Group 6 DSEG – Deep Sea Euryarchaeotal Group
SAGMEG – South African Gold Mine Euryarchaeotal Group JS1 – Japan Seep 1
CHAPTER 1: DEVELOPMENT OF A GROUP-SPECIFIC 16S rRNA-TARGETED PROBE SET FOR THE IDENTIFICATION OF MARINOBACTER BY
FLUORESCENCE IN SITU HYBRIDIZATION1 Introduction
The ability of marine ecosystems to recuperate from oil pollution is largely dependent on the activities of indigenous communities of hydrocarbon-degrading bacteria, which often varies depending on the ecosystem in question. For example, contaminants from the Deepwater Horizon oil spill have affected several marine ecosystems, including the deep water column (Diercks et al., 2010), coastal waters and beaches (Graham et al., 2010; Hayworth et al., 2011), salt marshes (Silliman et al., 2012), and deep sea sediments (Liu et al., 2012). Initial microbial analyses following the Macondo wellhead blowout have shown diverse microbial phylotypes associated with distinct sites of oil contamination. Members of the Oceanospirillales and the genus Halomonas were dominant in the deep sea hydrocarbon plume (Hazen et al., 2011), Firmicutes and Alphaproteobacteria in open ocean surface slicks (Redmond et al., 2011), and Alcanivorax, Marinobacter, and Rhodobacteracaeae spp. were dominant in coastal beaches (Kostka et al., 2011). Detecting and identifying microbial communities across different habitats is integral to the assessment of the microbial degradation of oil contaminants in the marine environment.
1 This chapter was previously published as an article in Deep Sea Research Part II: Topical Studies in
Oceanography. The original citation is as follows: McKay L, Gutierrez T, Teske A. “Development of a Group-Specific 16S rRNA-Targeted Probe Set for the Identification of Marinobacter by Fluorescence In Situ
Methods to identify and monitor the abundance of hydrocarbon-degrading
influences of distinct Marinobacter subgroups. These probes were then used to assess the abundance of Marinobacter within the overall microbial community over time following an input of hydrocarbon similar to contamination that occurred during the Deepwater Horizon oil spill.
Sampling Procedures and Methodology Oligonucleotide probe design
Oligonucleotide probe optimization
Pure cultures of Marinobacter algicola (DSM 16394), Marinobacter flavimarus (DSM 16070) and Marinobacter zhanjiangensis (KCTC 22280) were used in a preliminary test of the FISH probes at 0% and 10% formamide concentrations, and then M. algicola and M.
zhanjiangensis were used in the optimization of formamide stringency. The strains were grown without hydrocarbons on a marine broth (ZM/10) composed of ¾-strength naturally aged seawater, peptone (0.05%), yeast extract (0.01%), and supplemented after steam-sterilization with filter-sterile (0.2 µm) trace elements and vitamins to final concentrations as previously described (Blackburn et al., 1989). For fixation three volumes of 4% (v/v) paraformaldehyde solution in 1x phosphate buffer saline (PBS; 130 mM NaCl, 2 mM NaH2PO4, 8 mM Na2HPO4, pH 7.4) were mixed with one volume of exponentially-grown cells and incubated for 3 h at 4°C. After three washings with 1x PBS, the samples were stored in a 1:1 (v/v) solution of 1x PBS and ethanol at -20°C.
Initial hybridizations with pure bacterial cultures and the newly-designed probes were performed using formamide (FA) concentrations of 0% and 10% in order to confirm
permeability of the cells to the probes and adequate signal intensity. Optimal conditions for hybridization with these probes were determined by multiple hybridizations using increasing FA concentrations from 0% to 70%. Because the two probe sequences differ by only one nucleotide and target the same binding site, they were used simultaneously in competitive hybridization experiments. M. algicola was used as the reference strain for Mrb-0625-a and as the single mismatch non-target strain for Mrb-0625-b, whereas M. zhanjiangensis was used as the reference strain for Mrb-0625-b and as the single mismatch non-target strain for Mrb-0625-a.
epifluorescence microscope (Tokyo, Japan) equipped with a Hamamatsu C8484 digital camera (Hamamatsu City, Japan). Probe-conferred signal intensities were quantified with MetaMorph image analysis software version 7.6.0.0 (Sunnyvale, CA, USA).
Sample collection
During a research cruise on the R/V Walton Smith (May 26 to June 8, 2010), seawater samples from 1000-1250 m depth were collected by CTD rosette sampler within 1-7 miles from the Macondo wellhead in the Gulf of Mexico. Some of these CTD deployments recovered samples from a deepwater hydrocarbon plume that had formed early during the spill and was marked by localized oxygen depletion and an increase in colored dissolved organic matter which was indicative of the presence of petrochemical hydrocarbons and elevated microbial activities from hydrocarbon oxidation (Diercks et al., 2010; Joye et al., 2011; Yang et al., 2012—ASLO talk). Upon collection, live plume samples were stored at 4°C for 15 months until they were used as the inoculum for enrichment experiments with and without n-hexadecane to evaluate the FISH protocol described below.
Marinobacter enrichment setup
rpm) at 27°C, which falls within the optimum growth temperature range (25 – 30°C) for most Marinobacter (Duran, 2010). Fixation of subsamples (100 µl) was performed by mixing with 300 µl of 4% (v/v) paraformaldehyde and incubating at 4°C for 3 hrs. Cells were collected by centrifugation (15,000 x g; 5 min), mixed with ice-cold 1X PBS and ethanol (1:1), and then stored at -20°C.
FISH analysis of Marinobacter enrichment
Subsamples from the time-series incubation were diluted (500- to 1000-fold) in 1X PBS and then filtered onto 0.22 µm polycarbonate filters (25 mm, Millipore GTTP). FISH was performed directly on filter sections according to previous protocols (Glöckner et al., 1996; Loy et al., 2005; Pernthaler et al., 2001). Probe GAM42a was included in some hybridizations to quantify the abundance of Marinobacter against all Gammaproteobacteria. Since hybridization with GAM42a employs more stringent conditions (i.e. a higher FA concentration) (Manz et al., 1992) than that with Mrb-0625-a, a double hybridization assay was performed with GAM42a first. All hybridizations were counterstained with 4’,6-diamidino-2-phenylindole (DAPI) following standard methods (Porter and Feig, 1980) prior to visualization under the
epifluorescence microscope. Eight to twelve random fields of view were counted for all time points except time point 1, for which 5 fields of view were counted.
Results and Discussion
Marinobacter phylogeny and probe coverage
Figure 1. Small subunit ribosomal RNA (16S rRNA) phylogeny of members of the gammaproteobacterial marine hydrocarbon-degrading genus Marinobacter and six other hydrocarbon-degrading Gammaproteobacteria. Of the 659 Marinobacter species in the current 16S Silva database, 27 cultured representatives were chosen to demonstrate the overall diversity of the genus as well as approximate percent coverage by the oligonucleotide probes. Type strains are indicated by T. Strains with known hydrocarbon-degrading capabilities are shown in bold (summarized by Duran, 2010) while species marked with Σ were not able to growth on n-tetradecane or crude oil (Guo et al., 2007). Roseobacter litoralis (X78312) was used as the outgroup. The species used to test and optimize the probes, Marinobacter algicola and Marinobacter zhanjiangensis, are indicated by asterisks. Mrb-0625-c is a suggested third probe that targets an additional 13% of the Marinobacter group not covered by Mrb-0625-a and Mrb-0625-b, but was not empirically evaluated in this study.
Probe optimization and formamide series
The melting curves for probes Mrb-0625-a and Mrb-0625-b when used in hybridizations with target and non-target reference strains and in the absence and presence of each other are shown in figure 2. In all experiments fluorescence intensity was greater for target strains compared to non-target strains (with a 1-bp mismatch), demonstrating strong probe specificity. Empirically optimized FA concentrations ensured specificity during hybridization with these probes (Table 1). In the case of probe Mrb-0625-a, fluorescence signal intensities decreased significantly at FA concentrations above 20%, indicating that this concentration would be suitable for hybridizations with this probe to specifically detect up to 75% of members that comprise the Marinobacter group. With Mrb-0625-b, fluorescence signal intensities did not decrease as sharply at FA concentrations above 20%, though were highest at 20-25% FA
Figure 2. Dissociation profiles of 16S rRNA-targeted FISH probes 0625-a and Mrb-0625-b evaluated against a perfectly-matching (target) and one basepair-mismatching (non-target) strain. Black diamonds represent hybridization intensities for M. algicola; white squares correspond to hybridization intensities for M. zhangjiangensis. In two separate experiments Mrb-0625-a was hybridized with its target strain, M. algicola, and with its single base pair mismatch strain, M. zhanjiangensis (A). In two separate experiments Mrb-0625-b was hybridized with its target strain, M. zhanjiangensis, and with its single base pair mismatch strain, M. algicola (B). In additional experiments both probes were used together as competitors for the same 16S rRNA motif on both target strains. Dissociation curves are shown for 0625-a hybridized to its target and non-target strain in the presence of Mrb-0625-b (C), and for Mrb-Mrb-0625-b hybridized to its target and non-target strain in the presence of Mrb-0625-a (D). Each data point represents the average fluorescence intensity value ± standard deviation from ten randomly-selected fields of view. Mrb-0625-a is labeled with 6FAM, and Mrb-0625-b is labeled with CY3 in all experiments. Linear interpolation was excluded for M. zhanjiangensis in C and M. algicola in D to denote lower resolution in formamide concentration changes.
Two additional FA series experiments were conducted to optimize using both probes together in the same hybridization. In one of these experiments, 6FAM-labeled Mrb-0625-a and CY3-labeled Mrb-0625-b were applied together with M. algicola, while in the other experiment both probes were applied together with M. zhanjiangensis. The melting curves for 6FAM-labeled Mrb-0625-a hybridized with target strain M. algicola and with non-target strain M.
zhanjiangensis show that the signal intensity of the M. algicola cells at 25% FA concentration is clearly distinguishable from the non-target fluorescence of M. zhanjiangensis (Fig. 2C).
Conversely, fluorescence during hybridization of CY3-labeled probe Mrb-0625-b to target strain M. zhanjiangensis and non-target strain M. algicola resulted in distinguishable signals between target and non-target fluorescence within a range from 15% to at least 40% FA, while non-target fluorescence was greatly reduced in the competitive hybridization (Figure 2D). Competitive interference by Mrb-0625-a is not likely beyond 35% FA, since Mrb-0625-a targeted
fluorescence is greatly diminished at greater FA concentrations (Figure 2A, C). As a result, Mrb-0625-b shows a gradual decay of fluorescence signal (Figure 2D) not unlike the previous
together in the same hybridization reaction, a common stringency of 25% FA is recommended for the simultaneous detection of their target Marinobacter species.
The competitive use of alternately labeled Mrb-0625-a and Mrb-0625-b at their empirically-determined optimal FA concentration of 25% was then tested with a mixed population of M. algicola and M. zhanjiangensis (Figure 3). Consistent with the FA series results from Figure 2, the two Marinobacter reference strains could be clearly distinguished from one another. Since an overlay of figures 3A (showing Mrb-0625-a targeted signals) and 3B (showing Mrb-0625-b targeted signals) did not yield any double-labeled cells that were orange or yellow, but rather that were either distinctly green or distinctly red (Figure 3C), non-target
binding is interpreted as negligible and the probes appear to be highly specific for their
Table 1. According to the standard nomenclature for the naming of new probes (Alm et al., 1996), official names of probes Mrb-0625-a, Mrb-0625-b, Mrb-0625-c and Hal-0625-a are S-G-Mrb_0625-a-A-21, S-G-Mrb_0625-b-A-21, S-G-Mrb_0625-c-A-21, and S-G-Hal_0625-a-A-21, respectively. Also indicated are percent genus coverage, representative strains and accession numbers, 5’-3’ sequences for each probe, and optimal FA concentrations for hybridization. Sequence mismatches between probes are indicated in white lettering. Mrb-0625-c is a suggested third probe that targets an additional 13% of the Marinobacter group not covered by Mrb-0625-a and Mrb-0625-b is also included in this table, but was not empirically evaluated in this study.
Marinobacter spp. response to oil-contaminated seawater
A microbial enrichment with plume water samples obtained from 1000-1250 m depth in the Gulf of Mexico during the Deepwater Horizon oil spill was characterized with the
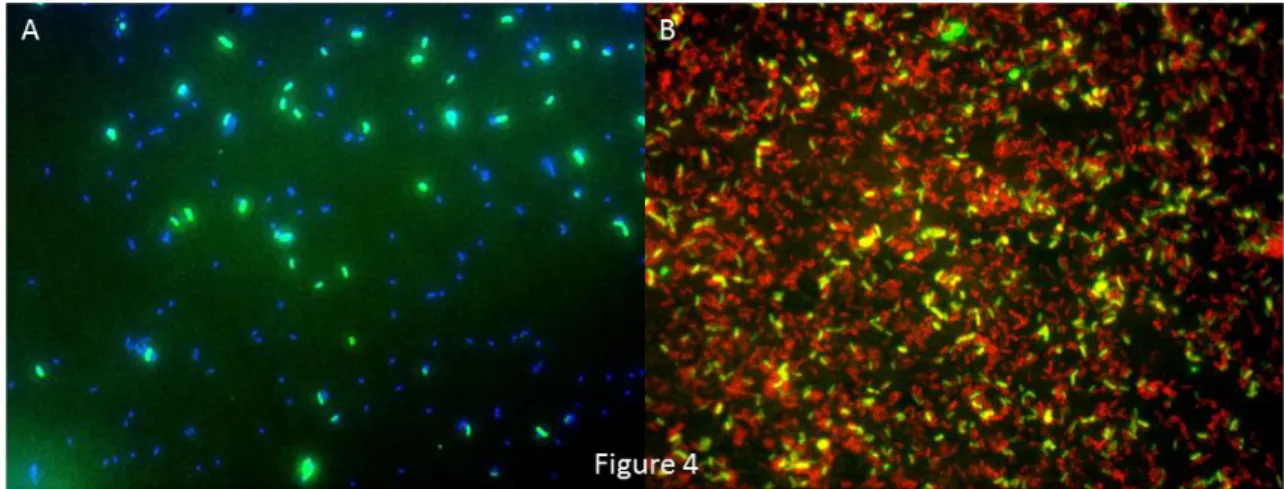
cultures (25 – 30°C, Duran, 2010). After enrichment with n-hexadecane, subsamples taken during this experiment were analyzed using probes Mrb-0625-a and Mrb-0625-b to provide information on the detection and abundance of Marinobacter. Hybridizations with 6FAM-labeled Mrb-0625-a revealed that a substantial fraction (e.g., ca. 30% in vial 1, day 3) of the entire DAPI-stained microbial population in the plume water inoculum was composed of Marinobacter species (Figure 4A; Table 2). Samples taken from these experiments and
hybridized with the Mrb-0625-b probe did not yield any signals (results not shown). Therefore, the Marinobacter population in this enrichment was quantified using only the Mrb-0625-a probe (discussed below). Hazen and colleagues (2010) showed that Halomonas spp. were significantly enriched in plume waters during the Deepwater Horizon oil spill – by as much as 140%
compared to their abundance in non-plume water samples. In order to block false positive Mrb-0625-a hybridization to halomonads, FISH experiments with this probe included the unlabeled Hal-0625-a competitor probe (Table 1) which shares 100% sequence homology to halomonads with a 1 base pair mismatch at the 16S rRNA region targeted by Mrb-0625-a.
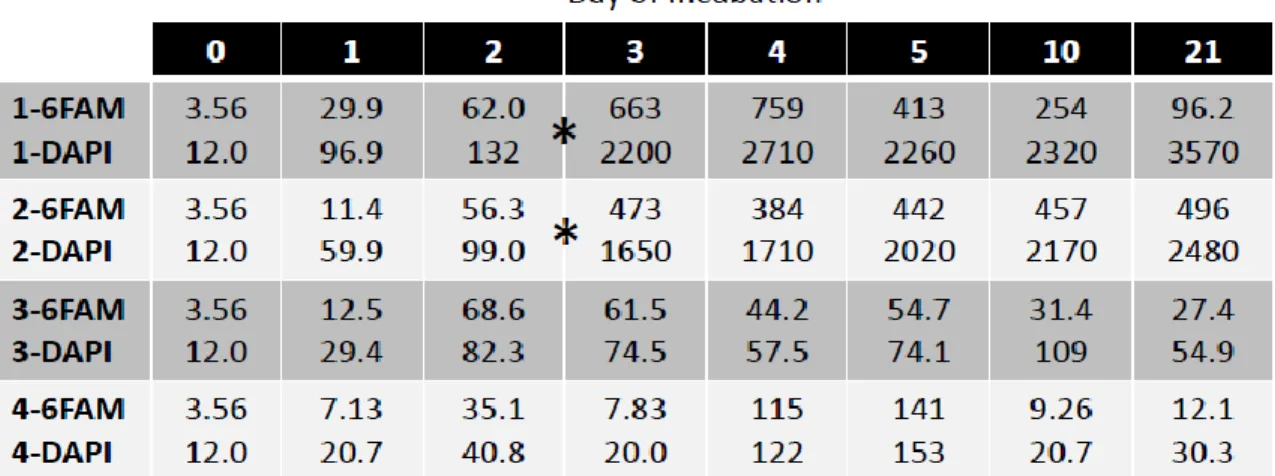
Table 2. Microbial cell counts show changes in total microbial abundance and the corresponding fraction of Marinobacter spp. abundance in each vial over the 21 day time course. Values are in 106 cells ml-1. The first row indicates the day of incubation and the first column indicates the vial # and either DAPI, for total microbial community, or 6FAM, for Mrb-0625-a conferred fluorescence. Asterisks demarcate spikes in microbial abundance in vials 1 and 2 between days 2 and 3, concomitant with noticeable changes in turbidity (Supplementary Figure S1). Cell counts from time zero are identical for all vials because they were performed only once on the original inoculum prior to incubation. Vials 1 and 2 were amended with 4% n-hexadecane; vials 3 and 4 were not.
It should be noted that the identification of organisms using FISH that employs a probe(s) targeting only a single binding site is not always sufficiently robust. Since no other realistic combination of comprehensive genus-level Marinobacter probes could be developed, a double hybridization with the class-level, cy3-labeled GAM42a probe and unlabeled BET42a as competitor (Manz et al., 1992) was performed on selected samples from the plume water enrichment experiment. FISH analysis of a sample taken from vial 2 at day 4 hybridized with 6FAM-labeled Mrb-0625-a and CY3-labeled GAM42a showed that Marinobacter cells targeted by Mrb-0625-a represented 30% of the gammaproteobacterial population (Figure 4B).
Marinobacter cells in yellow due to Mrb-0265-a fluorescence in green and GAM42a fluorescence in red.
The abundance of Marinobacter cells quantified with probe Mrb-0625-a had markedly increased as a result of enrichment with n-hexadecane (Figure 5A) compared to the untreated (i.e. no added n-hexadecane) controls (Figure 5B). The most dramatic increase (ca. 1 order of magnitude) in abundance occurred between days 2 and 3 and coincided with a significant increase (ca. 1.5 order of magnitude) in the total bacterial population detected by DAPI counts. This was consistent with the observation of an increase in the turbidity of the culture liquid of vials 1 and 2 (amended with n-hexadecane) occurring during this time (Supplementary Figure S1). Bacterial abundance remained elevated in the n-hexadecane-amended incubations, reaching approximately 3.0 x 10⁹ cells ml-1 by the termination of these experiments at day 21. From day 3 to day 21 the Marinobacter fraction of the total microbial population had steadily decreased from 30%±5% to 2.7%±0.8% in vial 1, and from 29%±6% to 20%±5% in vial 2. Given the relatively rapid growth of the total microbial community (increase in cell count by a factor of 15)
Figure 5. Absolute DAPI-stained (white and grey) and Mrb-0625-a-targeted (grey only) cell numbers throughout the time course of the enrichment experiment. All experiments were performed in parallel in two sets of duplicate vials (Vials 1 and 2; Vials 3 and 4); DAPI and FISH counts for these duplicated assays are plotted separately in two neighboring columns for all time points to show the variability of the microbial growth and enrichment patterns among replicate vials. (A) Average cell numbers for hexadecane-amended vial 1 (lefthand column) and vial 2 (right-hand column) from days 0, 1, 2, 3, 4, 5, 10, and 21 of the enrichment. (B) Average cell numbers for non-hexadecane-amended vial 3 (left-hand column) and vial 4 (right-hand column) from days 0, 1, 2, 3, 4, 5, 10, and 21 of the enrichment. Error bars represent standard deviation from mean cell counts. The x-axis is abbreviated between days 5 and 10 and between days 10 and 21.
Trophic cascading by marine hydrocarbon degraders
Although the enrichment experiment had the primary objective of testing the newly designed Marinobacter probe set, the data offers some insight into the dynamics of marine hydrocarbon degradation. The overall increase in the bacterial population and relative decrease in Marinobacter after the observable microbial response to n-hexadecane on day three (Fig. 5A) suggests a trophic cascade of distinct microorganisms that participated in the degradation of the n-hexadecane, and possibly also of other hydrocarbons that were inherently present in the plume water inoculum. A community-level collaboration and succession of different microbial groups is not atypical following an oil spill in marine waters (Head et al., 2006; Yakimov et al. 2007). Initial degradation of the n-hexadecane by Marinobacter and other unknown bacteria in these enrichments may have yielded intermediates that fueled the growth of secondary degraders. Such a trophic cascade may in part explain the changes in the microbial community composition of the deep oil plume from the Deepwater Horizon spill which have been observed by different
researchers (Redmond and Valentine 2012; Kessler et al. 2011; Yang et al., in review).
vials (Table 2; Supplementary Figure S2). Interestingly, Marinobacter appeared to represent the dominant fraction of the lower-density total microbial community in non-amended incubations – ca. 40% by day 1, then peaking at 83%±9% in vial 3 and 94%±6% in vial 4 by days 2 and 4 before dropping back down to ca. 40-50% by day 21. This is not implausible when considering that C16 hydrocarbons (like hexadecane) were found to constitute a significant fraction (2nd and 4th highest) of the total C10 to C35 presence in two deep sea plume water samples (Wade et al., 2011). Hence, low-density pre-enrichment of Marinobacter in the deep water plume inoculum was likely attributed to the endogenous presence of these types of hydrocarbons and to
Marinobacter seed populations that responded well to sample containment. Prolonged bottle storage for 15 months might also have had an effect; bottle incubation of marine water samples resulted in elevated transcription within the Alteromonadales order, which includes the
Marinobacter genus (Stewart et al., 2012). Conclusion
16S rRNA oligonucleotide probes targeting an important group of hydrocarbon-degrading and micro-algal associated bacteria, the Marinobacter, provide a useful tool with which to study the occurrence and ecological response of these organisms during major
detailed analysis on the dynamics of Marinobacter subgroups in the environment. Furthermore, the new probe set provides a useful expansion to the current collection of oligonucleotide probes by allowing in situ identification of microbial groups contributing to important metabolic
CHAPTER 2: THERMAL AND GEOCHEMICAL ZONATION OF MICROBIAL BIOGEOGRAPHY IN GUAYMAS BASIN HYDROTHERMAL SEDIMENTS
Introduction
The Gulf of California is a young, expanding ocean as the North American and Pacific plates diverge via a system of narrow spreading zones interspersed by extended transform faults (Lizarralde et al., 2007). At a depth of 2000 m in the center of this Gulf lies Guaymas Basin, where a hydrothermal spreading center is buried by up to 400 meters of organic-rich sediments. Fresh magmatic sills intrude into the thick sediment layer squeezing hot, chemically altered fluids through fissures upwards toward the seafloor (Einsele et al., 1980). Thermocatalytic transformation of freshly deposited organic matter results in a hydrocarbon-rich sedimentary environment. From above, the cold, oxygenated bottom water mixes and circulates with arriving hydrothermal fluids, creating steep physicochemical gradients in the surficial sediments
(Gundersen et al. 1992). The shallow subsurface microbial community at Guaymas Basin takes advantage of this wide thermal and substrate diversity, and similarly diverse microbial processes characterize the upper sediments, including microbial methanogenesis, anaerobic methane oxidation, sulfate reduction and sulfide oxidation (Teske et al., 2003).
least thermotolerant ANME archaea at Guaymas Basin (Holler et al., 2011; Biddle et al., 2012). In the absence of a pure culture of ANME archaea, the possibility of in situ thermal structuring of ANME subgroups was explored. Particular focus was given to the influence of temperature and chemistry on local microbial biogeography, with an emphasis on microorganisms involved in sulfate reduction and AOM.
Methods
Temperature measurements
Shallow subsurface temperature profiles were acquired from the upper 40 to 50 cm of sediment at 113 distinct sites by high temperature and heat flow probes operated by HOV Alvin as described previously (McKay et al., 2012).
Sediment sampling and site locations
Guaymas Basin sediment was retrieved in 30 to 45 cm push cores by the Alvin
retrieved from a site with no visible hydrothermal activity located at 27° 00.542063N, 111° 24.488767W.
Porewater geochemistry
Sediment samples were taken for methane measurements by adding 5.0 ml of sediment from each depth horizon into a 30 ml serum vial, adding 2.0 ml of NaOH, mixing well, and storing upside down at -20°C until laboratory analysis at the University of North Carolina at Chapel Hill. For DIC, sulfate, and sulfide analysis, porewater was extracted from the remaining sediment by centrifugation in 50 ml conical tubes and subsequent filtration through 0.45 µm nylon syringe tip filters. DIC samples were taken as 2.0-3.0 ml aliquots in 30 ml serum vials and stored upside down at -20°C until analysis at UNC. Concentration and stable isotopic values of DIC and methane were measured at UNC by a Hewlett Packard 5890 Gas Chromatograph coupled to a Finnigan Mat 252 Isotope Ratio Mass Spectrometer. Sulfate measurements were performed shipboard by acidifying 1.0 ml porewater samples with 50% HCl, bubbling with nitrogen for four minutes, and running the samples through a 2010i Dionex ion chromatograph (Sunnyvale, CA), as described previously (Martens et al., 1999). Spectrophotometric analysis of porewater for sulfide concentrations was performed shipboard (Cline, 1969). It should be noted that sediment samples were not retrieved in pressurized vessels, and outgassing of CH4, DIC, and ΣH2S was possible.
16S rRNA gene sequencing and analysis
for Bacteria with primers BAC8F-BAC1492R (Teske et al., 2002). The PCR amplification was checked by gel electrophoresis on 1.5% agarose gel, and bands of amplified DNA were extracted from the gel using the Wizard SV Gel and PCR Cleanup System (Madison, WI). Following gel cleanup, amplified DNA was transformed into vectors and cloned in E. coli cells using the TOPO TA cloning kit from Invitrogen (Carlsbad, CA). Successful colonies were picked and sent to GeneWiz (South Plainfield, New Jersey) for Sanger sequencing. Sequences were cleaned up and assembled using Sequencher software by Gene Codes Corporation (Ann Arbor, MI) and preliminary alignments were made using the Online Aligner with the Silva v105 database (Pruesse et al., 2007). The ARB software package (Ludwig et al., 2004) was used for further, manual sequence aligning and phylogenetic tree building and trees were converted to figures using Adobe Illustrator (Mountain View, CA). Additionally, web-based UniFrac software (Lozupone and Knight, 2005; Lozupone et al., 2006) was implemented to create principle components analysis (PCA) plots comparing the ARB generated phylogeny for archaea and bacteria to environmental sample information. Duplicate clone sequences were assigned using the de novo OTU picking function (≥ 97% similarity) built in to Qiime software (Caporaso et al., 2010). Qiime software was also used for rarefaction analysis of observed OTUs for each sample (Supplementary Figure S6)
Calculations of thermodynamic potential of the anaerobic oxidation of methane
Gibbs energies, ΔGr, for the anaerobic oxidation of methane with sulfate to CO2 CH4(aq) + SO42- + 2H+ CO2(aq) + H2S(aq) +2H2O
First, values of ΔGr were calculated at low pH values extrapolated from temperature correlations of pH measurements from other sites in Guaymas Basin (measured by Dirk De Beer). Secondly, calculations were made using a constant pH value of 5.9 taken from previous measurements of Guaymas Basin vent fluids (Von Damm et al., 1985). The speciation of DIC and H2S as a
function of pH was taken into account. Results
Bulk comparisons of temperature and porewater carbon chemistry
Guaymas Basin sediments with no hydrothermal activity retain bottom water temperatures of 3°C downcore, while active hydrothermal seepage causes sedimentary temperatures to increase from 3°C to as much as 200°C by 40cm depth (Figure 6).
Figure 6. Shallow subsurface temperature profiles from 113 sites at Guaymas Basin indicate the thermal range of different microenvironments within the upper 45 cm of sediment. This figure was modified from McKay et al., 2012.
Temperature profiles from 113 probe measurements spanned the range between these two
Figure 7. Concentration and stable isotope measurements for methane (A) and DIC (B) with corresponding temperature data. Measurements come from discrete depths of 39 sediment cores. A) White circles indicate methane concentration-isotope measurements where in situ
temperatures were less than 25°C while colored circles correspond to in situ temperatures indicated by the color bar legend with all temperatures above 80°C in red. Methane
concentrations may be under- or over-estimated due to methane bubble formation and/or gas loss during core recovery and sample processing. The x axis was shortened between 15 and 30 mM to include a single data point of 28.3 mM. Dashed lines define the range of thermocatalytically derived methane according to measurements made at presumably unlivable in situ temperatures above 150°C, which is supported by literature values of hydrothermally derived methane at temperatures above 300°C (Welhan and Lupton, 1987; Pearson et al., 2005). 2B) DIC concentration and stable isotope data corresponding to in situ temperatures above 100°C are indicated by red circles while all other temperatures are represented by the color range indicated by the legend. Dashed lines define the range of high temperature DIC values according to measurements made above 150°C, which is similar to literature values of DIC from
hydrothermal fluids with temperatures above 300°C (Seewald et al., 1998; Pearson et al., 2005). Methane concentrations range between 0 mM and 28.3 mM with an average concentration of 2.56 mM. A methane concentration greater than 1.5 mM represents a methane partial pressure of > 1 atm at the surface temperature. As sediment cores were not pressurized, the degree to which measured methane concentrations reflect in situ values is not known. Stable carbon isotope values from bulk methane data range between δ13
C values from -74.24 ‰ to -6.35 ‰ with an average value of -37.92 ‰, while the range of δ13C values collected from sediments where temperatures are >25°C, is -43.73 ‰ to -8.82 ‰. More than half of all stable isotopic values for methane (n=191/373) cluster within the range of -43 ‰ to -39 ‰. About 87% of 13
C-DIC values also fall within the abiotic range, only one high temperature δ13C-DIC value is more 13
C-depleted than the abiotic range.
Physicochemical descriptions of individual cores
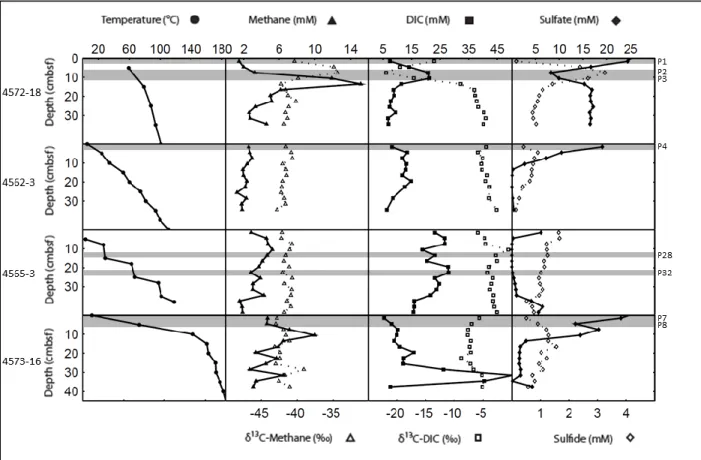
Porewater geochemical profiles, including methane concentrations and stable carbon isotope values, DIC concentrations and stable carbon isotope values, and sulfate and sulfide concentrations are compared to temperature profiles for five individual cores (Figure 8). The data for cores 4569-9, 4569-2, and 4569-4 were previously published (McKay et al., 2012) and are plotted again here for comparison with two additional cores.
Figure 8. Temperature and geochemical profiles for five individual cores. Shallow 40-cm subsurface profiles for temperature, cell concentration, methane concentrations and isotopes, DIC concentrations and isotopes, and sulfate and sulfide concentrations are given for three cores in transect across a Beggiatoa mat (4569-9, 4569-2, and 4569-4), another core from a different Beggiatoa mat (4571-4), and a background core with no hydrothermal activity (4567-28). Filled in shapes correspond to the top axes and open shapes correspond to the bottom axes. Grey bands indicate sample depths for archaeal and bacterial clone libraries.
Sediment core 4569-9
4569-9 is the first core in a 3-core transect across a Beggiatoa mat, and centrally located over the hydrothermal maximum as indicated by the steepest subsurface temperature gradient measured in the mat. Temperatures increase from 13°C at the surface of the mat to 94°C at 40 cmbsf. Methane concentrations are lowest at the surface (0.95 mM) and remain between 1.5 mM and 2.3 mM throughout the rest of the core. Methane is 13C-enriched at the surface (-27.41 ‰) and becomes lighter downcore, reaching -37.69 ‰ at the last depth sampled where the
interpolated temperature from in situ measurements was 83.6°C. DIC concentrations fluctuate considerably between 5 mM and 25 mM while δ13
C-DIC values are fluctuating between -12 ‰ and -18 ‰ but remain lighter than the δ13C-DIC values reported previously from Guaymas Basin hydrothermal fluids (-9.4‰) and bottom water (-0.6‰) (Pearson et al. 2005). Sulfide
concentrations at the top and bottom of the core are approximately 0.9 mM, with a peak
concentration of 1.9 mM at 9-12 cmbsf. No significant sulfate depletion is observed and sulfate concentrations vacillate across a range of 1.4 mM throughout the core.
Sediment core 4569-2
mM throughout the core and methane becomes most 13C-enriched (-25.52 ‰) midcore at a depth of 21-24 cmbsf and temperature of ca. 41.5°C. DIC concentrations increase with depth to 10 cmbsf, after which the concentrations show strong oscillations over a range of 5 mM. δ13C-DIC becomes more negative with depth to about 20 cm, and then reverses slope to become more positive with depth. The sulfate concentration profile is highly variable (with a single outlier of 4.8 mM) but with similar concentrations in the surface and deepest sample. In contrast, sulfide accumulation downcore is relatively smooth to a depth of 21 – 24 cmbsf and temperature of 41.5°C, after which sulfide begins to decrease with depth.
Sediment core 4569-4
Core 4569-4 is the third core in the 3-core transect and was retrieved from the bare sediments beyond the edge of the orange and white Beggiatoa mat. The corresponding
temperature profile for this core increases from 3.3°C at the sediment-water interface to 23.1°C at a depth of 40 cmbsf. Methane accumulation occurs with depth but remains less than 1 mM, while methane steadily becomes more 13C-enriched from -47.58 ‰ at the surface to ca. -28 ‰ at a depth of 21 – 24 cmbsf with a corresponding temperature of 14.4°C. The DIC concentration oscillates but the general trend is an increase from 4.1 mM at the surface to a maximum of 9.3 mM at a depth of 24 – 33 cmbsf where temperatures range between 15°C and 19°C. DIC is 13 C-enriched between the surface and 9 cm, and then 13C-depleted down to -12.13 ‰ at 30 cm. Like methane, sulfide accumulates to 1 mM, while the sulfate profile oscillates and increases from 23.7 mM at the surface to 26.1 mM at depth.
Sediment core 4571-4
from the white section of a Beggiatoa mat, 4569-2, and increases from 6.9°C at the surface to 63.2°C at 40 cmbsf. Methane concentration and stable isotope profiles from core 4571-4 mirror each other: concentrations decrease from ca. 3 mM at the surface to ca. 1.5 mM at depth, and 13
C-enrichment of methane increases from -35 ‰ at the surface to -16 ‰ at 24 – 27 cmbsf (T = 50.6°C). Porewater DIC concentrations increase from 4.6 mM near the surface to 22.4 mM at 24 – 27 cmbsf, while δ13
C-DIC decreases from -19.2 ‰ at the surface to -24.97 ‰ at 24 – 27 cmbsf. Finally, sulfide peaks at 4 mM and sulfate is depleted to 4.5 mM near the bottom of the core where temperatures are greater than 50°C.
Sediment core 4567-28
Core 4567-28 was selected as a background core and retrieved from a site with no observable signs of hydrothermal activity. Temperatures associated with these sediments increase very slightly from 3.1°C at the surface to 4.1°C at 40 cmbsf. Methane concentrations here are the lowest compared to all cores measured (≤0.01 mM throughout) and stable isotopic values for methane are extremely 13C-depleted, ranging between -67 ‰ and -75 ‰. DIC
concentrations fluctuate between 3 mM and 7 mM and are highest at the deepest depth sampled, 21 – 24 cmbsf, while δ13C-DIC becomes moderately 13C-depleted downcore, reaching -10.25 ‰ at the same depth. Sulfide concentrations remain very low (≤0.1 mM) and sulfate concentrations fluctuate between 23 mM and 26 mM.
16S rRNA gene clone library data
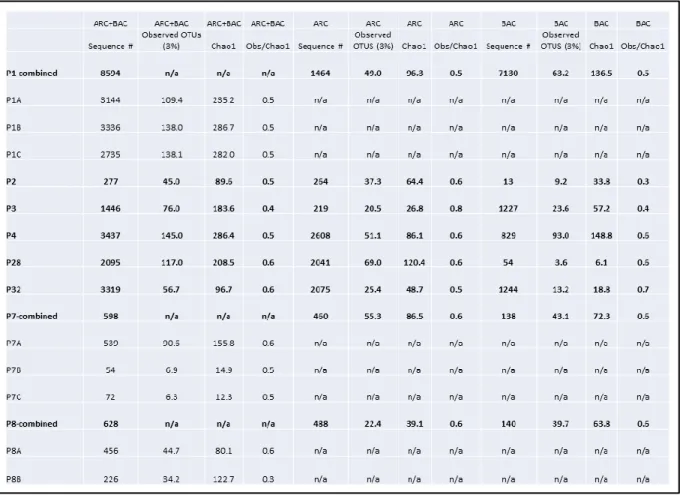
Figure 9. Clone distribution bar graphs for 16S rRNA gene libraries. Relative distributions of clone recovery are presented at the phylum-to-class level for the five cores studied for archaea (A) and bacteria (B). Each bar represents a sampled section of one of the five cores which are indicated further by the grey shaded areas in Figure 8. Three sections were sampled for the hottest core in the microbial mat transect (4569-9) while only two sections, the top and the bottom, were sampled from the other cores. In situ temperatures for each section are listed on the far left. Sequence recovery for each sample is here reported first for archaea and then for bacteria: 4569-9 T (48, 49), 4569-9 M (30, 36), 4569-9 B (30, 0), 4569-2 T (30, 31), 4569-2 B (30, 25), 4569-4 T (28, 43), 4569-4 B (33, 56), 4571-4 T (34, 33), 4571-4 B (46, 0), 4567-28 T (40, 30), and 4567-28 B (48, 30).
The ten groups with the highest number of representatives from the archaeal clone library, in order from highest to lowest, are ANME-1, Marine Benthic Group D (MBG-D, Vetriani et al., 1999), ANME-1 Guaymas (Biddle et al., 2012), ANME-2c (Orphan et al. 2001), Marine Benthic Group B (MBG-B, Vetriani et al., 1999), Deep-sea Hydrothermal Vent
Euryarchaeota Group 6 (DHVE-6, Takai and Horikoshi, 1999), Marine Group 1 (MG-1, DeLong 1992), Miscellaneous Crenarchaeotal Group (MCG, Inagaki et al., 2003), Archaeoglobales, and Mystery Euryarchaeotal Group (this study). For Bacteria the ten most abundant groups are Chloroflexi, Deltaproteobacteria, Hot Seep 1 group (Holler et al., 2011), Bacteriodetes, Gammaproteobacteria, Epsilonproteobacteria, Planktomycetales, WS3 (Dojka et al., 1998), Japan Sea Group 1 (JS1, Webster et al., 2004), and Unknown Group I (this study), which is related to the Planktomycetales-Verrucomicrobia-Chlamydiae super phylum (Fuerst and Sagulenko, 2011). Phylogenetic relationships within the ANME-related archaea (ANME-1, ANME-1 Guaymas, ANME- 2c, Methanoperedenaceae), which make up 48% of total Archaeal 16S rRNA gene recovery (186 of 387 clones), are examined at higher resolution in an
Figure 10. 16S rRNA gene phylogeny for ANME Archaea (A) and Deltaproteobacteria/Hot Seep Group (B). Phylogenetic trees are based on gene sequences for the 16S small ribosomal RNA subunit from environmental clones from Guaymas Basin sediments. Neighbor joining trees were constructed in ARB with a Jukes-Cantor correction and bootstrap values are based off of 500 iterations of each tree.
Discussion
activity translates to varied levels of pyrolized and hydrothermally altered organic material, and variable delivery of hydrothermally derived electron donors. Indeed, DIC and methane
approximately 80°C (Supp. Fig. S4C). While the stable carbon isotopic values of methane at other hydrothermal sites are heavier—e.g., -15 ‰ at 21°N on the East Pacific Rise (Welhan, 1988), between -14 ‰ and -7 ‰ at the Lost City serpentinite hydrothermal system (Kelley et al., 2005), between -20 ‰ and -30 ‰ in Yellowstone hot springs (Welhan, 1988)—hydrothermal methane at Guaymas Basin is relatively light, ranging between -43 ‰ and -51 ‰ (Welhan, 1988). The thermocatalytic range of δ13C-CH4 from the highest temperature sediments in this study (dashed lines, Figure 7a) is consistent with previous measurements of the isotopic
signature of methane from Guaymas Basin hydrothermal fluids above 300°C, for which 3 out of 4 measurements were approximately -43 ‰ (Welhan and Lupton, 1987; Pearson et al., 2005). With the exception of a single sediment core, all cores sampled in 2008 and 2009 indicate that 13
C-enriched methane (δ13C-CH4 > -39.09 ‰,) is not detected above 80°C; this temperature is therefore a strong candidate for the upper thermal limit of microbial AOM in Guaymas sediments, as far as this process can be isotopically traced.
It should be noted that stable carbon isotope values for methane may be under the dual influence of biological methanogenesis, which results in depleted δ13C-CH4 values, and biological methane oxidation, which leads to enriched δ13
C-CH4 values. Methane concentrations may be low because an active microbial population is efficiently consuming methane or because there is no methane accumulation in that particular zone. Conversely, high methane
become more 13C-depleted than -43 ‰; stronger 13C-CH4 depletion indicative of biogenic methane formation is found only at temperatures below 25°C. This is interpreted to indicate that ~ 25°C represents a threshold temperature: at lower temperatures, the contribution of isotopically light biogenic methane can be detected since the hydrothermal methane component is
sufficiently attenuated; above 25°C, hydrothermal methane (13C-CH4 near -43 ‰) and its
microbial oxidation – reflected in heavier 13C-CH4 values within the 25°C to 60°C thermal range – predominates, and may drown out the signal of high-temperature biogenic methanogenesis by hyperthermophilic methanogens isolated from Guaymas Basin (Jones et al., 1983; Kurr et al., 1991).
Similarly, δ13
C-DIC values can demonstrate thermal constraints on the microbial process of organic matter remineralization (OMR). In Guaymas Basin, the δ13
C-DIC values prior to sedimentary microbial processing range from 0.6 ‰ in bottom water (Pearson et al., 2005) to -9.4 ‰ in hydrothermal fluids (Seewald et al., 1998) (dashed lines, Figure 7B). From this study, δ13
C-DIC porewater measurements from high temperature sediments in abiotic temperature regimes above 150°C fall within this range, between -4.87‰ and -8.75‰ (Supplementary Figure S4D). More strongly 13C-depleted values, below -9.4 ‰, likely indicate microbially mediated OMR, and are found only up to approximately 100°C. The resulting 80°C and 100°C estimates for the upper thermal limits of microbial AOM and OMR, have to be qualified twofold. First, abundant hydrothermal methane or non-biogenic DIC could buffer and attenuate the isotopic signatures of microbial AOM and OMR at high temperatures; second, biotic isotopic
confirm observations from bulk stable carbon isotope data. Lastly, the lack of heavy methane above 80°C and light DIC above 100°C are observations that cannot themselves be used to conclude the thermal limits AOM and OMR, but rather suggest a starting point for further investigation.
All individual cores examined except the background core (4567-28) and the surface layer of the bare sediment core (4569-4) have δ13C-CH4 values more enriched than -39‰, suggesting the prevalence of microbially mediated AOM in hydrothermally active sediments. The in situ temperature range of these sediment cores (up to 83.6°C) is consistent with the previously suggested upper thermal limit for AOM. The δ13
C-CH4 signal is decreasing downcore, towards -39‰ at the bottom of the high temperature core (4569-9). A notable difference between the two thermally similar cores, 4569-2 and 4571-4 is apparent in the δ13 C-CH4 profiles. In core 4569-2 the strongest 13C-enrichment of methane (indicative of methane oxidation) appears midcore, near 21 cmbsf and a temperature of ca. 40°C, while in core 4571-4 methane becomes increasingly 13C-enriched all the way downcore towards a temperature of ca. 60°C. This difference suggests that additional factors, for example lateral advection and
inmixing of different porewater and methane pools in the hydrothermally flushed Guaymas sediments, may disconnect locally observed isotopic signatures from microbial processes at the same site. The cold background core presents δ13C-CH4 values indicative of biological
methanogenesis producing methane (at low concentrations) with extremely 13C-depleted values around -70‰.
concentrations and temperature, but also on pH, which was not measured in situ. Two scenarios were therefore considered—very low-pH conditions extrapolated from temperature-correlated pH gradients from another Guaymas Basin dataset (personal communication with Dirk de Beer) (Figure 11A), and a pH of 5.9, previously published for Guaymas Basin hydrothermal fluids (Von Damm et al., 1985). Compared to the low-pH regime, the moderate pH conditions reduce the Gibbs energy of sulfate dependent AOM, but higher temperatures increase ΔGr in both cases (Figure 11B). Regardless of which pH model is used in the calculations, it is apparent that sulfate dependent AOM is favorable, and more so with increasing temperature and depth. It should be mentioned that the recently elucidated reaction mechanism for AOM coupled to sulfur disproportionation, with a combined steady state ΔG of -39.2 kJ mol-1 CH4 for the two half reactions (Milucka et al., 2012), would alter the profiles in Figure 11, which represent AOM coupled to sulfate reduction (steady state ΔG = -34 kJ mol-1 CH4). However, both processes are stoichiometrically equivalent and would therefore retain the same general trend of increasing favorability with depth and temperature. Favorability, though, must be considered in light of maintenance energy. The benefit of increased thermodynamic potential for sulfate dependent AOM in deeper, hotter, and more acidic sediments is likely overshadowed by the increase in maintenance energy requirements under harsher conditions. While an increase in temperature by 20°C increases the Gibbs energy yield by approximately 10 kJ/mol CH4 (Figure 11A; 8 e
-transferred per mole CH4 oxidized), this same change in temperature increases the power
Figure 11. Gibbs energy, ΔGr, of AOM with sulfate in five individual cores. A) Calculations are based on dynamic pH values extrapolated from measured temperature-pH curves at distinct Guaymas sites to the samples from this study. At higher temperatures pH becomes very low (ca. 2) thereby increasing the favorability of the reaction. B) Calculations are based on a fixed pH value of 5.9 taken from the literature (Von Damm et al., 1985). More detailed information can be found in the supplementary text.
In the following section, I will use clone distributions from different depths of the five examined cores to assess the biogeography of microbes in Guaymas Basin hydrothermal sediments. I will discuss microbial distributions in terms of temperature regime, however, geochemical conditions (e.g., electron donors, electron acceptors, and pH) vary along with temperature. Therefore, a group of organisms that appears to favor a given temperature regime, may in fact be constrained by some environmental variable other than temperature.
Clone recovery of 16S rRNA genes shows downcore zonation patterns of archaeal and bacterial communities towards increasing temperatures in the shallow subsurface sediments (Figure 9). Members of the MG-1 archaea are only detected in surficial sediments of the background core. These potentially oxygenated, non-hydrothermal sediments match the habitat requirements of MG-1 phylotypes that predominate in cold, oxic marine surface sediments (Durbin and Teske, 2010). Similarly, MBGD and MBGB archaea also occur in colder
gene recovery was high for members of the MCG in the deepest depth interval of cores 4569-2 and 4571-4, with in situ temperatures of approximately 46°C and 61°C, respectively. Based on single cell genomic analysis (Lloyd et al., 2013), gene expression analyses (Meng et al. 2014), and stable isotope probing (Seyler et al., 2014), the MCG archaea are generally regarded to be anaerobic heterotrophs, which is consistent with their prominence in the deeper layers of these cores. MCG clones recovered from this study belong to subgroups MCG-7, -13, -3, -8, -15, and -16 of this phylum, as defined previously (Kubo et al., 2012). Representatives of the DHVE-6 group were most prominent in the surface layer of 4569-2 at a temperature of 6.1°C and at depth in core 4571-4 where the temperature is 61°C. These two sediment layers are very distinct from one another both thermally and geochemically, possibly indicating the versatility of DHVE-6 archaea or the accumulation of relict DHVE-6 DNA in deeper layers of core 4571-4. Of the five cores examined, these two have the highest total sulfide content, which is consistent with the occurrence of DHVE-6 OTUs in hydrothermal sediments in Iheya Basin characterized by disseminated sulfides (Takai and Horikoshi, 1999). Members related to the genus
Archaeoglobus are present in all three of the Beggiatoa mat transect cores and appear to be somewhat enriched in deeper, hotter sediment layers (Supplementary Figure S3B). Most of the clones are related to three species of hyperthermophilic sulfate or sulfite reducers (A. profundus, Burggraf et al., 1990; A. veneficus, Huber et al., 1997; A. fulgidus, Beeder et al., 1994),
consistent with their sulfidic sediment habitat (Figure 8). Some Archaeoglobales clones are related to Ferroglobus placidus, a nitrate-reducing iron oxidizer (Hafenbradl et al., 1996) indicating that the role of Guaymas Archaeoglobales may not be restricted to sulfur cycling.
ANME-1 and ANME-2c archaea; they were exclusively recovered from sites associated with hydrothermal activity (Figure 11a). The background core, with negligible methane concentrations (≤0.01mM), did not yield any ANME phylotypes. ANME-2c archaea are prevalent in Guaymas sediments but also appear to be thermally/geochemically restricted; 16S rRNA gene recovery demonstrates ANME-2c presence only in the cool core (4569-4) and the cool surface layers of the two warm cores (4569-2, 4571-4). ANME-1 archaeal phylotypes were present in the cool, warm, and hot cores in both the surface and deep sediment layers.
Investigation of the ANME-1 group at higher resolution permits parsing out thermally structured subgroups. The ANME-1 Guaymas group, a separate ANME-1 lineage that is distinct from the widely distributed ANME-1a Guaymas and ANME-1b groups (Biddle et al., 2012; Merkel et al., 2013), appears to be enriched in clone libraries as temperatures increase in the hottest core (4569-9), dominating clone library recovery in the deepest layer at 84°C. ANME-1 Guaymas archaea are a group of putatively thermophilic anaerobic methane oxidizers that are consistently recovered from hot Guaymas sediments (Teske et al., 2002; Biddle et al., 2012; Merkel et al., 2013). In consideration of the previous conclusion that 80°C represents an approximate upper thermal limit for the process of AOM, these occurrence patterns suggest that the ANME-1
Guaymas archaea are the anaerobic methane oxidizers that persist at geochemical conditions near the upper temperature limit of this process, either as a result of high temperature specialization, or due to a wide temperature range combined with high temperature tolerance of ANME-1 Guaymas archaea or some other controlling variable such as pH. All other ANME-1 Archaea demonstrate the opposite trend with increasing temperatures, becoming less dominant as a fraction of the Archaeal clone library. Small-scale phylogenetic clusters within ANME-1
as well as the here proposed ANME-1a Guaymas III, which is represented by seven clones from high temperature sediments (Figure 10). From the clone library sequences it appears that ANME-2c Archaea are associated with cooler sediments (<20°C), most ANME-1 Archaea tolerate warmer sediments, and the ANME-1 Guaymas group may be specialized thermophiles that can access the methane pool residing at higher temperatures.
clones belonged to the following groups: OP1 (7/310), Thermotoga (6/310),
Thermodesulfobacteria (3/310), Caldiserica (4/310), Firmicutes (5/310), Chlorobi (3/310), and Alphaproteobacteria (3/310), while 21 of 333 clones were not identifiable.
the detection of Desulfosarcina-related phylotypes supports the assertion that sulfate reduction is a pervasive process throughout the physicochemically variegated microenvironments of
Guaymas Basin. Recovery of 16S rRNA gene clones related to Deep Seep 1 Deltaproteobacteria was greatest in the deepest section of the cool core with no microbial mat cover. Previously Deep Seep 1 clones have been recovered from gas/oil seep and hydrate sediments in the Gulf of Mexico (AY211659, Mills et al., 2005; AM746084, FN421248, Orcutt et al., 2010), which is consistent with their presence in 4569-4 B that has methane concentrations in the mM range. Sulfide and DIC accumulation at this sediment layer indicates the possibility that Deep Seep 1 bacteria here might be participating in sulfate reduction similar to other deltaproteobacterial genera. Another notable deltaproteobacterial group implicated by clone recovery in Guaymas sediments is Eel-2 (Orphan et al., 2001). Presence of this group is strongest in the middle sediment layer of the hottest core (4569-9 M) where a peak in sulfide accumulation coincides with isotopically light DIC and isotopically heavy methane. Consistent with this occurrence, Eel-2 was previously discovered to be the dominant bacterial group in the surface and shallow subsurface of a microbial mat covered hydrothermal seep in the Gulf of Mexico (Lloyd et al., 2010). The presence of Eel-2 bacteria in these warm, sulfide-rich sediments fits nicely with the recent description of Dissulfuribacter thermophilus, an elemental sulfur-reducing and
thermophilic member of the Eel-2 cluster (Slobodkin et al., 2013).
Figure 12. Principal components analyses of the microbial diversity according to
environmental sample. 16S rRNA gene derived phylogeny, based on a 3% OTU designation, and corresponding sampling locations demonstrate differential clustering patterns for microbial diversity. A) Clustering of similar environmental samples is maintained by the first two
principle components, representing 24.30% and 13.34% of the total variance in archaeal
diversity. Samples cluster into three main groups including high hydrothermal activity (dashed circle), low-to-medium hydrothermal activity (dotted circle), and no hydrothermal activity (upper left quadrant). B) Bacterial diversity imparts no clustering pattern on environmental samples. When plotted against the first two principle components representing 17.91% and 15.33% of the total variance in bacterial diversity, samples appear randomly distributed.
Synthesis and Conclusions
CHAPTER 3: ACTIVE MICROBIAL LIFE IN HIGH TEMPERATURE GUAYMAS BASIN SEDIMENTS
Introduction
At 2000 m water depth in the Sea of Cortez, Guaymas Basin is a 3.5Mya hydrothermally
active spreading center characterized by abundant sources of carbon and energy. A mixture of
productive surface waters and terrestrial runoff coats the basalt crust of Guaymas Basin with a
300-400m thick layer of organic rich sediments, which are heated directly or indirectly by
magmatic intrusions embedded within the sediment layers (Einsele et al., 1980). Hydrothermally
active sites of varying intensities are distributed along the spreading center (Lonsdale and
Becker, 1985); in many areas the seafloor sediments appear no different from cold open ocean
regions while in others thick and colorful Beggiatoa mats indicate hydrothermal seepage and
circulation through the sediment-water interface (Jannasch et al., 1989; Gunderson et al., 1992).
Active seeps are rich in carbon and energy sources and fuel a diverse subsurface microbial
community primarily made up of methanotrophic, methanogenic, and sulfate reducing archaea
and bacteria (Teske et al., 2003). Bottom water at Guaymas Basin has a temperature of
approximately 3°C, and, in especially active sediments, temperatures can increase up to 200°C in
the first 40 cm (McKay et al., 2012). Thus, the abundant carbon and energy sources at Guaymas
Basin come with the microbial cost of tolerating high and/or fluctuating temperatures. Here, the
activity of microbial communities in four very hot subsurface environments is investigated by
pyrosequencing of reverse-transcribed RNA from archaea and bacteria.
This study focuses on sequencing 16S ribosomal RNA (rRNA) instead of rDNA (16S
more representative of the living microbial community. RNA also reflects gene expression and
thus microbial activity more directly than DNA, which may indicate the presence of cells or
cellular genomes. It has been reported that extracellular DNA may account for up to 90% of total
DNA in the upper 10 cm of oceanic sediments (Dell’Anno and Danovaro, 2005), and
DNA-based studies of community composition may thus yield misleading results. However, although
RNA degrades relatively rapidly and is a better indicator of both life and activity than DNA,
microorganisms have multiple intracellular copies of rRNA which are not always uniformly
expressed across diverse species. For instance, expression of rRNA may change according to
cell mass (Gausing, 1977) due to differential regulatory mechanisms inherent to diverse
microorganisms (Wagner, 1994). To this end, abundant sequence recovery from an rRNA
starting point may indicate an especially active microbial group, or a group that requires a
relatively large pool of rRNA for cellular maintenance. Regardless, analyzing rRNA instead of
rRNA genes provides an additional safeguard to avoid false positive sequence-based detection of
microbial life, which is especially important in this investigation of the high temperature fringe
of viability.
Remarkably, very few studies have investigated high temperature life in the natural
environment via RNA-based techniques, and virtually none have examined detailed phylogeny
from RNA sequence recovery. To my knowledge, the highest temperature at which RNA has
been successfully extracted from a natural sample is 82°C; the RNA extract was used to quantify
relative abundance of archaea and bacteria by rRNA slot blotting in a shallow-water
hydrothermal seep in the Mediterranean Sea (Sievert et al., 2000). Although the currently
established high temperature limit for laboratory-grown life is 122°C (Takai et al., 2008), this