Single-trait and multi-trait genome-wide
association analyses identify novel loci for
blood pressure in African-ancestry
populations
Jingjing Liang1, Thu H. Le2, Digna R. Velez Edwards3, Bamidele O. Tayo4, Kyle J. Gaulton5, Jennifer A. Smith6, Yingchang Lu7,8,9, Richard A. Jensen10, Guanjie Chen11, Lisa R. Yanek12, Karen Schwander13, Salman M. Tajuddin14, Tamar Sofer15, Wonji Kim16, James Kayima17,18, Colin A. McKenzie19, Ervin Fox20, Michael A. Nalls21, J. Hunter Young12, Yan V. Sun22, Jacqueline M. Lane23,24,25, Sylvia Cechova2, Jie Zhou11, Hua Tang26, Myriam Fornage27, Solomon K. Musani20, Heming Wang1, Juyoung Lee28, Adebowale Adeyemo11, Albert W. Dreisbach20, Terrence Forrester19, Pei-Lun Chu29, Anne Cappola30, Michele K. Evans14, Alanna C. Morrison31, Lisa W. Martin32, Kerri L. Wiggins10, Qin Hui22, Wei Zhao6, Rebecca D. Jackson33, Erin B. Ware6,34, Jessica D. Faul34, Alex P. Reiner35, Michael Bray3,
Joshua C. Denny36, Thomas H. Mosley20, Walter Palmas37, Xiuqing Guo38, George J. Papanicolaou39, Alan D. Penman20, Joseph F. Polak40, Kenneth Rice15, Ken D. Taylor41, Eric Boerwinkle31, Erwin P. Bottinger7, Kiang Liu42, Neil Risch43, Steven C. Hunt44, Charles Kooperberg35, Alan B. Zonderman14, Cathy C. Laurie15, Diane M. Becker12, Jianwen Cai45, Ruth J. F. Loos7,8,46, Bruce M. Psaty10,47, David R. Weir34, Sharon L. R. Kardia6, Donna K. Arnett48, Sungho Won16,49, Todd L. Edwards50, Susan Redline51, Richard S. Cooper4, D. C. Rao13, Jerome I. Rotter41, Charles Rotimi11, Daniel Levy52, Aravinda Chakravarti53, Xiaofeng Zhu1☯*, Nora Franceschini54☯*
1 Department of Epidemiology & Biostatistics, School of Medicine, Case Western Reserve University, Cleveland, OH, United States of America, 2 Department of Medicine, Division of Nephrology, University of Virginia, Charlottesville, Virginia, United States of America, 3 Department of Obstetrics and Gynecology, Institute for Medicine and Public Health, Vanderbilt Genetics Institute, Vanderbilt University Medical Center, Nashville, Tennessee, United States of America, 4 Department of Public Health Sciences, Loyola University Chicago Stritch School of Medicine, Maywood, Illinois, United States of America, 5 Department of Pediatrics, University of California San Diego, La Jolla, California, United States of America, 6 Department of Epidemiology, School of Public Health, University of Michigan, Ann Arbor, Michigan, United States of America, 7 The Charles Bronfman Institute for Personalized Medicine, Icahn School of Medicine at Mount Sinai, New York City, New York, United States of America, 8 The Genetics of Obesity and Related Metabolic Traits Program, Ichan School of Medicine at Mount Sinai, New York City, New York, United States of America, 9 Division of Epidemiology, Department of Medicine, Vanderbilt-Ingram Cancer Center, Vanderbilt
Epidemiology Center, Vanderbilt University School of Medicine, Nashville, Tennessee, United States of America, 10 Cardiovascular Health Research Unit, Department of Medicine, University of Washington, Seattle, Washington, United States of America, 11 Center for Research on Genomics and Global Health, National Human Genome Research Institute, National Institutes of Health, Bethesda, Maryland, United States of America, 12 Department of Medicine, Johns Hopkins University School of Medicine, Baltimore, Maryland, United States of America, 13 Division of Biostatistics, School of Medicine, Washington University in St. Louis, St. Louis, Missouri, United States of America, 14 Laboratory of Epidemiology and Population Sciences, National Institute on Aging, National Institutes of Health, Baltimore, Maryland, United States of America, 15 Department of Biostatistics, University of Washington, Seattle, Washington, United States of America, 16 Interdisciplinary Program of Bioinformatics, Seoul National University, Seoul, Republic of Korea, 17 Division of Adult Cardiology, Uganda Heart Institute, Makerere University College of Health Sciences, Kampala, Uganda, 18 Department of Medicine, Makerere University College of Health Sciences, Kampala, Uganda, 19 Tropical Metabolism Research Unit, Caribbean Institute for Health Research, University of the West Indies, Mona, Jamaica, 20 Department of Preventive Medicine, University of Mississippi Medical Center, Jackson, Mississippi, United States of America, 21 Data Tecnica International, Glen Echo, MD, United States of America and Laboratory of Neurogenetics, National Institute on Aging, National Institute of Health, Bethesda, Maryland, United States of America, 22 Department of Epidemiology, Rollins School of Public Health, Emory University, Atlanta, Georgia, United States of America, 23 Center for Genomic a1111111111 a1111111111 a1111111111 a1111111111 a1111111111 OPEN ACCESS
Citation: Liang J, Le TH, Edwards DRV, Tayo BO,
Gaulton KJ, Smith JA, et al. (2017) Single-trait and multi-trait genome-wide association analyses identify novel loci for blood pressure in African-ancestry populations. PLoS Genet 13(5): e1006728.https://doi.org/10.1371/journal. pgen.1006728
Editor: Greg Gibson, Georgia Institute of
Technology, UNITED STATES
Received: December 21, 2016
Accepted: March 30, 2017
Published: May 12, 2017
Copyright: This is an open access article, free of all
copyright, and may be freely reproduced, distributed, transmitted, modified, built upon, or otherwise used by anyone for any lawful purpose. The work is made available under theCreative Commons CC0public domain dedication.
Data Availability Statement: Study-specific
Medicine, Massachusetts General Hospital, Boston, Massachusetts, United States of America, 24 Anesthesia, Critical Care and Pain Medicine, Massachusetts General Hospital and Harvard Medical School, Boston, Massachusetts, United States of America, 25 Program in Medical and Population Genetics, Broad Institute, Cambridge, Massachusetts, United States of America, 26 Department of Genetics, Stanford University School of Medicine, Stanford, California, United States of America, 27 Institute of Molecular Medicine and Human Genetics Center, University of Texas Health Science Center at Houston, Houston, TX, United States of America, 28 Division of Structural and Functional Genomics, Center for Genome Science, Korea National Institute of Health, Cheongju, Republic of Korea, 29 Department of Internal Medicine, Graduate Institute of Biomedical and Pharmaceutical Science, College of Medicine, Fu Jen Catholic University, New Taipei City, Taiwan, 30 Division of Endocrinology, Diabetes, and Metabolism, Perelman School of Medicine at the University of Pennsylvania, Philadelphia, United States of America, 31 Human Genetics Center, School of Public Health, University of Texas Health Science Center, Houston, Texas, United States of America, 32 The George Washington University School of Medicine and Health Sciences, Washington DC. United States of America, 33 Department of Internal Medicine, Ohio State University, Columbus, Ohio, United States of America, 34 Survey Research Center, Institute for Social Research, University of Michigan Ann Arbor, Michigan, United States of America, 35 Division of Public Health Sciences, Fred Hutchinson Cancer Research Center, Seattle, Washington, United States of America, 36 Department of Biomedical Informatics, Department of Medicine, Vanderbilt University Medical Center, Nashville, Tennessee, United States of America, 37 Department of Medicine, Columbia University, New York City, New York, United States of America, 38 Medical Genetics Institute, Cedars-Sinai Medical Center, Los Angeles, CA, United States of America, 39 Division of Cardiovascular Sciences, National Heart, Lung, and Blood Institute, National Institutes of Health, Bethesda, Maryland, United States of America, 40 Tufts Medical Center, Tufts University School of Medicine, Boston, Massachusetts, United States of America, 41 Institute for Translational Genomics and Population Sciences, Los Angeles Biomedical Research Institute and Department of Pediatrics, Harbor-UCLA Medical Center, Torrance, CA, 42 Department of Preventive Medicine, Northwestern University Medical School, Chicago, Illinois, United States of America, 43 Institute for Human Genetics, University of California, San Francisco, California, United States of America, 44 Cardiovascular Genetics, University of Utah, Salt Lake City, Utah, United States of America, 45 Department of Biostatistics, Gillings School of Global Public Health, University of North Carolina, Chapel Hill, NC, United States of America, 46 The Mindich Child Health and Development Institute, Ichan School of Medicine at Mount Sinai, New York City, New York, United States of America, 47 Kaiser Permanente Washington Health Research Institute, Seattle, Washington, United States of America, 48 University of Kentucky, College of Public Health, Lexington, KY, 49 Department of Public Health Science, Seoul National University, Seoul, Republic of Korea, 50 Division of Epidemiology, Department of Medicine, Institute of Medicine and Public Health, Vanderbilt Genetics Institute, Vanderbilit University Medical Center, Nashville, Tennessee, United States of America, 51 Department of Medicine, Brigham and Women’s Hospital, Harvard Medical School, Boston, Massachusetts, United States of America, 52 Population Sciences Branch, National Heart, Lung, and Blood Institute of the National Institutes of Health, Bethesda, MD, and the Framingham Heart Study, Framingham, Massachusetts, United States of America, 53 McKusick-Nathans Institute of Genetic Medicine, Johns Hopkins University School of Medicine, Baltimore, Maryland, United States of America, 54 Epidemiology, Gilling School of Global Public Health, University of North Carolina, Chapel Hill, North Carolina, United States of America
☯These authors contributed equally to this work.
*[email protected](XZ);[email protected](NF)
Abstract
Hypertension is a leading cause of global disease, mortality, and disability. While individuals of African descent suffer a disproportionate burden of hypertension and its complications, they have been underrepresented in genetic studies. To identify novel susceptibility loci for blood pressure and hypertension in people of African ancestry, we performed both single and multiple-trait genome-wide association analyses. We analyzed 21 genome-wide associ-ation studies comprised of 31,968 individuals of African ancestry, and validated our results with additional 54,395 individuals from multi-ethnic studies. These analyses identified nine loci with eleven independent variants which reached genome-wide significance (P< 1.25×10⁻⁸) for either systolic and diastolic blood pressure, hypertension, or for combined traits. Single-trait analyses identified two loci (TARID/TCF21 and LLPH/TMBIM4) and
Funding: The work was supported by the National
Institutes of Health, the National Heart, Lung and Blood Institute R21HL123677 (NF) and the National Human Genome Research Institute grant HG003054 (XZ). JLi is supported by HL007567-31 (T32) from the National Heart, Lung and Blood Institute. MAN is supported by a consulting contract between Data Tecnica International and the National Institute on Aging, NIH, Bethesda, MD, USA. The funders had no role in study design, data collection and analysis, decision to publish, or preparation of the manuscript.
Competing interests: I have read the journal’s
multiple-trait analyses identified one novel locus (FRMD3) for blood pressure. At these three loci, as well as at GRP20/CDH17, associated variants had alleles common only in African-ancestry populations. Functional annotation showed enrichment for genes expressed in immune and kidney cells, as well as in heart and vascular cells/tissues. Experiments driven by these findings and using angiotensin-II induced hypertension in mice showed altered kid-ney mRNA expression of six genes, suggesting their potential role in hypertension. Our study provides new evidence for genes related to hypertension susceptibility, and the need to study African-ancestry populations in order to identify biologic factors contributing to hypertension.
Author summary
Hypertension is a global health problem which affects disproportionally people of African descent. We conducted a genome-wide association study of blood pressure in 31,968 Afri-cans and African AmeriAfri-cans to identify genes conferring susceptibility to increased blood pressure. This research identified three novel genomic regions associated with blood pres-sure which have not been previously reported in studies of other race/ethnicity. Using experimental models, we also showed an altered expression of these genes in kidney tissue in hypertension. These findings provide new evidence for genes influencing hypertension risk and supports the need to study diverse ancestry populations in order to identify bio-logic factors contributing to hypertension.
Introduction
Genetic studies hold the promise of providing tools to better understand and treat clinical con-ditions. To achieve the clinical and public health goals of reducing hypertension and its sequelae, and to understand ethnic disparities in the risk for hypertension, there is a need to study susceptible populations for genetic determinants of blood pressure (BP). BP traits are highly heritable across world populations (30 to 55%).[1–4] Over 200 genetic loci have been identified in genome-wide association studies [5–13] and admixture mapping studies.[14–17] These variants explain approximately 3.5% of inter-individual variation in BP.[5,7] However, there is still a paucity of studies focused on individuals of African descent. Most of the loci identified in the literature have not been replicated in individuals of African ancestry.[18,19]
African Americans have higher mean BP, an earlier onset of hypertension, and a greater likelihood to have treatment-resistant hypertension than other ethnic groups.[20–23] Emerg-ing research on Africans shows increasEmerg-ing prevalence of hypertension in urban African com-munities [24,25] which are more Westernized than rural African communities and, so, more closely resemble communities in which African Americans live in the U.S. Hypertension con-tributes to a greater risk of coronary heart disease, stroke, and chronic kidney disease.[26–30] African Americans experience increased risk of these hypertension-related outcomes [31–34] but the underlying mechanisms, whether environmental exposures or increased genetic sus-ceptibility, are unknown.
high density imputed genotypes from the 1000 Genomes Project (1000G) to expand the genome coverage of genetic variants so that we could examine the evidence for association with BP traits.
Here, we report three novel loci associated with BP which are driven by variants that are common in or unique to African-ancestry populations. Through bioinformatics and experi-mental evidence of kidney gene expression in mice submitted to angiotensin-II (Ang II) induced hypertension, we provide evidence for a key role of these genes in the pathogenesis of hypertension. In addition, our study extends the discovery of BP loci to genes related to kidney and the immune systems, and provides biological relevance for these loci to BP regulation.
Results
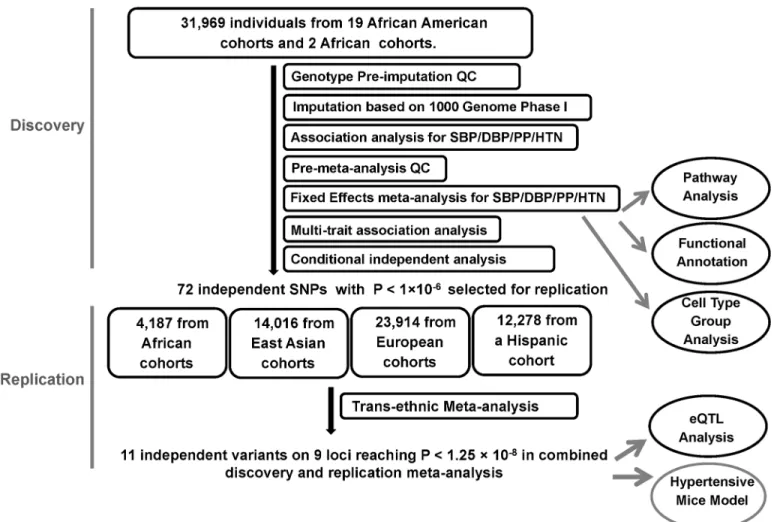
The study design and analysis process are shown inFig 1. Study characteristics, genotyping, and quality control (QC) for discovery and replication samples are shown inS1andS2Tables. The discovery samples included 31,968 individuals of African ancestry from 19 studies. The replication samples included 4,184 individuals of African ancestry from three studies, 23,914 individuals of European ancestry from five studies, 14,016 individuals of Korean ancestry from three studies, and 12,278 individuals of Hispanic/Latino ancestry from one study.
Fig 1. Study design schematic for discovery and replication of loci. QC, quality control; SBP, systolic blood pressure; DBP, diastolic blood pressure; PP, pulse pressure; HTN, hypertension; eQTL, expression quantitative loci.
Single-trait and multi-trait meta-analysis genome-wide association study
(GWAS) results
Study-specific genomic-control inflation ranged from 0.98–1.06 (S3 Table,S1 Fig) and the linkage disequilibrium (LD) score regression intercepts of the single-trait BP meta-analyses calculated by the LD score regression approach ranged from 1.02–1.04. [38] These results sug-gest well-controlled population stratification.
The single-trait BP meta-analyses identified several genome-wide significant single nucleo-tide polymorphisms (SNP) at eight loci (P<5.0×10⁻⁸, systolic BP (SBP): three loci, four SNPs; diastolic BP (DBP): three loci, three SNPs; pulse pressure (PP): three loci, four SNPs; and
hypertension (HTN): one locus, one SNP), with theEVX1/HOXAlocus identified for SBP,
DBP and HTN (S2A–S2D Fig). When combining summary statistics for SBP, DBP, and HTN
using the multi-trait approach CPASSOC,[39] we identified one locus by the multi-trait statis-tic SHom(EVX1/HOXA) and six loci by SHet(ULK4,TCF21,EVX1/HOXA,IGFBP3,CDH17,
ZNF746) at P<5×10⁻⁸(S2E and S2F Fig). Note some loci overlap between single-trait and
multi-trait findings.
We observed 264 variants with P<1×10⁻⁶for either single- or multi- trait GWAS and these variants were further analyzed by conditional association on the most associated SNPs at each locus (S4 Table). These analyses resulted in 72 independent associations, which included 58 SNPs with minor allele frequency (MAF)0.05 and 14 with low frequency variants (0.01<
MAF<0.05) (S5 Table).
Trans-ethnic replication
Among these 72 variants carried forward for trans-ethnic replication, nine variants, all low fre-quency variants (MAF<0.02), were not available in replication cohorts because they were either monomorphic in the replication population or had a low imputation quality, reducing our replication effort to 63 variants (S6 Table). Eleven independent variants at nine loci were significantly associated with BP traits at P<1.25×10⁻⁸in the combined discovery and replica-tion analyses and are reported inTable 1. This significance level was determined by adjusting for two independent traits for SBP, DBP, PP and HTN, and two tests of multiple trait analysis. This includes six variants that reached significance level at discovery stage (P<5 x10⁻⁸). Two loci were identified only through multi-trait analyses (FRMD3,IGFBP3). Three of these nine
loci are novel:TARID/TCF21,FRMD3, andLLPH/TMBIM4(Fig 2A–2C). Four loci (ULK4,
PLEKHG1,EVX1/HOXAcluster, andGPR20) have been reported in our previous BP GWAS
of African ancestry (S3 Fig),[7,18] and two loci (IGFBP3,CDH17) have been reported in mul-tiple-trait analyses of African-ancestry studies (Fig 2D–2F).[39] A composite genetic-risk score using the eleven variants identified accounted for 1.89%, 2.92%, 1.03% and 1.08% of the variance for SBP, DBP, PP and HTN respectively.
Newly identified loci harbor variants common only in African-ancestry
populations
three novel loci (TARID/TCF21,FRMD3, andLLPH/TMBIM4). Given the differences in allele frequency across continental-ancestry populations, we examined the evidence for selection at each of these loci using iHS, which measures the amount of extended haplotype homozygosity at a given SNP along the ancestral allele relative to the derived allele.[40] The iHS score for
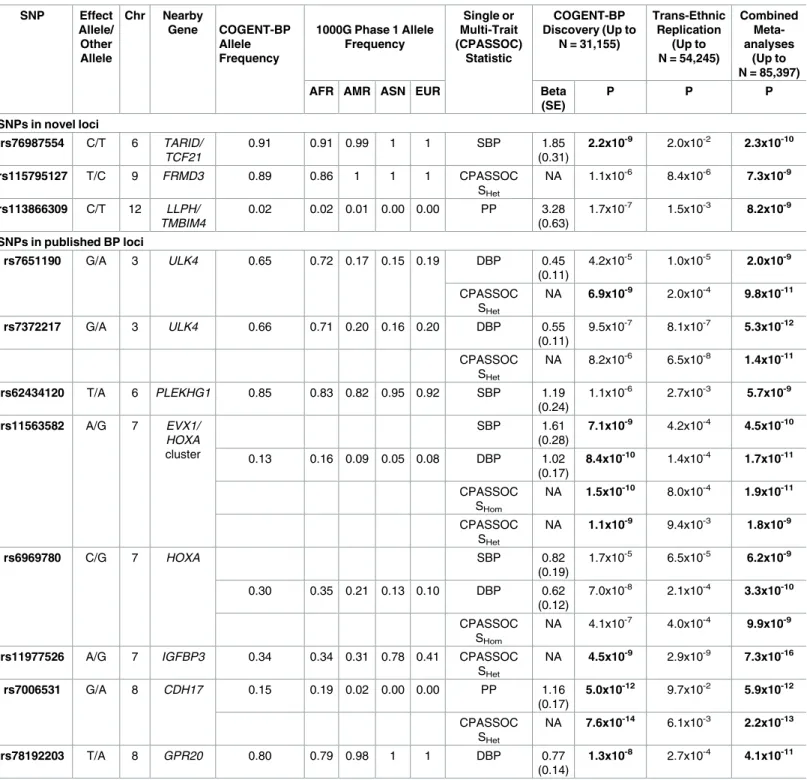
Table 1. Loci identified in combined COGENT-BP African ancestry discovery samples and multi-ethnic replication samples.
SNP Effect Allele/ Other Allele Chr Nearby Gene COGENT-BP Allele Frequency
1000G Phase 1 Allele Frequency Single or Multi-Trait (CPASSOC) Statistic COGENT-BP Discovery (Up to
N = 31,155)
Trans-Ethnic Replication
(Up to N = 54,245)
Combined Meta-analyses
(Up to N = 85,397)
AFR AMR ASN EUR Beta
(SE)
P P P
SNPs in novel loci
rs76987554 C/T 6 TARID/ TCF21
0.91 0.91 0.99 1 1 SBP 1.85
(0.31)
2.2x10⁻⁹ 2.0x10⁻² 2.3x10⁻¹⁰
rs115795127 T/C 9 FRMD3 0.89 0.86 1 1 1 CPASSOC
SHet
NA 1.1x10⁻⁶ 8.4x10⁻⁶ 7.3x10⁻⁹
rs113866309 C/T 12 LLPH/ TMBIM4
0.02 0.02 0.01 0.00 0.00 PP 3.28
(0.63)
1.7x10⁻⁷ 1.5x10⁻³ 8.2x10⁻⁹
SNPs in published BP loci
rs7651190 G/A 3 ULK4 0.65 0.72 0.17 0.15 0.19 DBP 0.45
(0.11)
4.2x10⁻⁵ 1.0x10⁻⁵ 2.0x10⁻⁹
CPASSOC SHet
NA 6.9x10⁻⁹ 2.0x10⁻⁴ 9.8x10⁻¹¹
rs7372217 G/A 3 ULK4 0.66 0.71 0.20 0.16 0.20 DBP 0.55
(0.11)
9.5x10⁻⁷ 8.1x10⁻⁷ 5.3x10⁻¹²
CPASSOC SHet
NA 8.2x10⁻⁶ 6.5x10⁻⁸ 1.4x10⁻¹¹
rs62434120 T/A 6 PLEKHG1 0.85 0.83 0.82 0.95 0.92 SBP 1.19
(0.24)
1.1x10⁻⁶ 2.7x10⁻³ 5.7x10⁻⁹
rs11563582 A/G 7 EVX1/ HOXA
cluster
SBP 1.61
(0.28)
7.1x10⁻⁹ 4.2x10⁻⁴ 4.5x10⁻¹⁰
0.13 0.16 0.09 0.05 0.08 DBP 1.02
(0.17)
8.4x10⁻¹⁰ 1.4x10⁻⁴ 1.7x10⁻¹¹
CPASSOC SHom
NA 1.5x10⁻¹⁰ 8.0x10⁻⁴ 1.9x10⁻¹¹
CPASSOC SHet
NA 1.1x10⁻⁹ 9.4x10⁻³ 1.8x10⁻⁹
rs6969780 C/G 7 HOXA SBP 0.82
(0.19)
1.7x10⁻⁵ 6.5x10⁻⁵ 6.2x10⁻⁹
0.30 0.35 0.21 0.13 0.10 DBP 0.62
(0.12)
7.0x10⁻⁸ 2.1x10⁻⁴ 3.3x10⁻¹⁰
CPASSOC SHom
NA 4.1x10⁻⁷ 4.0x10⁻⁴ 9.9x10⁻⁹
rs11977526 A/G 7 IGFBP3 0.34 0.34 0.31 0.78 0.41 CPASSOC SHet
NA 4.5x10⁻⁹ 2.9x10⁻⁹ 7.3x10⁻¹⁶
rs7006531 G/A 8 CDH17 0.15 0.19 0.02 0.00 0.00 PP 1.16
(0.17)
5.0x10⁻¹² 9.7x10⁻² 5.9x10⁻¹²
CPASSOC SHet
NA 7.6x10⁻¹⁴ 6.1x10⁻³ 2.2x10⁻¹³
rs78192203 T/A 8 GPR20 0.80 0.79 0.98 1 1 DBP 0.77
(0.14)
1.3x10⁻⁸ 2.7x10⁻⁴ 4.1x10⁻¹¹
Bold P-values represent either significance level at 5.0x10⁻⁸in discovery sample or at 1.25x10⁻⁸at combined discovery and replication samples. 1000G
samples: AFR, African ancestry; AMR, American ancestry; ASN, Asian ancestry; EUR, European ancestry
Fig 2. Regional plots of the significant loci A. TARID/TCF21 for SBP B. FRMD3 for SHetof CPASSOC C. LLPH locus for PP
D. CDH17 for PP E. CDH17 for SHetof CPASSOC F. IGFBP3 for SHetof CPASSOC. The y axis shows the−log10P values
rs115795127 was 2.7 in African American samples from the Candidate-gene Association Re-source (CARe) consortium (seeMethods), suggesting selection at theFRMD3locus (S7 Table).
Distinct associations at EVX1/HOXA, ULK4, and GPR20 in
African-ancestry populations
We observed two independent genome-wide significant variants at theEVX1/HOXAlocus
(P<1.25×10⁻⁸). The two variants, rs11563582 and rs6969780, are in weak LD (r2= 0.21) (S3A–S3C Fig), and the LD pattern suggests that these SNPs are located in two blocks (S4 Fig). SNP rs11563582 is in strong LD with the previously reported SNP in the region (rs17428741). [18] SNP rs6969780 remained significant when conditioning on rs11563582 (S4 Table), thus demonstrating the presence of allelic heterogeneity at this locus. Two independent variants at
ULK4reached the significance threshold: rs7651190 and rs7372217 (LD r2= 0.15) (S4E Fig). SNP rs7372217 is in strong LD with the previous reported SNP rs1717027.[18] The association evidence of rs1717027 can be explained by rs7372217 but not by rs7651190 in conditional analysis (S4 Table). Thus, rs7651190 is an independent association at this locus. At theGPR20
locus, our most significant SNP, rs78192203, is 8kb away and it is not in LD with the published SNP, rs34591516 (r2= 0.008, D’= 0.68 in African American CARe participants).
Pathway analyses suggest enrichment of immune pathways for BP
traits
To gain insight into biologic mechanisms underlying genes associated with BP traits, we per-formed pathway analysis using publicly available databases. [41] The most relevant pathways identified were GSK3, Th1/Th2 differentiation, and Sonic Hedgehog (SHH) pathways (BIO-CARTA): pyrimidine metabolism, apoptosis signaling pathway, and B cell activation (Pan-ther); JAK Stat signaling, T cell receptor signaling, and B cell receptor signaling (Ingenuity); cytokine-cytokine receptor interaction and vascular smooth muscle contraction (KEGG); and neuronal activity, T cell mediated immunity, and tumor suppressor (Panther Biological Pro-cess) (Gene Set Enrichment Analysis [GSEA] P-value<0.01,S8 Table). These analyses suggest enrichment of immune pathways for BP traits.
Tissue and cell type group enrichment analyses identify immune, kidney,
and cardiovascular enriched systems
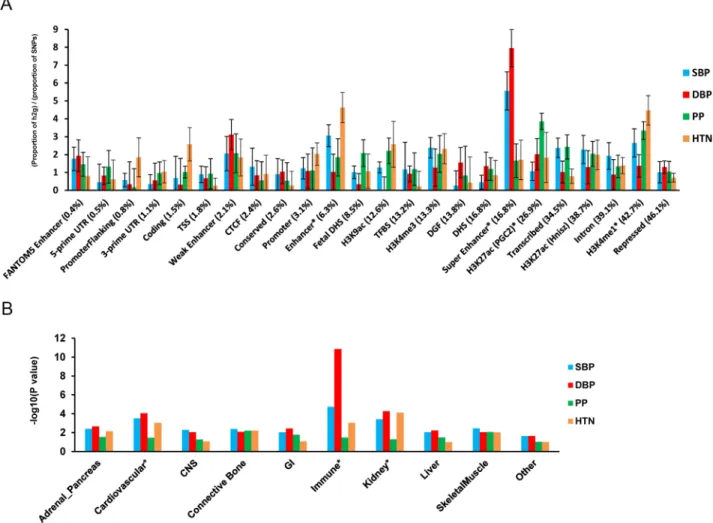
We performed functional annotation and cell type group enrichment analysis using the strati-fied LD score regression approach which uses data from ENCODE and the Roadmap Epige-netic Project, as well as GWAS results while accounting for the correlation among markers. [42] We estimated functional categories of enrichment using an enrichment score, which is the proportion of SNP-heritability in the category divided by the proportion of SNPs. We identified super enhancer (PEnrich= 5.4×10⁻⁵,Enrichment = 5.6 for DBP), enhancer (PEnrich= 4.8×10⁻⁴, Enrichment = 4.3 for HTN), and H3K27ac (PEnrich= 3.2×10⁻⁴, Enrichment = 3.6 for HTN) significant enrichment (Fig 3). These results support a role of identified noncoding reg-ulatory regions in BP regulation. In addition, the following cell types showed significant enrichment (P2.5×10−3): the immune (PEnrich= 1.4×10⁻⁹, Enrichment = 8.4 for DBP), kid-ney (PEnrich= 5.4×10⁻⁵, Enrichment = 4.8 for DBP), and cardiovascular (PEnrich= 8.9×10⁻⁵, Enrichment = 4.2 for SBP) systems (Fig 3).
diamond and its correlation with other SNPs in the region is shown in color. The orange triangle is P value in the combined discovery and replication trans-ethnic meta-analysis of the lowest P value SNP.
We next determined the enrichment of variants at the eleven genome-wide significant loci for DNase l hypersensitive (DHS) sites in 34 tissue categories from ENCODE. At each locus, we identified variants in r2>0.1 with the index variant and calculated causal evidence (Bayes Factors) for each variant. We then tested for enrichment in the causal evidence of variants in
DHS sites using fGWAS.[43] We found enrichment of blood/immune DHS (Enrichment = 3.1)
and cardiovascular DHS (blood vessel Enrichment = 28.7, heart Enrichment = 2.0), in addition to DHS in several fetal tissues (S5 Fig). Candidate causal variants at several loci overlapped enriched DHS sites. For example, at theLLPH/TMBIM4locus, the most likely causal variant, rs12426813, overlaps a DHS site active in immune (CD14+, CD4+, CD34+), blood vessel (HMVEC), and heart (HCF) cells (S5 Fig).
Overlap with eQTL at specific tissues
To examine whether the eleven significant SNPs are eQTL, we searched the genotype-tissue expression (GTEx) pilot database, which includes non-disease human tissue.[42] Among the
eleven SNPs, three SNPs have been identified as eQTL: rs6969780 (HOXA2), rs7651190
Fig 3. Enrichment for functional annotations and cell-type groups using stratified LD score regression. A. Enrichment estimates of 24 main annotations for each of four BP traits. Annotations are ordered by size. Error bars represent jackknife standard errors around the estimates of enrichment, and stars indicate significance at P<0.05 after Bonferroni correction for 24 hypotheses tested and four BP traits. B. Significance of enrichment of 10 cell-type groups for four BP traits. Dotted line and stars indicate significance at P<0.05 after Bonferroni correction for 10 hypotheses tested and four BP traits.
(ULK4), and rs62434120 (PLEKHG1) (S9 Table). SNP rs6969780 is an eQTL for expression of
HOXA2,HOXA7,HOTAIRM1, andHOXA5in multiple tissues, including esophagus, artery,
lung, skin, nerve, adipose, skeletal muscle, and stomach tissues. SNP rs7651190 is an eQTL for
ULK4andRPL36P20in artery, whole blood, thyroid, nerve, esophagus, skeletal muscle, skin,
brain, and stomach cells/tissues. SNP rs62434120 is an eQTL forPLEKHG1in testis tissue.
Kidney gene expression in experimental angiogensin II-induced
hypertension
To determine if identified genes are functionally involved in BP regulation in the kidney dur-ing hypertension,[44] we quantified gene expression in mice kidneys at baseline and during the hypertensive state induced by Ang II. This hypertensive model was chosen for two reasons: 1) to mimic the low plasma renin state, albeit more exaggerated than the level observed, in African-ancestry individuals that has been suggested to reflect the elevated renin-angiotensin system activity at the tissue level in the kidney [45], and 2) maintenance of hypertension in the Ang II model requires activation of the immune system that is implicated in several identified loci.[46,47] Kidney gene expressions of the identified genes were compared to age-matched untreated mice after two weeks of Ang II infusion, which increases SBP. For theHOXAlocus, we examined the expression of genes that are known to be expressed in the mouse kidney:
Hoxa1(2 isoforms),5,7,9,10(2 isoforms), and11. Among all the genes examined,Tmbim4
was the most abundantly expressed gene in the kidney at baseline. Six genes—Hoxa5, Hoxa10-1isoform,Hoxa11,Tmbim4,Igfbp3, andPlekhg1—were significantly differentially expressed in the kidney after Ang II treatment compared to baseline (Fig 4). Except forHoxa5, which showed a significant decrease (Fig 4A), the expression of all these genes increased after the intervention. The expression of six genes—Hoxa1-1isoform,Hoxa7,Hoxa9,Hoxa10-2 iso-form,Llph, andUlk4—were unchanged after Ang II infusion (Fig 4B). The following genes were not expressed in the adult mouse kidney at baseline or after Ang II intervention:Frmd3-1
isoform,Frmd3-2isoform,Grp20,Tcf21,Cdh17, andHoxa1-2isoform.
Discussion
To date, this is the largest genome-wide analysis of African-ancestry populations to study genetic variants underlying BP traits using dense-coverage imputed genotypes. Our main find-ings are eleven independent variants at nine loci, significantly associated with BP traits,
includ-ing three newly identified loci (TARID/TCF21,FRMD3,LLPH/TMBIM4). We also found
evidence for additional independent SNP associations in fine-mapping of three previously described loci,ULK4,EVX1/HOXA, andGRP20.[18,39]
The most significant variants atTARID/TCF21,FRMD3,GPR20, andCDH17are common
variants in COGENT-BP African-ancestry participants, but monomorphic or low frequency
in non-African-ancestry populations. For example, rs115795127 atFRMD3is rare in European
Functional annotation of our lead variants showed co-localization with annotated elements, including super enhancer, enhancer, and H3K27ac chromatic mapping in immune cells and kidney tissues, which has not been previously reported, in addition to cardiovascular tis-sues. There was also evidence for regulatory function in these relevant tissues through gene
Fig 4. Relative renal mRNA levels of genes identified at baseline and after 2 weeks of Ang II-induced hypertension. HPRT gene was used for normalization. N5 in each group. A. Genes that were differentially expressed between baseline and Ang II conditions. B. Genes that were not altered between the two conditions.*P<0.05.**P<0.01.***P<0.001.
expression regulation (eQTL) and through overlaps with DHS in relevant tissues/cells. This evidence was additionally supported by experimental findings of differential expression of six genes (Hoxa5,Hoxa10-1isoform,Hoxa11,Tmbim4,Igfbp3, andPlekhg1) in the mouse kidney after HTN induced by Ang II treatment. Overall, our results suggest the functional importance of identified genes in regulating BP in both normal and hypertension states.
At the newly identified loci, SNP rs76987554 is an intronic variant inTARID(TCF21 anti-sense RNA inducing promoter demethylation) which has not been previously reported to be associated with BP traits. A nearby gene,TCF21(transcription factor 21), is a transcription fac-tor of the basic helix-loop-helix family, which is mainly expressed in the liver, kidney, and heart.TCF21is involved in epithelial differentiation and branching morphogenesis in kidney development,[48] and was associated with hypertension in a study of individuals of Japanese
ancestry.[49] At the chromosome 7, rs115795127 is an intronic variant toFRMD3(FERM
domain containing 3) which encodes a protein involved in maintaining cell shape and integ-rity.FRMD3has been associated with type 1 and type 2 diabetic kidney diseases in different ethnic populations, including those of European, African, and Asian ancestries.[50] The diabe-tes variant, rs10868025, is not in LD with rs115795127 in our African American samples or in 1000G EUR samples (r2= 0.00028 and 0.0018, respectively), thus representing an independent association at this locus.
At chromosome 9, the functions ofLLPHandTMBIM4genes in BP regulation are
cur-rently unknown.LLPHbelongs to the learning-associated protein family and is highly
ex-pressed in the immune system and the adrenal gland.TMBIM4encodes the transmembrane
BAX inhibitor motif-containing protein 4 and is highly expressed in whole blood, the immune system, and the adrenal gland.[51] The most significant variant at this locus, rs113866309, overlaps a DHS in immune, blood vessel, and heart cells. In our experimental model in mice,
Tmbim4gene expression was significantly increased after Ang II-induced HTN. This gene has
been shown to inhibit apoptosis[52] and to decrease the efficacy of inositol 1,4,5-triphosphate (IP3)-dependent release of intracellular Ca2+. [53] This raises the possibility that the TMBIM4 protein may serve to dampen the effect of Ang II, which activates IP3in vascular smooth mus-cle cells through the stimulation of the angiotensin type 1 receptor.[51,53,54] Therefore, it is possible that in conditions of activated renin-angiotensin system, genetic variants that lower
the expression ofTMBIM4may augment BP, whereas genetic variants that increase its
expres-sion may attenuate BP.
Other genes, such asHoxa5,Hoxa10-1,Hoxa11,Igfbp3, andPlekhg1, were significantly
dif-ferentially expressed after Ang II-induced HTN in our mice experimental models. TheHOXA
-cluster has been identified in our previous GWAS of BP in African ancestry and in a recent
GWAS of BP in European ancestry[5] though the underlying mechanisms related to BP
con-trol are unknown. We identified two independent variants at this locus; further studies are needed to delineate which of theHOXAgenes are most likely involved in the association. In our experimental mice model, theHoxa10-1isoform had a greater than 20-fold increase in kidney expression during Ang II-induced HTN compared to baseline levels. However, it remains to be determined whether it is an effect of Ang II in hypertension, or a compensatory response to hypertension. Future studies using genetic manipulation in rodents are required to determine whether these changes are specific response related to BP and Ang II or simply a generic response to stress.
64] This includes reports of overlap of genetic variant associations between BP traits and
immune-disorders [65] and evidence of enrichment of immune pathways from GWAS of BP.
[66] Mutations ofSH2B3, a gene identified in a GWAS of hypertension, have been recently shown to attenuate Dahl salt-sensitivity hypertension through inflammatory modulation.[67] In addition, the actions of Ang II in the pathophysiology and maintenance of hypertension are in part mediated through the activation of the immune system.[46]
Our assessment of the clinical implications of identified variants is limited by available data on African-ancestry populations. For example, there are currently no large publicly available GWAS of coronary heart disease or stroke outcomes in African-ancestry populations. It should also be noted that most of our replication cohorts were from populations other than those of African ancestry. Therefore, the power of replication analysis could still be low, which explains why only 11 of 63 variants were successfully replicated.
In summary, we report 11 independent variants at nine loci that are potential regulators of BP in our African-ancestry population study. Three loci are new. Identified BP variants are enriched in immune, kidney, heart, and vascular system pathways. Our experimental findings suggest that several of these genes may be involved in the renin-angiotensin pathways in the kidney during hypertension. Further population studies and experimental models are required for a comprehensive assessment of the identified genes across the immune, kidney, and cardio-vascular systems. Our study demonstrates the need to further study individuals of African ancestry in order to identify loci and new biological pathways for BP.
Methods
Samples and BP phenotypes
Each study followed protocols for phenotype harmonization. For individuals taking anti-hypertensive medications, we added 15 and 10 mm Hg to measured SBP and DBP, respec-tively, a standard method used in other BP GWAS.[6,68] PP was calculated as the difference
between SBP and DBP after addition of the constant values. HTN was defined by a SBP140
mm Hg, a DBP90 mm Hg, or use of antihypertensive drugs.[69]
Genotyping and imputation
Each cohort was genotyped on either Affymetrix or Illumina genotyping platforms. Pre-impu-tation quality criteria were applied as described inS2 Table, and included exclusion of individ-uals with discordant self-reported gender and genetic gender. Imputation was performed
using the software MACH-ADMIX, MACH-minimac or IMPUTE2 [70–72] using the Phase 1
integrated (March 2012 release) multi-ethnic reference panel from the 1000G Consortium (http://www.internationalgenome.org/).[73]
Association analysis
absolute regression coefficient10. SNPs that passed the QC were carried forward for inverse
variance weighted meta-analyses, implemented in METAL.[77]
Multi-trait statistical analyses using CPASSOC
We applied the CPASSOC software to combine association evidence of SBP, DBP, and HTN. CPASSOC provides two statistics,SHomandSHet,as previously described.[39]SHomis similar to the fixed effect meta-analysis method[77] but accounts for the correlation of summary statis-tics of the multi-traits and for overlapping or related samples among the cohorts.SHomuses the trait sample size as the weight, so that it is possible to combine traits with different measure-ment scales.SHetis an extension ofSHom,and it can increase the statistical power over SHom when a variant affects only a subset of traits. The distribution ofSHetunder the null hypothesis was obtained through an estimated beta distribution. To calculate the statistics,SHomandSHet, and to account for the correlation among the traits, a correlation matrix is required. In this study, we used the correlation matrix calculated from the residuals of the three BP traits after adjustments for covariates and principal components.
Replication and meta-analyses
All independent SNPs identified with P<10−6(threshold chosen for suggestive association) in the discovery stage were carried forward for replication in African-ancestry individuals and in multi-ethnic samples of European Americans, East Asians, or Hispanics/Latinos (Fig 1). For single-trait analyses, we conducted fixed effect meta-analyses in the replication sets for each of four BP traits (SBP, DBP, PP and HTN), followed by a combined trans-ethnic meta-analysis of each trait. This was followed by a mega-meta-analyses, combining the results of discovery and replication for single traits using fixed-effects meta-analysis. We also performed a multi-trait CPASSOC analysis of SBP, DBP, and HTN in each replication study. Because CPASSOC only generated test statistics SHom/SHetand corresponding P values without effect sizes, we com-bined the association P values from all four replication populations using Fisher’s method (http://hal.case.edu/zhu-web/). Finally, we combined the CPASSOC meta-analysis results from the discovery and replication stages using Fisher’s method.
Multiple-testing thresholds
For a single trait GWAS discovery analysis, we used genome-wide significant level P = 5.0×10⁻⁸. We performed six different analyses, four single trait (SBP, DBP, PP and HTN)
analyses and two CPASSOC (SHomand SHet) analyses for each SNP. For the four single
corre-lated traits (SBP, DBP, PP and HTN), we calcucorre-lated the number of independent traits using the eigenvalues of the correlation matrix, [78] which resulted two independent traits. There-fore, we counted four independent analyses, which were two independent single traits and two statistics of CPASSOC analyses, and applied an experimental significance level P = 1.25×10⁻⁸ for claiming a genome-wide significance when combining discovery and replication samples. We should point out that the two CPASSOC test statistics and a single trait statistic are not independent. Thus, the significance level P = 1.25×10⁻⁸is conservative.
Conditional analysis
software/gcta/cojo.html). The LD among variants was estimated from the five African Ameri-can cohorts from the CARe consortium.[79]
Pathway analysis
Pathway analysis was performed using the Meta-Analysis Gene-set Enrichment of variant
Associations (MAGENTA) program (http://www.broadinstitute.org/mpg/magenta/).[41]
Using the summary statistics from the four BP traits and two statistics from CPASSOC, from the discovery stage, we tested whether sets of functionally-related genes are enriched for asso-ciations. This method first converts the P values of SNPs into gene scores with correcting for confounders, such as gene site, number of variants in a gene, and their LD patterns, and then calculated a gene set enrichment P value for each biological pathway or gene set of interest using a non-parametric statistical test. The nominal GSEA P value refers to the nominal gene set enrichment P value for a gene set. The database of pathway/gene-sets to be tested include Ingenuity (June 2008), KEGG (2010), GO, and the Panther, signaling pathways downloaded
from MSigDB and PANTHER (http://www.broad.mit.edu/gsea/msigdb/collections.jsp;http://
www.pantherdb.org/).[81] We applied the parameters suggested by the authors, which includes the 75thpercentile cut off of gene scores, the nominal GSEA P-value<0.01 and the false discovery rate (FDR)<0.3.
Functional annotation enrichment analysis
The enrichment of heritability of genomic regions to different functional categories, including cell type-specific elements, was evaluated using the method of LD score regression (https:// github.com/bulik/ldsc).[42,82] This method partitioned the heritability from the discovery GWAS summary statistics of four BP traits (SBP, DBP, PP, and HTN) while accounting for LD
among markers.[42] We calculated enrichment, in functional regions and in expanded regions
(+500bp) around each functional class, based on functional annotation, using a “full baseline model” previously created from 24 publicly available main annotations that are not specific to any cell type.[42] Enrichment was calculated based on the ratio of explained heritability and the proportion of SNPs in each annotation category. The standard error of enrichment was estimated with a block jackknife to calculate z scores and P values.[42] The multiple testing threshold was determined using the Bonferroni correction while accounting for two indepen-dent-trait analyses based on Ji and Li’s method[78] (P of 0.05/[25 classes×2 traits]). We also performed cell-type-specific group enrichment analysis using cell-type-specific annotations from four histone marks (H3K4me1, H3K4me3, H3K9ac, and H3K27ac), which corresponded to 220 cell types. We divided the 220 cell-type-specific annotations into 10 groups: adrenal/ pancreas, central nervous system (CNS), cardiovascular, connective/bone, gastrointestinal, immune/hematopoietic, kidney, liver, skeletal muscle and other. The analysis characterized cell-type-specific annotations within each group and calculated the enrichment of heritability for each group.[42]
Genomic annotation enrichment
We selected sets of variants in LD r2>0.1 from the eleven replicated variants, and calculated Bayes Factors and posterior causal probabilities for each variant from the effect sizes and stan-dard errors, as previously described.[83] Each distinct variant associated with multiple traits was included in the analysis only once. The genomic annotations of DHS sites for 348 cell types from the ENCODE project were obtained and grouped into cell types associated with 34
tissues (http://genome.ucsc.edu/ENCODE/cellTypes.html). Four gene-based annotations—
GENCODE transcripts were also obtained. Variants overlapping each of these annotations were then identified. Using the variant annotations and fGWAS (https://github.com/
joepickrell/fgwas), we tested for enrichment of variants across all signals in 38 DHS categories, including in the four gene-based annotations in each model.[43]
Expression quantitative trait loci (eQTL) analysis
We used the GTEx pilot database [82] (http://www.gtexportal.org/home/) to identify eQTLs in the successfully replicated SNPs.
Integrated haplotype score (iHS) analysis
To evaluate population differentiation and natural selection, using Haplotter,[40] we calcu-lated the integrated haplotype score (iHS) in five cohorts of CARe so that we could measure
the amount of extended haplotype homozygosity (http://coruscant.itmat.upenn.edu/whamm/
ihs.html). Hence, we tested the evidence of recent positive selection at five significant SNPs with differences in allele frequency across continental-ancestry populations. The measures were standardized (mean 0, variance 1) empirically to the distribution of observed iHS scores over a range of SNPs with similar derived allele frequencies. This method assesses the evidence for selection by comparing the extended homozygosity for haplotypes on a high frequency derived allele relative to the ancestry background.[40]
Experimental mouse models
Experiments were carried out in accordance with local and the National Institutes of Health guidelines. The animal protocol was approved by the University of Virginia Institutional Ani-mal Care and Use Committee. Wild-type Ani-male mice on the 129S6 background at ~ 3 months of age were used for gene expression analyses. All mice were maintained on a 12-hour light-dark cycle with free access to standard chow and water in the animal facility of the University of Virginia.
The hypertension experimental model was induced using Ang II (Sigma-Aldrich, St. Luis, MO) delivered at 600 ng/kg/min for 2 weeks via Alzet mini-osmotic pumps (Durect Corpora-tion, Cupertino, CA, model 2004), as previously described.[84] For gene expression analyses, RNA from kidney tissue was isolated by RNeasy Mini kit (Qiagen) and transcribed to cDNA
by iScriptTMcDNA synthesis kit (Bio-Rad). Real time PCR analyses were performed on
iQTM5 Multicolor real time PCR Bio-Rad instruments using iQTMSYBER1Green Supermix.
Hprtwas used as a reference gene for normalization. Sequences of forward and reversed prim-ers (FP and RP) for the gene expression studies are shown inS10 Table.
Ethic statement. All research involving human participants have been approved by the Institutional Review Board (IRB) # 04-95-72 and study-related Publication and Presentation committees. All participants have provided informed consent for DNA research and data are publicly available in dbGap.
Supporting information
S1 Fig. Quantile-quantile plots for both individual traits and CPASSOC analysis in discov-ery stage.
(PDF)
S2 Fig. Manhattan plots of single trait and CPASSOC analyses at the discovery stage. (PDF)
S3 Fig. Regional interrogation of theHOXA/EVX1, ULK4 and PLEKHG1. (PDF)
S4 Fig. Discovery stage results and linkage disequilibrium maps of the candidate regions. (PDF)
S5 Fig. Enrichment for functional annotations of variants in 11 replicated loci reaching genome-wide significance.
(PDF)
S1 Table. Descriptive characteristics of the discovery studies. (PDF)
S2 Table. Genotyping, pre-imputation quality control, imputation and analysis methods in the participating studies.
(PDF)
S3 Table. Genomic inflation factors by study and analysis. (PDF)
S4 Table. Conditional analysis of SNPs with P<1.0×10⁻⁶in discovery stage for SBP, DBP, PP, HTN or CPASSOC analysis.
(PDF)
S5 Table. 72 Independent SNPs with P<1.0×10⁻⁶in discovery stage for SBP, DBP, PP, HTN or CPASSOC analysis.
(PDF)
S6 Table. Trans-ethnic replication of 72 independent SNPs with P<1.0×10⁻⁶in discovery stage for SBP, DBP, PP, HTN or CPASSOC.
(PDF)
S7 Table. Summary of iHS signals in significant loci with frequency differences across ancestry populations.
(PDF)
S8 Table. MAGENTA analysis. (PDF)
S9 Table. eQTL analysis of significant SNPs in tissues. (PDF)
S10 Table. Primes for mouse expression experiments. (PDF)
S1 Note. Single-trait and multi-trait genome wide association analyses identify novel loci for blood pressure in African-ancestry populations.
Acknowledgments
This is included in the Supplemental Note.
Author Contributions
Conceptualization: NF XZ.
Formal analysis: JLi DRVE KJG JAS TS.
Funding acquisition: SR EB EPB SCH CK CCL JC RJFL BMP DRW SLRK DKA DCR JIR DMB RDJ.
Methodology: KJG.
Project administration: XZ NF.
Supervision: XZ NF.
Validation: THL SC YL GC WK TS JK JLi PLC WZ CCL.
Writing – original draft: JLi THL CR DL KJG.
Writing – review & editing: DRVE BOT JAS YL RAJ GG LRY LS SMT KS TS WK JK CAM EF MAN JHY YVS JML SC JZ HT MF SKM HW JLe AA AWD TF PLC ACa MKE ACM LWM KLW QH WZ RDJ EBW JDF APR MB JCD THM WP XG GJP ADP JFP KR KDT EB EPB KL NR SCH CK ABZ CCL DMB JC RJFL BMP DRW SLRK DKA SW TLE SR RSC DCR JIR CR DL ACh.
References
1. Levy D, DeStefano AL, Larson MG, O’Donnell CJ, Lifton RP, Gavras H, et al. Evidence for a gene influ-encing blood pressure on chromosome 17. Genome scan linkage results for longitudinal blood pressure phenotypes in subjects from the framingham heart study. Hypertension. 2000; 36(4):477–83. PMID: 11040222
2. Hopkins PN, Hunt SC. Genetics of hypertension. Genet Med. 2003; 5(6):413–29.https://doi.org/10. 109701.GIM.0000096375.88710.A6PMID:14614392
3. Samani NJ. Genome scans for hypertension and blood pressure regulation. Am J Hypertens. 2003; 16 (2):167–71. PMID:12559688
4. Cooper RS, Guo X, Rotimi CN, Luke A, Ward R, Adeyemo A, et al. Heritability of angiotensin-converting enzyme and angiotensinogen: A comparison of US blacks and Nigerians. Hypertension. 2000; 35 (5):1141–7. PMID:10818078
5. Ehret GB, Ferreira T, Chasman DI, Jackson AU, Schmidt EM, Johnson T, et al. The genetics of blood pressure regulation and its target organs from association studies in 342,415 individuals. Nature genet-ics. 2016.
6. Ehret GB, Munroe PB, Rice KM, Bochud M, Johnson AD, Chasman DI, et al. Genetic variants in novel pathways influence blood pressure and cardiovascular disease risk. Nature. 2011; 478(7367):103–9. https://doi.org/10.1038/nature10405PMID:21909115
7. Surendran P, Drenos F, Young R, Warren H, Cook JP, Manning AK, et al. Trans-ancestry meta-analy-ses identify rare and common variants associated with blood pressure and hypertension. Nature genet-ics. 2016.
8. Cho YS, Go MJ, Kim YJ, Heo JY, Oh JH, Ban HJ, et al. A large-scale genome-wide association study of Asian populations uncovers genetic factors influencing eight quantitative traits. Nature genetics. 2009; 41(5):527–34.https://doi.org/10.1038/ng.357PMID:19396169
9. Kato N, Loh M, Takeuchi F, Verweij N, Wang X, Zhang W, et al. Trans-ancestry genome-wide associa-tion study identifies 12 genetic loci influencing blood pressure and implicates a role for DNA methylaassocia-tion. Nature genetics. 2015; 47(11):1282–93.https://doi.org/10.1038/ng.3405PMID:26390057
11. Surendran P, Drenos F, Young R, Warren H, Cook JP, Manning AK, et al. Trans-ancestry meta-analy-ses identify rare and common variants associated with blood pressure and hypertension. Nature genet-ics. 2016; 48(10):1151–61.https://doi.org/10.1038/ng.3654PMID:27618447
12. Liu C, Kraja AT, Smith JA, Brody JA, Franceschini N, Bis JC, et al. Meta-analysis identifies common and rare variants influencing blood pressure and overlapping with metabolic trait loci. Nature genetics. 2016; 48(10):1162–70.https://doi.org/10.1038/ng.3660PMID:27618448
13. Warren HR, Evangelou E, Cabrera CP, Gao H, Ren M, Mifsud B, et al. Genome-wide association analy-sis identifies novel blood pressure loci and offers biological insights into cardiovascular risk. Nature genetics. 2017.
14. Wang YJ, Tayo BO, Bandyopadhyay A, Wang H, Feng T, Franceschini N, et al. The association of the vanin-1 N131S variant with blood pressure is mediated by endoplasmic reticulum-associated degrada-tion and loss of funcdegrada-tion. PLoS genetics. 2014; 10(9):e1004641.https://doi.org/10.1371/journal.pgen. 1004641PMID:25233454
15. Zhu X, Young JH, Fox E, Keating BJ, Franceschini N, Kang S, et al. Combined admixture mapping and association analysis identifies a novel blood pressure genetic locus on 5p13: contributions from the CARe consortium. Hum Mol Genet. 2011; 20(11):2285–95.https://doi.org/10.1093/hmg/ddr113PMID: 21422096
16. Zhu X, Cooper RS. Admixture mapping provides evidence of association of the VNN1 gene with hyper-tension. PloS one. 2007; 2(11):e1244.https://doi.org/10.1371/journal.pone.0001244PMID:18043751 17. Zhu X, Luke A, Cooper RS, Quertermous T, Hanis C, Mosley T, et al. Admixture mapping for
hyperten-sion loci with genome-scan markers. Nature genetics. 2005; 37(2):177–81.https://doi.org/10.1038/ ng1510PMID:15665825
18. Franceschini N, Fox E, Zhang Z, Edwards TL, Nalls MA, Sung YJ, et al. Genome-wide association anal-ysis of blood-pressure traits in African-ancestry individuals reveals common associated genes in African and non-African populations. American journal of human genetics. 2013; 93(3):545–54.https://doi.org/ 10.1016/j.ajhg.2013.07.010PMID:23972371
19. Adeyemo A, Gerry N, Chen G, Herbert A, Doumatey A, Huang H, et al. A genome-wide association study of hypertension and blood pressure in African Americans. PLoS genetics. 2009; 5(7):e1000564. https://doi.org/10.1371/journal.pgen.1000564PMID:19609347
20. Calhoun DA, Jones D, Textor S, Goff DC, Murphy TP, Toto RD, et al. Resistant hypertension: diagno-sis, evaluation, and treatment. A scientific statement from the American Heart Association Professional Education Committee of the Council for High Blood Pressure Research. Hypertension. 2008; 51 (6):1403–19.https://doi.org/10.1161/HYPERTENSIONAHA.108.189141PMID:18391085 21. Roger VL, Go AS, Lloyd-Jones DM, Benjamin EJ, Berry JD, Borden WB, et al. Executive summary:
heart disease and stroke statistics—2012 update: a report from the American Heart Association. Circu-lation. 2012; 125(1):188–97.https://doi.org/10.1161/CIR.0b013e3182456d46PMID:22215894 22. Hertz RP, Unger AN, Cornell JA, Saunders E. Racial disparities in hypertension prevalence,
aware-ness, and management. Archives of internal medicine. 2005; 165(18):2098–104.https://doi.org/10. 1001/archinte.165.18.2098PMID:16216999
23. Stevens J, Truesdale KP, Katz EG, Cai J. Impact of body mass index on incident hypertension and dia-betes in Chinese Asians, American Whites, and American Blacks: the People’s Republic of China Study and the Atherosclerosis Risk in Communities Study. American journal of epidemiology. 2008; 167(11):1365–74.https://doi.org/10.1093/aje/kwn060PMID:18375949
24. Mufunda J, Chatora R, Ndambakuwa Y, Nyarango P, Kosia A, Chifamba J, et al. Emerging non-com-municable disease epidemic in Africa: preventive measures from the WHO Regional Office for Africa. Ethnicity & disease. 2006; 16(2):521–6.
25. Addo J, Smeeth L, Leon DA. Hypertension in sub-saharan Africa: a systematic review. Hypertension. 2007; 50(6):1012–8.https://doi.org/10.1161/HYPERTENSIONAHA.107.093336PMID:17954720 26. Lewington S, Clarke R, Qizilbash N, Peto R, Collins R. Age-specific relevance of usual blood pressure
to vascular mortality: a meta-analysis of individual data for one million adults in 61 prospective studies. Lancet. 2002; 360(9349):1903–13. PMID:12493255
27. Hsu CY, McCulloch CE, Darbinian J, Go AS, Iribarren C. Elevated blood pressure and risk of end-stage renal disease in subjects without baseline kidney disease. Archives of internal medicine. 2005; 165 (8):923–8.https://doi.org/10.1001/archinte.165.8.923PMID:15851645
28. Lim SS, Vos T, Flaxman AD, Danaei G, Shibuya K, Adair-Rohani H, et al. A comparative risk assess-ment of burden of disease and injury attributable to 67 risk factors and risk factor clusters in 21 regions, 1990–2010: a systematic analysis for the Global Burden of Disease Study 2010. Lancet. 2012; 380 (9859):2224–60.https://doi.org/10.1016/S0140-6736(12)61766-8PMID:23245609
Pressure: the JNC 7 report. Jama. 2003; 289(19):2560–72.https://doi.org/10.1001/jama.289.19.2560 PMID:12748199
30. Berry JD, Dyer A, Cai X, Garside DB, Ning H, Thomas A, et al. Lifetime risks of cardiovascular disease. The New England journal of medicine. 2012; 366(4):321–9.https://doi.org/10.1056/NEJMoa1012848 PMID:22276822
31. Howard G, Lackland DT, Kleindorfer DO, Kissela BM, Moy CS, Judd SE, et al. Racial differences in the impact of elevated systolic blood pressure on stroke risk. JAMA Intern Med. 2013; 173(1):46–51. https://doi.org/10.1001/2013.jamainternmed.857PMID:23229778
32. Safford MM, Brown TM, Muntner PM, Durant RW, Glasser S, Halanych JH, et al. Association of race and sex with risk of incident acute coronary heart disease events. Jama. 2012; 308(17):1768–74. https://doi.org/10.1001/jama.2012.14306PMID:23117777
33. Sharma A, Colvin-Adams M, Yancy CW. Heart failure in African Americans: disparities can be over-come. Cleve Clin J Med. 2014; 81(5):301–11.https://doi.org/10.3949/ccjm.81a.13045PMID:24789589 34. Zakai NA, McClure LA, Judd SE, Safford MM, Folsom AR, Lutsey PL, et al. Racial and regional
differ-ences in venous thromboembolism in the United States in 3 cohorts. Circulation. 2014; 129(14):1502– 9.https://doi.org/10.1161/CIRCULATIONAHA.113.006472PMID:24508826
35. Genovese G, Friedman DJ, Ross MD, Lecordier L, Uzureau P, Freedman BI, et al. Association of trypa-nolytic ApoL1 variants with kidney disease in African Americans. Science. 2010; 329(5993):841–5. https://doi.org/10.1126/science.1193032PMID:20647424
36. Tekola-Ayele F, Doumatey AP, Shriner D, Bentley AR, Chen G, Zhou J, et al. Genome-wide association study identifies African-ancestry specific variants for metabolic syndrome. Mol Genet Metab. 2015; 116 (4):305–13.https://doi.org/10.1016/j.ymgme.2015.10.008PMID:26507551
37. Cooper RS, Tayo B, Zhu X. Genome-wide association studies: implications for multiethnic samples. Hum Mol Genet. 2008; 17(R2):R151–5.https://doi.org/10.1093/hmg/ddn263PMID:18852204 38. Bulik-Sullivan BK, Loh PR, Finucane HK, Ripke S, Yang J, Schizophrenia Working Group of the
Psychi-atric Genomics C, et al. LD Score regression distinguishes confounding from polygenicity in genome-wide association studies. Nature genetics. 2015; 47(3):291–5.https://doi.org/10.1038/ng.3211PMID: 25642630
39. Zhu X, Feng T, Tayo BO, Liang J, Young JH, Franceschini N, et al. Meta-analysis of correlated traits via summary statistics from GWASs with an application in hypertension. American journal of human genet-ics. 2015; 96(1):21–36.https://doi.org/10.1016/j.ajhg.2014.11.011PMID:25500260
40. Voight BF, Kudaravalli S, Wen X, Pritchard JK. A map of recent positive selection in the human genome. PLoS Biol. 2006; 4(3):e72.https://doi.org/10.1371/journal.pbio.0040072PMID:16494531
41. Segre AV, Consortium D, investigators M, Groop L, Mootha VK, Daly MJ, et al. Common inherited varia-tion in mitochondrial genes is not enriched for associavaria-tions with type 2 diabetes or related glycemic traits. PLoS genetics. 2010; 6(8).
42. Finucane HK, Bulik-Sullivan B, Gusev A, Trynka G, Reshef Y, Loh PR, et al. Partitioning heritability by functional annotation using genome-wide association summary statistics. Nature genetics. 2015; 47 (11):1228–35.https://doi.org/10.1038/ng.3404PMID:26414678
43. Pickrell JK. Joint analysis of functional genomic data and genome-wide association studies of 18 human traits. American journal of human genetics. 2014; 94(4):559–73.https://doi.org/10.1016/j.ajhg. 2014.03.004PMID:24702953
44. Franceschini N, Le TH. Genetics of hypertension: discoveries from the bench to human populations. Am J Physiol Renal Physiol. 2014; 306(1):F1–F11.https://doi.org/10.1152/ajprenal.00334.2013PMID: 24133117
45. Price DA, Fisher ND. The renin-angiotensin system in blacks: active, passive, or what? Curr Hypertens Rep. 2003; 5(3):225–30. PMID:12724055
46. Guzik TJ, Hoch NE, Brown KA, McCann LA, Rahman A, Dikalov S, et al. Role of the T cell in the genesis of angiotensin II induced hypertension and vascular dysfunction. The Journal of experimental medicine. 2007; 204(10):2449–60.https://doi.org/10.1084/jem.20070657PMID:17875676
47. Madhur MS, Lob HE, McCann LA, Iwakura Y, Blinder Y, Guzik TJ, et al. Interleukin 17 promotes angio-tensin II-induced hypertension and vascular dysfunction. Hypertension. 2010; 55(2):500–7.https://doi. org/10.1161/HYPERTENSIONAHA.109.145094PMID:20038749
48. Quaggin SE, Schwartz L, Cui S, Igarashi P, Deimling J, Post M, et al. The basic-helix-loop-helix protein pod1 is critically important for kidney and lung organogenesis. Development. 1999; 126(24):5771–83. PMID:10572052
50. Buffon MP, Sortica DA, Gerchman F, Crispim D, Canani LH. FRMD3 gene: its role in diabetic kidney disease. A narrative review. Diabetology & metabolic syndrome. 2015; 7:118.
51. Lisak DA, Schacht T, Enders V, Habicht J, Kiviluoto S, Schneider J, et al. The transmembrane Bax inhibitor motif (TMBIM) containing protein family: Tissue expression, intracellular localization and effects on the ER CA(2)(+)-filling state. Biochimica et biophysica acta. 2015; 1853(9):2104–14.https:// doi.org/10.1016/j.bbamcr.2015.03.002PMID:25764978
52. Saraiva N, Prole DL, Carrara G, Johnson BF, Taylor CW, Parsons M, et al. hGAAP promotes cell adhe-sion and migration via the stimulation of store-operated Ca2+ entry and calpain 2. The Journal of cell biology. 2013; 202(4):699–713.https://doi.org/10.1083/jcb.201301016PMID:23940116
53. Guo DF, Sun YL, Hamet P, Inagami T. The angiotensin II type 1 receptor and receptor-associated pro-teins. Cell Res. 2001; 11(3):165–80.https://doi.org/10.1038/sj.cr.7290083PMID:11642401
54. de Mattia F, Gubser C, van Dommelen MM, Visch HJ, Distelmaier F, Postigo A, et al. Human Golgi anti-apoptotic protein modulates intracellular calcium fluxes. Mol Biol Cell. 2009; 20(16):3638–45.https:// doi.org/10.1091/mbc.E09-05-0385PMID:19553469
55. Cheng PW, Chen YY, Cheng WH, Lu PJ, Chen HH, Chen BR, et al. Wnt Signaling Regulates Blood Pressure by Downregulating a GSK-3beta-Mediated Pathway to Enhance Insulin Signaling in the Cen-tral Nervous System. Diabetes. 2015; 64(10):3413–24.https://doi.org/10.2337/db14-1439PMID: 25883115
56. Lederman S, Yellin MJ, Krichevsky A, Belko J, Lee JJ, Chess L. Identification of a novel surface protein on activated CD4+ T cells that induces contact-dependent B cell differentiation (help). The Journal of experimental medicine. 1992; 175(4):1091–101. PMID:1348081
57. Lozovoy MA, Simao AN, Morimoto HK, Iryioda TM, Panis C, Reiche EM, et al. Hypertension is associ-ated with serologically active disease in patients with systemic lupus erythematosus: role of increased Th1/Th2 ratio and oxidative stress. Scandinavian journal of rheumatology. 2014; 43(1):59–62.https:// doi.org/10.3109/03009742.2013.834963PMID:24134304
58. Tracy RP, Doyle MF, Olson NC, Huber SA, Jenny NS, Sallam R, et al. T-helper type 1 bias in healthy people is associated with cytomegalovirus serology and atherosclerosis: the Multi-Ethnic Study of Ath-erosclerosis. Journal of the American Heart Association. 2013; 2(3):e000117.https://doi.org/10.1161/ JAHA.113.000117PMID:23688675
59. Mattson DL. Infiltrating immune cells in the kidney in salt-sensitive hypertension and renal injury. Ameri-can journal of physiology Renal physiology. 2014; 307(5):F499–508.https://doi.org/10.1152/ajprenal. 00258.2014PMID:25007871
60. Dell’Omo G, Penno G, Pucci L, Lucchesi D, Del Prato S, Pedrinelli R. Lack of association between TGF-beta-1 genotypes and microalbuminuria in essential hypertensive men. Nephrology, dialysis, transplantation: official publication of the European Dialysis and Transplant Association—European Renal Association. 2009; 24(6):1864–9.
61. Blasi ER, Rocha R, Rudolph AE, Blomme EA, Polly ML, McMahon EG. Aldosterone/salt induces renal inflammation and fibrosis in hypertensive rats. Kidney international. 2003; 63(5):1791–800.https://doi. org/10.1046/j.1523-1755.2003.00929.xPMID:12675855
62. Elmarakby AA, Quigley JE, Imig JD, Pollock JS, Pollock DM. TNF-alpha inhibition reduces renal injury in DOCA-salt hypertensive rats. American journal of physiology Regulatory, integrative and compara-tive physiology. 2008; 294(1):R76–83.https://doi.org/10.1152/ajpregu.00466.2007PMID:17989143 63. Nonaka-Sarukawa M, Okada T, Ito T, Yamamoto K, Yoshioka T, Nomoto T, et al. Adeno-associated
virus vector-mediated systemic interleukin-10 expression ameliorates hypertensive organ damage in Dahl salt-sensitive rats. The journal of gene medicine. 2008; 10(4):368–74.https://doi.org/10.1002/jgm. 1166PMID:18205252
64. Trott DW, Harrison DG. The immune system in hypertension. Adv Physiol Educ. 2014; 38(1):20–4. https://doi.org/10.1152/advan.00063.2013PMID:24585465
65. Andreassen OA, McEvoy LK, Thompson WK, Wang Y, Reppe S, Schork AJ, et al. Identifying common genetic variants in blood pressure due to polygenic pleiotropy with associated phenotypes. Hyperten-sion. 2014; 63(4):819–26.https://doi.org/10.1161/HYPERTENSIONAHA.113.02077PMID:24396023 66. Torkamani A, Topol EJ, Schork NJ. Pathway analysis of seven common diseases assessed by
genome-wide association. Genomics. 2008; 92(5):265–72.https://doi.org/10.1016/j.ygeno.2008.07. 011PMID:18722519
68. Levy D, Ehret GB, Rice K, Verwoert GC, Launer LJ, Dehghan A, et al. Genome-wide association study of blood pressure and hypertension. Nature genetics. 2009; 41(6):677–87.https://doi.org/10.1038/ng. 384PMID:19430479
69. Chobanian AV, Bakris GL, Black HR, Cushman WC, Green LA, Izzo JL Jr., et al. The Seventh Report of the Joint National Committee on Prevention, Detection, Evaluation, and Treatment of High Blood Pres-sure: the JNC 7 report. JAMA: the journal of the American Medical Association. 2003; 289(19):2560– 72.https://doi.org/10.1001/jama.289.19.2560PMID:12748199
70. Collins AJ, Foley RN, Herzog C, Chavers B, Gilbertson D, Ishani A, et al. US Renal Data System 2012 Annual Data Report. Am J Kidney Dis. 2013; 61(1 Suppl 1):A7, e1-476.
71. Howie B, Fuchsberger C, Stephens M, Marchini J, Abecasis GR. Fast and accurate genotype imputa-tion in genome-wide associaimputa-tion studies through pre-phasing. Nature genetics. 2012; 44(8):955–9. https://doi.org/10.1038/ng.2354PMID:22820512
72. Howie BN, Donnelly P, Marchini J. A flexible and accurate genotype imputation method for the next gen-eration of genome-wide association studies. PLoS genetics. 2009; 5(6):e1000529.https://doi.org/10. 1371/journal.pgen.1000529PMID:19543373
73. Genomes Project C, Abecasis GR, Auton A, Brooks LD, DePristo MA, Durbin RM, et al. An integrated map of genetic variation from 1,092 human genomes. Nature. 2012; 491(7422):56–65.https://doi.org/ 10.1038/nature11632PMID:23128226
74. Price AL, Patterson NJ, Plenge RM, Weinblatt ME, Shadick NA, Reich D. Principal components analy-sis corrects for stratification in genome-wide association studies. Nature genetics. 2006; 38(8):904–9. https://doi.org/10.1038/ng1847PMID:16862161
75. Zhu X, Zhang S, Zhao H, Cooper RS. Association mapping, using a mixture model for complex traits. Genet Epidemiol. 2002; 23(2):181–96.https://doi.org/10.1002/gepi.210PMID:12214310
76. Winkler TW, Day FR, Croteau-Chonka DC, Wood AR, Locke AE, Magi R, et al. Quality control and con-duct of genome-wide association meta-analyses. Nature protocols. 2014; 9(5):1192–212.https://doi. org/10.1038/nprot.2014.071PMID:24762786
77. Willer CJ, Li Y, Abecasis GR. METAL: fast and efficient meta-analysis of genomewide association scans. Bioinformatics. 2010; 26(17):2190–1.https://doi.org/10.1093/bioinformatics/btq340PMID: 20616382
78. Li J, Ji L. Adjusting multiple testing in multilocus analyses using the eigenvalues of a correlation matrix. Heredity. 2005; 95(3):221–7.https://doi.org/10.1038/sj.hdy.6800717PMID:16077740
79. Yang J, Ferreira T, Morris AP, Medland SE, Genetic Investigation of ATC, Replication DIG, et al. Condi-tional and joint multiple-SNP analysis of GWAS summary statistics identifies addiCondi-tional variants influ-encing complex traits. Nature genetics. 2012; 44(4):369–75, S1-3.https://doi.org/10.1038/ng.2213 PMID:22426310
80. Yang J, Lee SH, Goddard ME, Visscher PM. GCTA: a tool for genome-wide complex trait analysis. American journal of human genetics. 2011; 88(1):76–82.https://doi.org/10.1016/j.ajhg.2010.11.011 PMID:21167468
81. Thomas PD, Campbell MJ, Kejariwal A, Mi H, Karlak B, Daverman R, et al. PANTHER: a library of pro-tein families and subfamilies indexed by function. Genome research. 2003; 13(9):2129–41.https://doi. org/10.1101/gr.772403PMID:12952881
82. Bulik-Sullivan B, Finucane HK, Anttila V, Gusev A, Day FR, Loh PR, et al. An atlas of genetic correla-tions across human diseases and traits. Nature genetics. 2015; 47(11):1236–41.https://doi.org/10. 1038/ng.3406PMID:26414676
83. Wakefield J. A Bayesian measure of the probability of false discovery in genetic epidemiology studies. American journal of human genetics. 2007; 81(2):208–27.https://doi.org/10.1086/519024PMID: 17668372