THE INFLUENCE OF NON-COVALENT INTERACTIONS ON PHOTOINDUCED ELECTRON TRANSFER AT INTERFACES AND IN FLUID SOLUTION
Wesley B. Swords
A dissertation submitted to the faculty at the University of North Carolina at Chapel Hill in partial fulfillment of the requirements for the degree of Doctor of Philosophy in the
Department of Chemistry.
Chapel Hill 2018
Approved by:
Gerald J. Meyer
Jillian L. Dempsey
Alexander J. M. Miller
Wei You
ABSTRACT
Wesley B. Swords: The Influence of Non-Covalent Interactions on Photoinduced Electron Transfer at Interfaces and in Fluid Solution
(Under the direction of Gerald J. Meyer)
Photoinduced electron transfer is an essential reaction in biology and artificial solar
energy conversion. In the dye-sensitized solar cell (DSSC), regeneration of a
semiconductor-anchored sensitizer through electron transfer from a solution-based redox mediator is a crucial
reaction that is not optimized under operational conditions. Non-covalent interactions offer a
way to control and enhance regeneration. This work details efforts in the development of finite
control over electron transfer reactions, both at solid-liquid interfaces and in solution. The
DSSC is introduced in the context of non-covalent interactions and pertinent electron transfer
theory and techniques in Chapter 1.
Chapters 2 and 3 focus on non-covalent enhancement of the regeneration reaction.
Chapter 2 describes how a sensitizer’s increased propensity to form halogen bonds with the
iodide redox mediator leads to an increase in the regeneration rate constant. The increased rate
constant correlated with larger DSSC photovoltages. Chapter 3 demonstrates the importance
of frontier molecular orbital overlap for electron transfer. Variation of a single chalcogen atom
on a sensitizer showed an order of magnitude increase in regeneration only when the frontier
Chapters 4-8 investigate electron transfer within electrostatic ion pairs. In chapter 4,
bromide formed two-consecutive ion pairs with a dicationic ruthenium sensitizer, that yielded
a drastic shut-off and then recovery of photoluminescence, which aligns with the Gibbs free
energy for electron transfer. Chapters 5-8 utilize a dicationic bipyridyl ligand to increase the
cationic charge of ruthenium polypyridyl compounds. In chapter 5, three ruthenium
compounds, with 4+, 6+, or 8+ charge, show enhanced ion pairing with iodide in acetonitrile.
Chapter 6 characterizes a rare example of ion pairing at the sensitized interface. Regeneration
occurred rapidly, k > 108 s-1, within an ion pair between a hexacationic ruthenium and an anionic cobalt redox mediator. Chapter 7 determines the excited-state quenching mechanism
of similar ruthenium-cobalt ion pairs through ultrafast transient absorption spectroscopy.
Finally, chapter 8 extends the use of ion pairs to excited-state proton-coupled electron transfer
(ES-PCET). Direct measurement of the ES-PCET rate constants within the ion pair facilitated
ACKNOWLEDGEMENTS
My family has played a large role throughout my life. I am eternally grateful to my
parents, Jacquelyn and Bryan Swords, for their endless love and care. From Little League to
collegiate waterskiing, to moving three hours away and then all the way across the country,
you supported me throughout; thank you. To my brother Riley, I am proud of all you have
accomplished and am always happy when we are together. Thank you to my grandparents for
their never-ending interest in my career and goals, and to my aunts, uncles, and cousins.
I am grateful to my undergraduate advisor, Dr. Joshua Figueroa. He showed me the
path of a young academic and solidified my professional goals. I am thankful for the
collaborators I have had throughout my time at UNC, in particular Dr. Curtis Berlinguette and
Dr. Leif Hammarström, who allowed me to spend time in their labs. I also want to thank Dr.
Alexander Miller for the use of his lab space during my first year, Dr. Jillian Dempsey for the
opportunity to expand my teaching experience, and both for the guidance they have offered
over the past five years. It was their interest and openness that motivated me to come to UNC.
My success and growth here at UNC is due in large part to my advisor, Dr. Jerry Meyer.
His guidance, mentorship, and openness to new ideas allowed my research to expand in many
directions. I have thoroughly enjoyed my time in his group.
I am thankful for those who came before me in the group: Ryan O’Donnell, Ke Hu,
Erinn Brigham, Evan Beauvilliers, Tim Barr, and Brian DiMarco, who taught me the way of
Bangle, it has been wonderful working together. You are all more than just workplace
proximity acquaintances and made the group a productive and fun place to be during the day
(and night). Our post-docs Drs. Renato Sampaio, Ludovic Troian-Gautier, Guocan Li,
Cassandra Ward, and Jenny Schneider are wonderful, amazing, driven scientists and all made
an impact on my work through their suggestions and support. I had the wonderful opportunity
to work with many graduate students and postdocs in collaborations and during an eight month
stay in Sweden. I am thankful to all with special note of Laura Casarin, Cameron Kellett, Sarah
Simon, Fraser Parlane, Robin Tyburski, Belinda Pettersson Rimgard, Jens Föhlinger, Luca
D’Amario, Brian McCarthy, Ben Johnson, Vincent Wang, Ashliegh Castner, Astrid
Nilsen-Moe, Kelly Materna, Joshua Green, Lei Tian, and Shihuai Wang.
A special acknowledgement is required for my lab mate and good friend Tyler Motley.
We started grad school together, joined a lab together, and enjoyed time in and out of lab
together the past five years. Your friendship was a bright light throughout this journey. I also
want to thank Erika van Goethem for her friendship throughout. A special thank you to the
Christ UMC Chancel Bells and St. Thomas Moore Chelsea Chimes handbell choirs I
performed with during my time here; Dr. Daniel Steinert, Rodger Pietrich, Drew Melvin, Dr.
John Tomaro, and the other ding-a-lings that allowed me to ring all the bells I could.
Finally, Christina Marvin, my partner through graduate school and in life. Meeting you
early on in grad school and being able to teach, grade, hang-out, and now share my life with
you has been a wonderful experience. I love you and cannot wait to start the next part of our
TABLE OF CONTENTS
LIST OF FIGURES ... xii
LIST OF TABLES ... xxi
LIST OF SCHEMES... xxiii
INTRODUCTION ... 1
The Case for Renewables in a Global Energy Policy ... 1
1.1.1 The detriment of Non-Renewable Fuels ... 2
1.1.2 Solar Energy as a Still Untapped Resource ... 4
The Dye-Sensitized Solar Cell ... 7
1.2.1 General Overview of the Processes in the DSSC ... 8
1.2.2 Sensitizers for the DSSC ... 11
1.2.3 Regeneration and the β-LUSO ... 16
1.2.4 Redox Mediators ... 19
Non-Covalent Interactions ... 25
1.3.1 Hydrogen Bonding ... 26
1.3.2 Hard-Soft Interactions ... 26
1.3.3 Halogen Bonding ... 27
1.3.4 Ion Pairs ... 29
Bimolecular Electron-Transfer Reactions: Techniques and Theory ... 32
1.4.1 Stern-Volmer Analysis... 32
1.4.3 Electrostatic Work Terms ... 37
Conclusions ... 41
REFERENCES ... 43
HALOGEN BONDING AT THE DYE-SENSITIZED INTERFACE... 56
Introduction ... 56
Evidence for Interfacial Halogen Bonding ... 60
2.2.1 Experimental Methods ... 60
2.2.2 Results and Discussion ... 62
2.2.3 Conclusion ... 70
Halogen Bonding Promotes Higher Dye-Sensitized Solar Cell Photovoltages ... 71
2.3.1 Experimental Methods ... 71
2.3.2 Results and Discussion ... 73
2.3.3 Conclusions ... 78
REFERENCES ... 79
RESOLVING ORBITAL PATHWAYS FOR INTERMOLECULAR ELECTRON TRANSFER ... 85
Introduction ... 85
Experimental Methods ... 91
Results ... 95
3.3.1 Synthesis and preparation of surface-anchored samples ... 95
3.3.2 Optical and Redox Properties. ... 95
3.3.3 Interfacial chemistry. ... 98
Discussion ... 100
REFERENCES ... 107
BROMIDE PHOTO-OXIDATION SENSITIZED TO VISIBLE LIGHT IN CONSECUTIVE ION PAIRS ... 112
Introduction. ... 112
Materials and Methods. ... 114
Results. ... 117
Discussion ... 125
4.4.1 Ground-State Ion Pairs. ... 126
4.4.2 Excited-State Ion Pairs. ... 129
Conclusion. ... 132
... 134
IODIDE ION PAIRING WITH HIGHLY CHARGED RUTHENIUM POLYPYRIDYL CATIONS IN CH3CN ... 139
Introduction. ... 139
Experimental Methods. ... 142
Results. ... 148
Discussion ... 156
5.4.1 Redox and Photophysical Properties. ... 156
5.4.2 Iodide Interactions. ... 158
Conclusion. ... 160
REFERENCES ... 162
RAPID STATIC SENSITIZER REGENERATION ENABLED BY ION PAIRING ... 165
Introduction. ... 165
Experimental Methods. ... 166
Conclusion. ... 179
REFERENCES ... 180
ELECTRON TRANSFER MECHANISM WITHIN RUTHENIUIM-COBALT ION PAIRS IDENTIFIED THROUGH ULTRAFAST TRANSIENT ABSORPTION ... 183
Introduction ... 183
Experimental Methods ... 185
Results ... 188
Disscusion ... 197
7.4.1 Identification of Quenching Mechanism ... 197
7.4.2 Relevance to Solar Energy ... 204
Conclusion ... 204
REFERENCES ... 206
ION PAIRING FACILITATES RESOLUTION OF EXCITED-STATE PROTON-COUPLED ELECTRON TRANSFER RATE CONSTANTS... 210
Introduction ... 210
Experimental Methods ... 213
Results and Discussion ... 215
8.3.1 Characterization of the Salicylate Anions... 215
8.3.2 Ruthenium Sensitizers and Ion Pair Formation ... 219
8.3.3 Excited-State Quenching through Proton-Coupled Electron Transfer ... 224
8.3.4 Mechanistic Discussion ... 231
Conclusion ... 234
LIST OF FIGURES
Figure 1.1. A) Global monthly atmospheric CO2 concentration (ppm).
B) Global monthly atmospheric CH4 concentration (ppb). Red symbols
are the monthly average, black symbols are corrected for the average
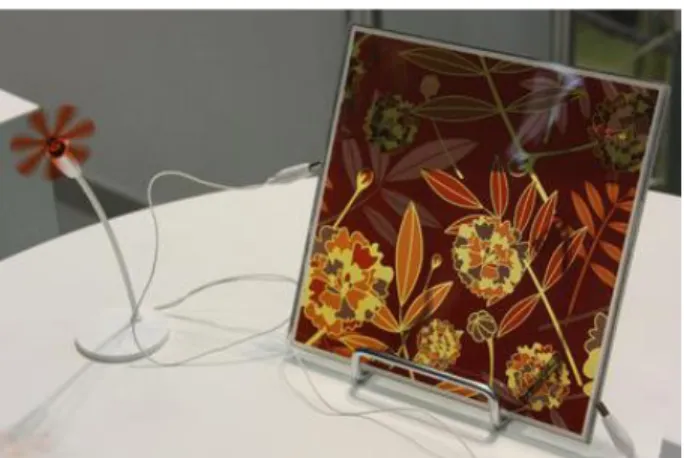
seasonal cycle. Figures acquired from ref 9. ... 2 Figure 1.2. SONY prototype of a DSSC. The fan is powered by DSSC
produced electricity. Taken from ref 32. ... 6 Figure 1.3. A) Schematic of the DSSC showing the beneficial (green arrows)
and detrimental (red arrows) processes. 1) Light absorption/excitation,
2) electron injection, 3) reduction of the redox mediator (M+) at counter electrode,
4) regeneration of the oxidized sensitizer, 5) back-electron transfer, and 6) charge recombination. B) SEM image of the mesoporous, nanocrystalline TiO2
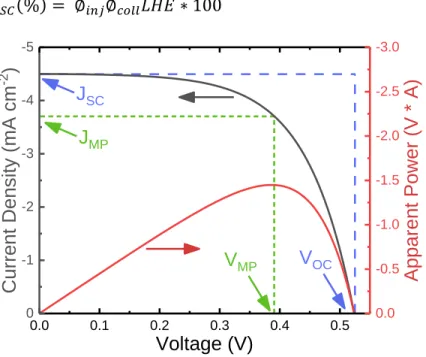
semiconductor utilized for DSSCs. Taken from ref 38... 8 Figure 1.4. Representative current density-voltage curve, gray, and apparent
power, red, plots. The short circuit current density (JSC) and open-circuit
voltage (VOC) are marked along the current density-voltage curve. The
intersection of the blue, dashed lines (JSC * VOC) is the maximum theoretical
power, given a fill factor of 1, whereas the intersection of the green, dotted
lines is the actual device point of max power (simulated FF = 0.61). ... 10 Figure 1.5. Examples of champion sensitizers, push-pull porphyrin
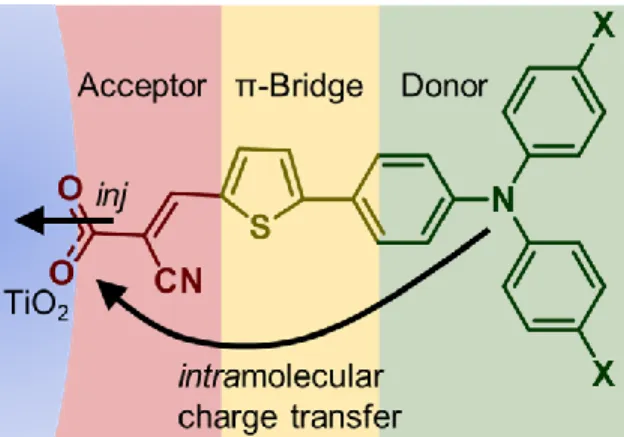
YD2-o-C8,40 donor-π-bridge-acceptor C218,59 and transition metal based Z907.60 ... 12 Figure 1.6. D-π-A sensitizer. Arrows show the intramolecular charge transfer
and injection (inj) processes... 13 Figure 1.7. Schematic of light excitation to the 3MLCT absorption of
[Ru(bpy)3]2+. ... 14
Figure 1.8. A) Shift in the frontier molecular orbitals for reduction and oxidation between the ground and excited states of ruthenium sensitizers. B) Comparison of the regeneration mechanism and reductive quenching
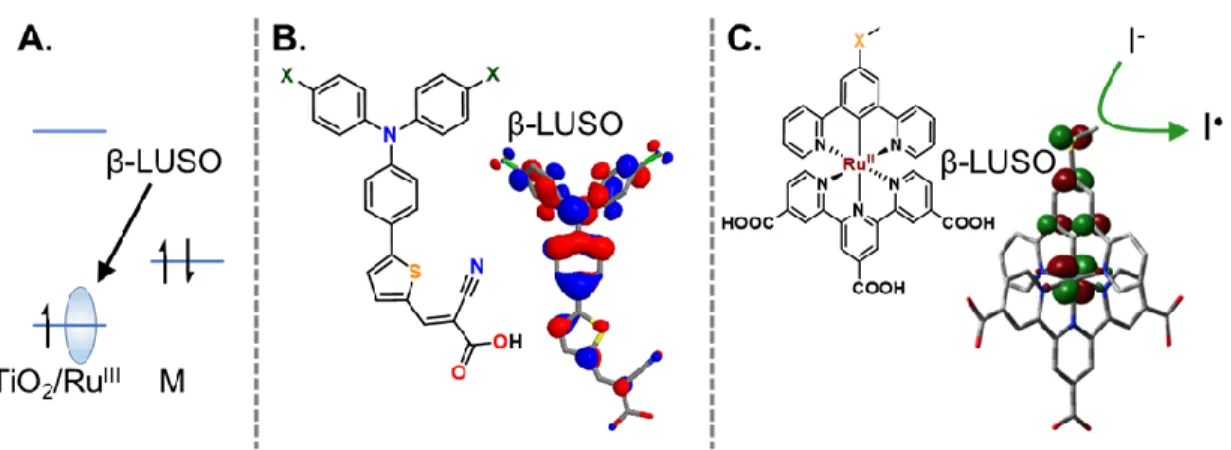
mechanism of a photoexcited ruthenium compound. ... 16 Figure 1.9. A) Schematic showing the β-LUSO for an oxidized sensitizer
(S+) at the TiO2 interface. B) and C) show the orbital density of the β-LUSO
for two different sensitizers. The green arrow in B) and C) shows the
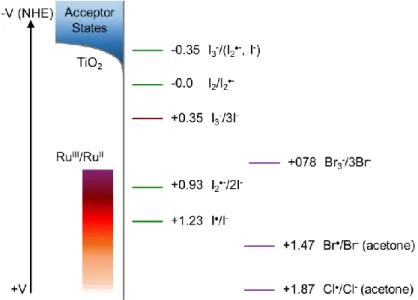
regeneration reaction for iodide across the β-LUSO. ... 17 Figure 1.10. Formal reduction potentials for iodide in acetonitrile (CH3CN)
chloride-based electrolytes are shown with purple bars, and the orange fading in the RuIII/II region shows the needed increase in oxidizing potential. All redox
potentials are reported vs. NHE and are in CH3CN except where mentioned. ... 20
Figure 1.11. Example of a cobalt redox mediator in a DSSC. The CoIII/II redox potential is indicated in red and an example ruthenium sensitizer potential in blue. The difference in the potentials is the regeneration driving
force (GES). ... 24
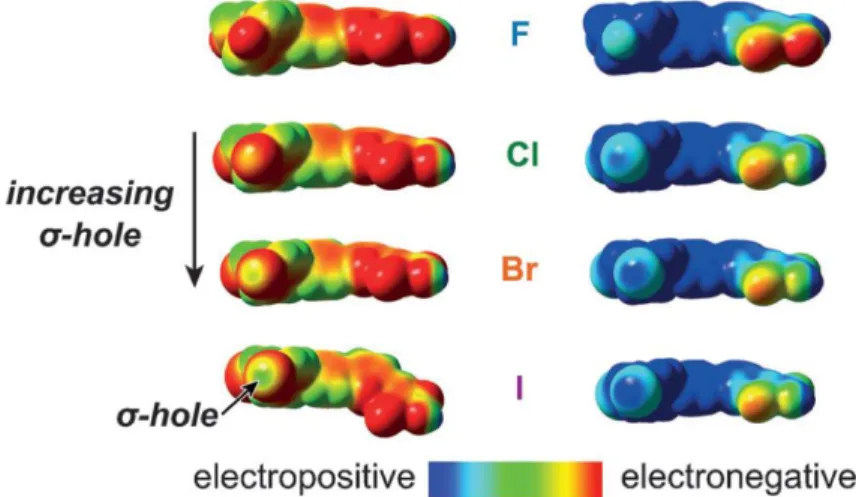
Figure 1.12. Schematic depiction of the anisotropic electron density
surrounding an organohalide compound. The partial positive charge, or σ-hole, that facilitates halogen bonding occurs 180o from the bond. An iodide anion with one of its lone electron pairs is shown near the σ-hole. Figure reproduced
from ref. 151. ... 28 Figure 1.13. Schematic representation of A) the standard regeneration
mechanism that occurs between the oxidized sensitizer (S+) and redox mediator (Mn) and B) the associative regeneration mechanism proposed for a ground-state ion pair between the sensitizer (S) and redox mediator. In A), the association and regeneration are diffusional, whereas B) facilitates
rapid regeneration as the association complex is already present upon excitation. ... 30 Figure 1.14. The 4,4’-bis(trimethylaminomethyl)-2,2’-bipyridine ligand
utilized to enhanced ion pairing in high dielectric solvents. ... 32 Figure 1.15. Schematic depiction of dynamic quenching, blue to black, and
static quenching, purple to black, of ruthenium polypyridyl excited states by iodide. Also shown is the mechanism for static electron transfer within
the [Ru, I-] ion pair. ... 34 Figure 1.16. Simulated (A) steady-state and (C) time-resolved
photoluminescence upon titration of a ruthenium excited state with iodide. B) The steady-state Stern-Volmer plot for a mixed dynamic
and static quenching system, dashed green line. D) shows the time-resolved Stern-Volmer plots for static quenching (Io/I), dashed red line, and dynamic
quenching (τo/ τ), dotted blue line. ... 36
Figure 1.17: Description of the affects changing the A) difference in charge, Δz, between D and A, B) the solvent dielectric constant, εr, and C) the
intermolecular distance has on the work term. Data was calculated from Equation 1.30, with A) the given Δz values, the εr of the solvents indicated,
and a of 6 Å, B) the Δz values shown and a values indicated, and C) the Δz
values shown and the ε of the solvents indicated... 40 Figure 2.1. DFT models of the A) neutral and B) oxidized forms of
potential was plotted over the total electron density at an absolute
isovalue of 0.001.23,56 Darkest red represents a potential of -8.79 kcal mol-1;
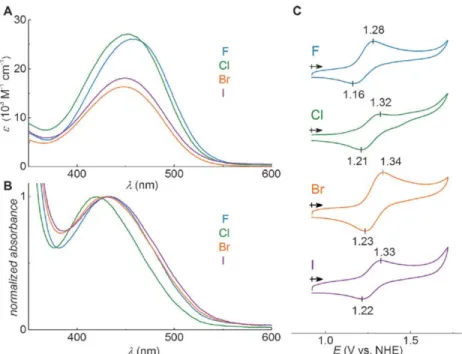
darkest blue represents a potential of 54.6 kcal mol-1. ... 63 Figure 2.2. UV/Vis absorption spectra for A) Dye-X and B) TiO2/Dye-X. C)
Cyclic voltammograms of TiO2/Dye-X. Data is summarized in Table 2.1. ... 64
Figure 2.3. A) Single wavelength kinetic data of TiO2(e-)/Dye-X+ and
I- at iodide concentrations of 0.5-10 mm in NaClO4 (0.3 mm in CH3CN)
solutions. Dyes were excited at 532 nm and probed near the peak of the oxidized spectrum: 610, 620, 630, and 630 nm for X=F-I, respectively. B) Overlaid plots of kobs obtained from kinetic fitting of the single
wavelength kinetic data. The regeneration rate constants for the reaction
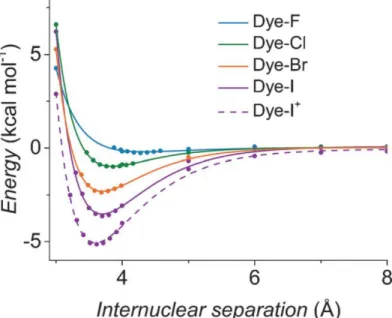
are listed in Table 2.1. ... 67 Figure 2.4. Change in potential energy as a function of the halogen-iodide
distance. The energy measured at a separation of 11 Å is taken as
E=0 kcal mol-1. ... 69
Figure 2.5. (A) Molecular structures of the Dye-X series. The donor unit is the portion of the molecule most likely to react with the electrolyte and is indicated in blue. (B, C) DFT models of the singly oxidized forms of Dye-X showing (B) the β-LUSO and (C) the existence of σ-holes on the poles of the terminal halogen substituents for the series, with the exception of Dye-F. The electrostatic potentials (VE) are plotted from -0.0140 hartree (red) to +0.0871 hartree (blue) over the total electron densities
at an absolute isovalue of 0.001. ... 74 Figure 2.6. Energy level diagram describing key interfacial charge
recombination (kCR), back-electron transfer (kBET), and dye regeneration
(kreg) processes and showing the relevant energy levels for Dye-X and iodide
and cobalt containing electrolytes. S indicates Dye-X. All potentials are
vs NHE. ... 78 Figure 3.1. The Marcus equation describing the rate constant for electron
transfer (kET) is pictured on the left, where ΔG° represents the driving force
for electron transfer, λ represents the reorganization energy of the donor-acceptor pair, HDA represents the electronic coupling factor, and
the remaining terms have their normal meanings. This equation is depicted graphically in the reaction coordinate diagram on the right, where the green and purple parabolas represent the energy of the donor-acceptor pair before and after electron transfer, respectively, and the blue region represents the
deviation of the reaction coordinate from ideality due to electronic coupling. ... 87 Figure 3.2: A schematic representation of a generic molecule (blue)
the molecule is anchored to a solid surface (B), secondary interaction sites are blocked by adjacent molecules. In the absence of a
surface-anchored molecular species (C), the interactions between the
substrate and the surface are difficult to conclusively define. ... 89 Figure 3.3. (A/B) Chemical structures of the X-Me (A) and X-Ar (B)
compounds under investigation. The methyl ester groups are converted to acids to enable binding to titania. (C) Plot of the second-order IET rate constant (kIET) versus the square of the heteroatom contribution
to the β-LUSO, overlaid with visualizations of the β-LUSO, plotted
at an iso-value of 0.05. ... 91 Figure 3.4. A, UV-Vis spectra of X-Me and X-Ar methyl esters in acetonitrile
solutions. B, Normalized UV-Vis absorption spectra for saponified X-Me and X-Ar on TiO2. C, CVs of X-Me and X-Ar in 0.1 M (NBu4)BF4 acetonitrile
solution, collected at 100 mV/s using a Pt working electrode, Pt wire counter electrode, and a Ag/AgCl reference electrode externally referenced to
ferrocene/ferrocenium. ... 96 Figure 3.5. Optical spectra of the indicated compounds anchored to
nano-ITO under varying applied potentials vs NHE in 0.5 M NaClO4
acetonitrile electrolyte. ... 97 Figure 3.6. A schematic depicting the major electron transfer reactions
that occur at functionalized TiO2 (A) or SnO2-TiO2 core-shell (B)
interfaces: excitation of the catalyst by a photon (h𝜈), electron injection into the semiconductor (kinj), back-electron transfer (kBET), and
intermolecular electron transfer (kIET)... 99
Figure 3.7. Absorption changes monitored following pulsed laser excitation of Se-Ar functionalized films at 532 nm. Measurements were taken at 730 nm in 0.5 M NaClO4 electrolyte or 0.5 M NaI
electrolyte on a TiO2 substrate (A), or at 570 nm in 0.5 M NaClO4 electrolyte
using either TiO2 or SnO2/TiO2 core-shell substrates (B). ... 100
Figure 3.8. A schematic depicting the electron transfer pathway
between diiodide X-Me (A) or X-Ar (B), through the iodide···chalcogen interaction. The Ru complex fragment is overlaid with a contour plot of the
β-LUSO down to an iso-value of 0.05. ... 103 Figure 4.1. Displacement ellipsoid plot (50% probability level) of
[Ru(deeb)(bpz)2](PF6)2 obtained from single-crystal structure determination.
The atoms are color coded: N, blue; Ru, magenta; O, red; C, gray.
Hydrogen atoms and PF6− counterions are omitted for clarity. ... 118
(TBABr) in dichloromethane. (c) Extinction coefficient spectra of Ru2+,
[Ru2+, Br−]+, and [Ru2+, 2Br−]. Absorption change at 466 nm (black) and 430 nm (red) (d) and at 430 nm as a function of [Br−] (e). Overlaid in red is a best fit to a Benesi−Hildebrand model, from which the indicated
equilibrium constant was abstracted. ... 119 Figure 4.3. (a) Structure and H atom labels for Ru2+. Only half of the
protons were labeled due to the intrinsic C2 symmetry. (b) 1H NMR
chemical shift of protons b, b′, and f as a function of bromide equivalence. (c) 1H NMR spectra of Ru2+ at indicated equivalents of bromide; [Ru2+]0 =
100 μM. (d) 1H NMR peak shift of protons c and c′ at the indicated
equivalents of TBABr. ... 121 Figure 4.4. Steady-state photoluminescence spectra of Ru2+ in dichloromethane
with (a) up to 1 equiv of added bromide and (b) from 1 to 2 equiv of bromide. (c) Steady-state PL of Ru2+ and [Ru2+, 2Br−] in dichloromethane. Overlaid in
black is the Franck−Condon line-shape fitting. ... 122 Figure 4.5. Time-resolved PL decays measured after pulsed 445 nm
excitation of a 50 μM Ru2+ dichloromethane solution with (a) 0 to 1
and (b) 1 to 2 equivalents of bromide. ... 124 Figure 4.6. (a) Absorption difference spectra measured at the indicated
delay times after pulsed 532 nm laser excitation of a 50 μM Ru2+ and
500 μM bromide dichloromethane solution. Overlaid in red is a simulation based on a 1:1 stoichiometry of Ru+ and Br2•−. (b) Absorption change
monitored at 500 nm with the indicated bromide concentrations. Overlaid in red is the monoexponential fit with τ = 60 ± 5 ns. (c) Absorption change monitored at 405 nm with the indicated [Br−]. Overlaid in red are best fits to a first-order kinetic model. The inset shows a plot of the observed first-order rate constants, kobs,as a function
of the free [Br−] with a best fit line with slope k = (5.4 ± 1) × 108 M−1 s−1. ... 125
Figure 4.7. Three-dimensional contour diagrams developed from the application of Coulomb’s law and natural population analysis described. Contours are plotted at the potential energy for electron transfer from a −1 charge to the ruthenium-based partial charges. Therefore, the contour at 540 mV for the non-ion-paired species indicates the Coulombic attraction for the singly ion-paired bromide, and that at 390 mV is for the doubly
ion-paired species... 129 Figure 5.1. Displacement ellipsoid plot (50% probability level) for the
cation 3, [Ru(tmam)3]8+, obtained from single-crystal structure
determination. The eight PF6¯ anions have been masked for clarity.
Figure 5.2. Steady-state absorption (solid-line) and PL (dashed line)
spectra for the indicated complexes in CH3CN. ... 151
Figure 5.3. Absorption spectra of 1 with the indicated number of iodide equivalents. The arrows indicate the direction of the absorption change with increasing [I−]. The inset displays the absorption change at 353 nm with an overlaid fit to a nonlinear modified Benesi−Hildebrand model from which an ion-pairing equilibrium constant of K = 4000 ± 400 M−1
was abstracted. ... 153 Figure 5.4. Steady-state (A) and time-resolved (B) PL spectral changes
with increasing [I−] for 1. Inset: Lifetime (black) and intensity (blue)
Stern−Volmer plots with overlaid best fits (red lines) for 1. ... 155 Figure 5.5. 1H NMR resonances for 3 and 3′ (A) and methylene (B)
tmam H atoms of 1 in CD3CN with the indicated equivalents of iodide. ... 155
Figure 5.6. Downfield shifts in ppm for the indicated positions of the H atoms measured at high iodide concentrations, 6 equiv, relative to neat acetonitrile. The deeb ligands were equivalent on the NMR time
scale at ambient temperature, and only one is depicted here for clarity. ... 155 Figure 6.1. Extinction coefficient spectra of [TMAM]6+, [TTT]-,
and [DTB]2+ in neat CH3CN solution, solid lines. The dashed line
shows [TMAM]6+ photoluminescence. ... 173 Figure 6.2. (A) Visible absorption spectra of [TMAM]6+ (9 μM in CH3CN)
with up to 3.3 equiv of [TTT]−. The absorbance increase at 630 nm was due to [TTT]−. Inset: difference spectra indicate a MLCT red shift and decrease below 410 nm. (B) Visible absorption spectra of TiO2/TMAM
in 100 mM LiClO4/CH3CN with added [TTT]−. Inset: difference spectra
with overlaid [TTT]− spectrum. ... 174 Figure 6.3. A. Time-resolved photoluminescence of [TMAM]6+, 9 μM, upon
the addition of [TTT]- in CH
3CN. Inset shows the static, Io/I, and dynamic,
τo/τ, Stern-Volmer plots. B. Time-resolved photoluminescence of [TMAM]6+,
40 μM, upon the addition of I- in CH3CN. Inset shows the linear static, Io/I,
Stern-Volmer plot. Dynamic quenching was non-linear and is not shown. ... 174 Figure 6.4. Absorption change monitored at 405 nm at the indicated
[TTT]- concentrations. The inset shows a Stern-Volmer-type analysis
of the initial amplitude change, attributed to static regeneration at time zero. ... 176 Figure 6.5. Photocurrent action spectra and JV curves in light (solid)
and dark (dashed) with [TTT]-, [DTB]2+, and I-/I3- mediators and the
TiO2/[TMAM] sensitizer. ... 177
Figure 7.2. A-C) Steady-state photoluminescence of ~10 μM [Ru] at the indicated concentrations of TTT- in A. D-E) Time-resolved
photoluminescence under the same conditions. A/D) Ru-Bpz4+, B/E)
Ru-Dtb4+, C/F) Ru-OMe4+. ... 191
Figure 7.3. Stern-Volmer plots for the A) steady-state photoluminescence and B/C) time-resolved photoluminescence. B) Static Stern-Volmer. C) Dynamic Stern-Volmer. Blue) Ru-Bpz4+, Red) Ru-Dtb4+, and
Green) Ru-OMe4+. Lines are linear fits to the B) dynamic and C)
static Stern-Volmer equations. Note, the concentrations are not corrected for the bound TTT-. At the ruthenium concentrations
shown that correction would be on average < 5%. ... 193 Figure 7.4. A) Transient absorption spectra for 10 μM Ru-Deeb6+
in the presence of 5 equivalents of TTT-. Selected time delays between
20 ns and 10 μs are shown. The reduced ruthenium spectrum (dashed line)
was obtained through the reduction of Ru-Deeb6+ by tri-p-tolylamine. ... 194
Figure 7.5. Ultrafast transient absorption spectra of ~ 40 μM Ru-Deeb6+
with (A) 0 eq. TTT- and (B) 3 eq. TTT- present. Spectra are shown
between 10 ps and 6 ns. Arrows indicate the direction of signal decay. C) Normalized nanosecond (squares) and ultrafast (lines) transient absorption spectra. Ultrafast transient absorption spectra were recorded at 6 ns after laser excitation, the maximum delay allowed. The nanosecond transient absorption spectrum was recorded 20 ns after laser excitation. The
spectra are normalized at 380 nm. ... 195 Figure 7.6. Single wavelength kinetics at the indicated wavelengths for
~50 μM Ru-Deeb6+ in the presence of ~3 equivalents of TTT- from the
ultrafast transient absorption. A biexponential fit to the data is shown.
Dashed lines show the kinetics when no TTT- is present. ... 196
Figure 7.7. Rates of reductive electron transfer versus -GET for
electron transfer corrected for the electrostatic work term. ... 201 Figure 7.8. Jablonski-type diagram showing the kinetic and energetic
information of the reductive electron transfer quenching mechanism that occurs within the [Ru-Deeb6+, TTT-] ion pair and the back-electron
transfer reaction. To show the driving forces for the reaction, the 0.39 V CoIII/II potential of TTT- was corrected for the electrostatic
work term. The tmam ligands are omitted for clarity. ... 203 Figure 8.1. A) UV-vis absorption spectral changes upon the addition
of tetrabutylammonium hydroxide to an ~80 µM solution of H-HSA. B) Normalized change in absorbance monitored at the absorbance maxima for H-HSA and H-SA-. C/D) Extinction coefficient spectrum
-Figure 8.2. Absorption spectral changes upon the addition of increasing amounts of H2O to CH3CN solutions of the indicated
salicylate derivatives. ~ 250 μM. Asterisks mark the tautomer absorbance. ... 217 Figure 8.3. Peak potential from irreversible cyclic voltammograms
of the indicated R-SA-s vs. the log of the scan rate (ν). The indicated slopes (m) are given in mV/decade. Note the peak potential axis is broken in multiple places for clarity. Error bars are included and in
most cases are similar in size to the symbol. ... 219 Figure 8.4. UV-visible absorption spectra of A) Ru-Dtb and B)
Ru-Bpz (~25 µM) upon the addition between 0 and 740 µM (30 eq.) Cl-SA-. Subtraction spectra calculated by subtracting the absorption
spectra at no Cl-SA- from the spectra with Cl-SA- present for C) Ru-Dtb and D) Ru-Bpz. Arrows indicate the spectral changes upon
Cl-SA- addition. ... 222 Figure 8.5. Change in absorbance at the indicated wavelengths from the
titration of Ru-Dtb (25 µM) with Cl-SA-. Wavelengths were chosen as they are the isosbestic points for the formation of the doubly ion-paired species and therefore the changes are only due to the first ion-pair formation.
The blue dotted line is a fit to a 1:1 binding model. ... 223 Figure 8.6. 1H Nuclear magnetic resonance spectra recorded in CD3CN for
Ru-BPZ upon the addition of up to 3 eq. of Me-SA-. A) Shows the aromatic region, asterisks mark the proton resonances of Me-SA-. B) Shows the methylene resonances on the tmam ligand. Arrows show the downfield shift of the A) 3,3’-tmam protons and B) the methylene tmam protons. C) The total change in chemical shift (ppm) between 0 and 3 eq. of Me-SA
-shown for all proton resonances on Ru-Bpz and Me-SA-. ... 224
Figure 8.7. A-C) Time-resolved photoluminescence decays for Ru-Bpz (25 μM) upon the addition of up to 5 equivalents of the R-SA- derivative indicated, A/D) OH-SA-, B/E) H-SA-, C/F) acetyl-SA-. Black dotted lines
are the instrument response function based on a scattered laser pulse with no sample present. D-F) Dynamic Stern-Volmer plots. Blue dashed line is
a linear fit to the data. ... 226 Figure 8.8. A) Excited-state transient absorption spectra for Ru-Bpz4+*
obtained 1 μs after laser excitation. The negative delta absorbance at wavelengths longer than 570 nm is from uncorrected emission. B) Transient absorption spectra collected 1 and 5 μs after laser excitation. Overlaid is the normalized Ru-Bpz3+ delta absorbance spectra. Deviation
from the Ru3+ spectra is due to the absorbance of R-SA•O. ... 228
trace is the excited-state decay. Overlaid in black are biexponential fits
with the two lifetimes shared between the three traces. ... 230 Figure 8.10. A) Relationship between the rate constants for proton
coupled electron transfer within the ion pair and the driving force for the PCET reaction. B) Decoupled electron-transfer rate constants and driving force for electron transfer assuming a PTET reaction mechanism.
LIST OF TABLES
Table 2.1. Optical, redox, and dye regeneration data for Dye-X.a ... 65
Table 2.2. Calculated Intermolecular Interaction Metrics ... 69
Table 2.3. Photovoltaic parameters for devices containing an iodide-based electrolyte. ... 73
Table 2.4:Thermodynamic data relevant to dye regeneration by iodide... 75
Table 2.5. Photovoltaic and kinetic data for devices with cobalt-based electrolytes ... 78
Table 3.1. Optical and redox properties of ruthenium complexes in solution and immobilized on mesoporous metal oxide (MOX) thin films. ... 96
Table 3.2. Electron-transfer kinetics and β-LUSO partition. ... 100
Table 4.1. Crystallographic data and structure refinement for [Ru(deeb)(bpz)2](PF6)2 ... 118
Table 4.2. Photophysical properties of Ru2+, [Ru2+, Br−]+, and [Ru2+, 2Br−]a ... 123
Table 4.3. Electrochemical and free energy change for Ru2+, [Ru2+, Br−]+, and [Ru2+, 2Br−] ... 132
Table 5.1. Crystal parameters for 3 ... 149
Table 5.2. Photophysical properties for 1–3 in CH3CN ... 151
Table 5.3. Electrochemical data for 1–3 in a CH3CN electrolyte ... 152
Table 5.4. Equilibrium constants for ion pairing in CH3CN ... 154
Table 6.1. Solution excited-state quenching constants and solar device properties ... 175
Table 7.1. Photophysical and electrochemical properties of the ruthenium and cobalt compounds. ... 190
Table 7.2. Stern-Volmer and quenching rate constants from photoluminescence studies... 193
Table 7.4. Excited-state reduction potentials, electrostatic work
terms, and thermodynamic driving forces for the Ru-LLn+ series. ... 200
Table 7.5. Work term and Gibbs free energy change for back
electron transfer. ... 202 Table 8.1. Redox potentials, photophysical properties, pKas, and
tautomer equilibrium constants for the studied salicylic acids and salicylates. ... 219 Table 8.2. Spectroscopic and thermodynamic properties of the Ru-LL
compounds. ... 221 Table 8.3. First ion-pairing equilibrium constants ... 223
Table 8.4. Excited-state reduction potentials, thermodynamic driving force for PCET, diffusional quenching rate constants,
LIST OF SCHEMES
Scheme 2.1. Molecular Structure of the Dye-X (X=Halogen) Series. ... 58
Scheme 4.1. Consecutive ion pairing between Ru2+ and bromide ... 126 Scheme 4.2. Space-filling model of the Ru2+ complex with H atom
labeling where Br− is proposed to interact ... 128 Scheme 5.1. tmam and deeb ligands utilized in this chapter ... 142
Scheme 5.2. Synthetic Procedure for the tmam Ligand. ... 144
Scheme 5.3. Proposed Mechanism for Iodide Photooxidation
by 1, Where N−N = deeb ... 160 Scheme 6.1. Sensitizers and redox mediators ... 172
Scheme 7.1. Ruthenium sensitizers and TTT- utilized in this study
with abbreviations in bold. ... 189 Scheme 8.1. ES-PCET reaction diagram. ES* is the excited sensitizer,
GS- is the reduced sensitizer, R-OH is the protonated substrate, and B
is a base. ... 211 Scheme 8.2. A) Salicylate derivatives and B) Ruthenium sensitizers
utilized in this study. ... 215 Scheme 8.3. Salicylate meta-stable proton-transfer tautomer. The
normal and tautomeric forms are labeled... 217 Scheme 8.4. Generic mechanism for the ES-PCET reaction within
the [Ru-LL4+*,R-SA-] ion pair. Blue arrow shows the proton transfer
and red arrow shows the electron transfer. ... 229 Scheme 8.5. Proposed PTET reaction mechanism within the photoexcited
INTRODUCTION
The Case for Renewables in a Global Energy Policy
In 2017, the United States of America utilized nearly 100 quadrillion btu (British
Thermal Units), or 29 GW h, of energy,1 with about 40% coming from electrical use. Although the United States is one of the largest energy consumers, electrical use in the US is not expected
to grow drastically over the next few decades (15% by 2040). China and India expect large
increases in electrical power consumption, 40% and 70% respectively, by the year 2040.2 In fact, to meet this need, China must add the equivalent of the entire US power system over the
next two decades, while India will need to add a power system as large as the European
Union’s. This rapid growth, which for a few countries may be sustainable through
non-renewable energies, has the potential to occur throughout the entire developing world.
Renewable energy offers a means to readily meet this growing demand.
In 2017 , the United States Department of Energy provided 32.5 billion dollars to fund
clean energy, climate change response, nuclear security, and other applications, as well as
fundamental research into energy technologies.3 The Department of Defense laid out a plan in 2011 to develop and implement renewable energies throughout the military,4 and in 2017 renewed this pledge with a vow to produce 25% of all its energy from renewable sources.5 Explicit details of energy research funding by other US agencies is more difficult to obtain,
however, the development of renewable energy resources is essential for a number of reasons
1.1.1 The detriment of Non-Renewable Fuels
One of the largest pollutants produced from the burning of non-renewable fuels like oil
and coal is carbon dioxide (CO2). As of 2018, CO2 has reached an average of 407 ppm in the
atmosphere, the highest concentration measured in the last 800,000 years.6 In 2017 alone, the US released an estimated 5,000 megatonnes (Mt) (5 x 10¹² kg or 1.1 x 10¹³ lbs) of CO2 into the atmosphere as a byproduct of burning fossil fuels.7 CO2 is known to cause warming through what has been termed the greenhouse effect.8 In 1950, CO2 levels passed 300 ppm for the first time in 400,000 years and have continued to grow, finally exceeding 400 ppm in 2016, Figure
1.1.9 Debate still exists as to whether this increase is responsible for the growing ocean temperatures measured over the past decades; however, it is accepted that if the CO2 production
rate is not stemmed, CO2 will continue to heat the globe. While there is much worry over global
temperature increases, CO2 growth causes other problems as well. The dissolution of CO2 into
the oceans has already lead to increased acidity,10 which will continue to rise with higher CO2 concentrations. Subtle changes in the ocean pH and rising ocean temperatures have led to coral
bleaching and could potentially lead to the mass extinction of many species.10,11
The detriment of non-renewable fuels stretches well beyond CO2 release. The largest
accidental oil spill to date occurred in 1910 near Lakeview, CA, where more than 1.1 million
tons (~9.4 million barrels) of oil were spilled.12 Due to the desolate area of the California High Dessert, the environmental impact was relatively low. However, two more recent incidents,
one in 1989 by Exxon-Valdez and one in 2010 by Deepwater Horizon, spilled more than 210
million gallons of oil (~3.2 million barrels) into the Gulf of Mexico and have had a large effect
on the surrounding environment and economy.13 The Deepwater Horizon spill damaged plant and vegetation over 720 miles of shoreline, led to tens of thousands of avian and marine deaths,
and resulted in the loss of nearly a billion dollars in recreation funds.14 The magnitude of this spill are believed to stem from the more dangerous and demanding requirements for extracting
oil below deeper water.13,15,16
Natural gas has arisen as a cleaner non-renewable fuel and is projected to become an
export of the United States.1 In 2017, natural gas provided around 25% of the total energy consumed by the US.1 It is projected that by 2050 it will rival and potentially surpass petroleum and liquid fuels at 40% of total energy consumption.1 This, however, does not allay environmental concerns, as methane, the major component of natural gas, is invariably released
into the atmosphere when this fuel source is used, Figure 1.1. Although methane is an excellent
source of fuel, it is a highly potent greenhouse gas.17 In fact, the global warming potential of methane is roughly 80x higher than CO2 over the next 20 years. The half-life of atmospheric
methane is shorter than that of CO2, which lowers the relative buildup of methane over long
periods of time, but this only drops the global warming potential of methane to 25x more than
difficulties associated with its handling and transport. As methane is naturally a gas, high
pressures and cooling are used to liquefy, transport, and store this fuel. This leads to the risk
of leaks and large blowouts like the 2015 Aliso Canyon blowout, which released ~100,000
metric tonnes of methane to the atmosphere.19 During the blowout, the methane loss from this single source was comparable to all other methane stores in the US.19
Use of non-renewable fuels is detrimental to the sustainability of the earth. The
concentration of methane and CO2 continue to rise with detrimental effects on the global
climate and animal species. Man-made disasters that occur while obtaining and storing these
fuels are also damaging. Renewable energy sources provide a means to limit non-renewable
use, slow global climate change, and provide national and global energy security.
1.1.2 Solar Energy as a Still Untapped Resource
While unlikely to completely replace fossil fuels in the foreseeable future, renewable
energies could at least provide a means to stall the expansion of non-renewable use. Recently,
countries have taken steps toward reducing carbon emissions with the goal of becoming carbon
neutral. The 2017 Paris Agreement sought to limit the global rise in temperature by providing
means for countries to deal with consumption habits that negatively affect global climate
change.20 Along with this landmark agreement, a few countries have shown the ability to provide close to 100% of their electrical demand through renewable energies . For example,
Costa Rica has produced nearly 100% of its electrical energy from renewable resources, with
a span of 300 straight days at 100% renewable energy in 2017.21 However, this only accounts for 30% of the country’s total energy usage.22 In comparison, the U.S. only produces 11% of
The sun provides approximately 175,000 TW of continuous power to the earth. After
50% is lost due to scattering and absorption by the atmosphere, the remaining energy could be
harvested.24 At this illumination, enough energy is provided in under two hours to meet the entire global energy demand for a year.25 With 10% efficient solar panels, an area the size of South Dakota would provide enough energy to power the entire United States (~3.5 TW).26 With the expected 15% growth in electrical needs for the US and the expected global increase
of nearly 40% over the next two decades, solar energy provides a resource that could easily
meet these new demands with room to continue decades into the future.1,2
Many photovoltaic, or PV, devices have been developed to directly convert sunlight to
electrical energy.27 Multicrystalline silicon currently dominates the photovoltaic market with prices around $0.30/W28 and efficiencies between 15 and 19%.29 The theoretical limit to single junction solar cells is 33%.30 Multijunction cells have surpassed this theoretical limit, but cost limitations exist in these devices. One of the major losses in silicon solar cells is the loss of
efficiency in low light conditions, such as on cloudy days or indoor. Because of this limitation,
they work best away from the large cities where they are needed most, and instead are installed
in areas that get many days of uninterrupted sun.
One particular device that has the potential to be directly integrated into existing
structures is the dye-sensitized solar cell (DSSC).31 Unlike silicon solar panels, which typically absorb light throughout the entire visible region, DSSCs utilize light absorbing molecules that
global renewable energy commodity. The workings of DSSCs will be developed in Section
1.2.
Figure 1.2. SONY prototype of a DSSC. The fan is powered by DSSC produced electricity. Taken from ref 32.
One of the largest detriments in direct sunlight to electricity conversion is the nature of
the night and day cycle, which limits solar energy production during peak usage hours in the
evening. Therefore, it is necessary to store solar energy so that it can be utilized at night. Many
avenues are being pursued in this regard including batteries, pumped hydroelectric, and the
coupling of sunlight to fuel production.25,34 One device for the latter that is closely related to the DSSC, is the dye-sensitized photoelectrosynthesis or photoelectrochemical cells (both
abbreviated DSPECs). The DSPEC uses light to oxidize water to oxygen and reduce hydrogen
or CO2 to produce fuels.35,36 These fuels can then be utilized in times of high energy demand or in applications not suitable for light to electrical systems.
One key difference between the DSSC and other photovoltaic technologies is the use
of molecules (sensitizers) to harvest sunlight and initiate charge transfer in the device. The
multiple electron transfers between the solid electrode and the sensitizers are key processes
that must be optimized in efficient devices. Overall, there are at least five different
is to develop the fundamental knowledge required to control these electron-transfer reactions.
The over-arching question this thesis addresses is: how can non-covalent interactions be utilized to control and enhance electron-transfer chemistry? Much of the work is focused around the DSSC, either directly at sensitized semiconductors or through model systems in
fluid solution.
Below, the dye-sensitized solar cell will be explored more deeply (Section 1.2). Care
was taken to focus on the light absorbing sensitizers, redox mediators, and reactions pertinent
to this thesis. Non-covalent interactions (Section 1.3) will be introduced and discussed with a
focus on halogen bonding, electrostatics, and hard-soft acid bases. As all solar devices deal
with the movement of electrons, so do the reactions important to this thesis. Electron-transfer
theory and the techniques used to study this chemistry will be described (Section 1.4).
The Dye-Sensitized Solar Cell
The DSSC, Figure 1.3, was first realized to have practical utility in 1991 when Grätzel
and O’Regan reported the use of sensitized high surface area, mesoporous nanocrystalline TiO2
(anatase) thin films.37 The 3.2 eV band-gap of TiO2 does not absorb visible light, which is instead accomplished with sensitizers anchored to the semiconductor surface that do absorb
visible light. The use of the mesoporous nanocrystalline film, Figure 1.3, facilitated greater
light absorption without the loss of electron collection efficiency revolutionizing the field.37,38 The optimized device had a reported efficiency of 7%37 and initiated rapid growth in the study of DSSCs. However, efficiencies grew slowly over the next two decades and only reached 10%
by the late 2000s. Recently, the advent of optimized sensitizers and redox mediators have led
to more significant advances with the highest efficiency devices now reaching 14% in the
Figure 1.3. A) Schematic of the DSSC showing the beneficial (green arrows) and detrimental (red arrows) processes. 1) Light absorption/excitation, 2) electron injection, 3) reduction of the redox mediator (M+) at counter electrode, 4) regeneration of the oxidized sensitizer, 5) back-electron transfer, and 6) charge recombination. B) SEM image of the mesoporous, nanocrystalline TiO2 semiconductor utilized for DSSCs. Taken from ref 38.
While the DSSC has struggled to reach efficiencies that rival those of its crystalline
counterparts (silicon, CdTe, etc.), it has found a niche market for use in low-light and indoor
settings.42,43 In fact, device efficiency is sometimes higher under diffuse illumination as was seen in the initial 1991 study (12% in diffuse vs. 7% in direct sunlight).42,44 Therefore, DSSCs have a practical application in the powering of small scale electronics and indoor energy
reclamation.43,44 While present DSSCs are unlikely to replace silicon as the major solar energy provider, they will likely play a niche role in the development of energy sustainability.
1.2.1 General Overview of the Processes in the DSSC
This section will detail the processes within the DSSC, with a focus on the chemical
reactions studied in this thesis. Figure 1.3 shows a schematic drawing of a DSSC. An incident
photon excites a sensitizer (S) anchored to a wide band-gap semiconductor, in many cases
titanium dioxide, TiO2, Equation 1.1. The excited sensitizer (S*) then injects an electron into
the acceptor states, or conduction band, of the semiconductor, Equation 1.2, oxidizing the
conductive oxide (TCO) electrode and used for useful work. The oxidized sensitizer is then
reduced back to its initial state by a redox mediator (M) in an electrolyte solution. This reaction,
termed regeneration, ideally occurs rapidly after electron injection, Equation 1.3. Finally, the
oxidized redox mediator is reduced at a counter electron, typically Pt. Overall, no net chemistry
occurs in the solar cell.31,33,38,45–47
Equation 1.1. Excitation
𝑇𝑖𝑂2/𝑆𝑜+ ℎ𝜈 → 𝑇𝑖𝑂2/𝑆∗
Equation 1.2. Injection
𝑇𝑖𝑂2/𝑆∗ → 𝑇𝑖𝑂2(𝑒−)/𝑆+
Equation 1.3. Regeneration
𝑇𝑖𝑂2(𝑒−)/𝑆++ 𝑀𝑛 → 𝑇𝑖𝑂2(𝑒−)/𝑆𝑜+ 𝑀𝑛+1
The efficiency (η) of a DSSC can be defined by the open-circuit voltage (VOC),
short-circuit current density (JSC), and fill factor (FF), with knowledge of the of the incident light
irradiance (ρo), Equation 1.4. These data are presented as a traditional current-voltage curve,
Figure 1.4. In an ideal solar cell, the FF is 1 and the total power of the device occurs at JSC*VOC.31,33
Equation 1.4. Solar device efficiency
𝜂 = 𝐽𝑆𝐶𝑉𝑂𝐶𝐹𝐹
𝜌𝑜
The magnitude of the JSC may be limited by the sensitizer light harvesting efficiency
(LHE), the excited-state injection quantum yield (∅inj), and the yield of injected electrons
collected in the external circuit (∅inj), Equation 1.5. A few examples of champion sensitizers
are shown in Figure 1.5. These sensitizers have injection yields of 100% and typically absorb
extinction coefficients (> 104 M-1 cm-1). The incident photon-to-current efficiencies, i.e. the efficiency by which each incident photon is converted into a collected electron, is near 100%
when corrected for competitive light absorption by the TCO supports.
Equation 1.5. Short-circuit current efficiency
𝐽𝑆𝐶(%) = ∅𝑖𝑛𝑗∅𝑐𝑜𝑙𝑙𝐿𝐻𝐸 ∗ 100
Figure 1.4. Representative current density-voltage curve, gray, and apparent power, red, plots. The short circuit current density (JSC) and open-circuit voltage (VOC) are marked along the current density-voltage curve. The intersection of the blue, dashed lines (JSC * VOC) is the maximum theoretical power, given a fill factor of 1, whereas the intersection of the green, dotted lines is the actual device point of max power (simulated FF = 0.61).
Ignoring ohmic contact loses, VOC is defined as the difference in the quasi-Fermi level
of the illuminated thin-film semiconductor and the counter electrode. The VOC of solar devices
has been defined by the diode equation, Equation 1.6, which relates the VOC to the
electron-injection flux (Iinj) divided by the sum of the detrimental reaction rates (nki[A]i, where n is the
number of electrons, ki is a rate constant, and [A]i is the concentration of acceptors).48 Some of the largest losses in the DSSC come from detrimental back reactions (red arrows in Figure
1.3A) that occur under illumination. These reactions include the transfer of the injected
0.0 0.1 0.2 0.3 0.4 0.5
0 -1 -2 -3 -4 -5 Voltage (V) Current Density (mA cm -2 ) JSC VOC JMP VMP 0.0 -0.5 -1.0 -1.5 -2.0 -2.5 -3.0
electron back to the oxidized dye (back-electron transfer, or BET) or to the redox mediator
(charge recombination), as seen in Equation 1.7 and Equation 1.8.33,47,49 Hence, much research has focused on preventing these unfavorable reactions.31,45,46 Attempts to prevent charge recombination through sensitizer or redox mediator modification have been reasonably
successful, with either the introduction of hydrophobic alkyl chains50,51 or the use of electrostatics52,53 to block access of the redox mediator to the TiO2 interface. As the back reaction is in direct competition with the regeneration reaction, many have suggested the best
way to prevent BET is to enhance regeneration, as is detailed in Section 1.2.3. Of pertinence
to chapter 3, core-shell semiconductors have been utilized to slow BET and charge
recombination by multiple orders of magnitude.54,55
Equation 1.6. Diode equation
𝑉𝑂𝐶 = (𝑘𝑇 𝑒) ln (
𝐼𝑖𝑛𝑗
𝑛 ∑ 𝑘𝑖[𝐴]𝑖)
Equation 1.7. Back-electron transfer
𝑇𝑖𝑂2(𝑒−)/𝑆+ → 𝑇𝑖𝑂2/𝑆𝑜
Equation 1.8. Charge recombination
𝑇𝑖𝑂2(𝑒−)/𝑆𝑜+ 𝑀𝑛+1 → 𝑇𝑖𝑂
2/𝑆𝑜+ 𝑀𝑛
1.2.2 Sensitizers for the DSSC
A key component of the DSSC is the sensitizer. Wide band-gap semiconductors
typically absorb less than 3% of the visible solar spectrum, and therefore most light absorption
aqueous stability. Recently, electrochemical grafting has shown promise towards increased
stability under alkali conditions.57,58
Many styles of DSSC sensitizers exist. These include transition metals, organic
donor-acceptor molecules, semiconductor quantum dots, and organic pigments.33 A few examples of champion molecular sensitizers are shown in Figure 1.5. In this thesis, two types of sensitizers
are featured: ruthenium polypyridyl and donor-π-bridge-acceptor (D-π-A) sensitizers. These
sensitizers have one key characteristic in common; intramolecular charge transfer that vectorially shifts electron density towards the semiconductor surface. The charge separation
distance is increased by excited-state electron injection and regeneration, slowing detrimental
recombination processes.
Figure 1.5. Examples of champion sensitizers, push-pull porphyrin YD2-o-C8,40 donor-π-bridge-acceptor C218,59 and transition metal based Z907.60
D-π-A sensitizers are composed of an acceptor, which also serves as the anchor group,
transfer from the donor to the acceptor positions the electron proximate to the semiconductor
interface facilitating facile injection, Figure 1.6. The D-π-A motif allows interchangeability
within the sensitizer, and many styles have been developed.61,62 Particular to this thesis is the triphenylamine (TPA) donor coupled through a thiophene bridge to a cyanoacrylate
acceptor.63,64 These TPA compounds are orange, with a strong visible absorption in the range of 400-500 nm. Upon excitation and injection of an electron, the oxidized sensitizers lose the
charge-transfer absorbance, which is instead replaced with a sharp TPA centered absorbance
near 650 nm. This absorbance of the oxidized sensitizer allows the many interfacial reactions
to be spectroscopically monitored.
Figure 1.6. D-π-A sensitizer. Arrows show the intramolecular charge transfer and injection (inj) processes.
1.2.2.1Ruthenium Polypyridyl Compounds
Ruthenium polypyridyl compounds, Figure 1.7, compose a wealth of the sensitizers
utilized in fundamental studies of DSSCs and in solution electron-transfer chemistry.31 These sensitizers exhibit strong absorption features between 200 and 600 nm. Ligand-centered (LC)
transitions are observed in the UV-region, whereas metal-to-ligand charge-transfer (MLCT)
facilitates rapid intersystem crossing (~300 fs) to the relaxed triplet MLCT (3MLCT) excited state, Figure 1.7.66 In this 3MLCT excited state, the ruthenium(II) metal center is formally oxidized to RuIII and one of the polypyridyl ligands is reduced by one electron, Equation 1.9.67 In fluid solution, excited-state relaxation to the ground state is radiative and results in room
temperature photoluminescence, Equation 1.10. The photoluminescence quantum yields are
typically 4-12%, with lifetimes that range between 200 ns – 2 μs dependent on the energy
separation between the ground and excited state.67 The relative stability along with the long-lived excited states make these compounds excellent for fundamental studies.
Equation 1.9. Excitation of ruthenium polypyridyl compounds
[RuII(bpy)3]2+ hυ
→ [RuIII(bpy−)(bpy)2]2+∗
Equation 1.10. Photoluminescence from ruthenium polypyridyl compounds
[RuIII(bpy−)(bpy)2]2+∗ hυ→ [RuII(bpy)3]2+
Figure 1.7. Schematic of light excitation to the 3MLCT absorption of [Ru(bpy)3]2+.
The predominant reason ruthenium polypyridyl complexes are commonly used as
sensitizers and in electron-transfer studies is that the excited-state reduction potentials can be
relative to the ground state. Therefore, upon light absorption the complex is both a stronger
reductant and a stronger oxidant, Figure 1.8A.
Due to the increased oxidizing and reducing power of the ruthenium excited state,
quenching can proceed through photoinduced oxidative electron-transfer quenching, Equation
1.11, and reductive electron-transfer quenching, Equation 1.12. Oxidative quenching occurs
when the excited state transfers an electron to an acceptor (A), which forms the oxidized
ruthenium compound. Reductive quenching proceeds through electron transfer to the excited
state to form the reduced ruthenium compound. This reaction, which is the formal reduction of
the RuIII metal center by a donor (D), mimics the regeneration reaction in DSSCs Figure 1.8. Such excited-state reductive quenching has been utilized in this thesis (Chapters 4, 5, and 7)
as a model for thermal electron transfer and removes the heterogenous nature of the interface
from the analysis, which facilitates mechanistic studies of the regeneration mechanism(s).
Equation 1.11. Oxidative electron-transfer quenching
[𝑅𝑢𝐼𝐼𝐼(𝑏𝑝𝑦)
2(𝑏𝑝𝑦−)]2++ 𝐴 → [𝑅𝑢𝐼𝐼𝐼(𝑏𝑝𝑦)3]3++ 𝐴−
Equation 1.12. Reductive electron-transfer quenching
[𝑅𝑢𝐼𝐼𝐼(𝑏𝑝𝑦)
Figure 1.8. A) Shift in the frontier molecular orbitals for reduction and oxidation between the ground and excited states of ruthenium sensitizers. B) Comparison of the regeneration mechanism and reductive quenching mechanism of a photoexcited ruthenium compound.
1.2.3 Regeneration and the β-LUSO
Due to reports of nearly quantitative incident photon-to-current conversion under
short-circuit conditions, the regeneration reaction in the DSSC was thought to be optimized,
Equation 1.3 and Figure 1.8B. However, as has been noted by Hu68 and Wang69, at higher photovoltages both charge recombination and BET increase in rate such that BET can become
competitive with regeneration.68,69 This occurs predominantly near the power point and open-circuit conditions when the concentration of electrons is high. This is an important point as it
identifies regeneration as a key process to optimize if device efficiency is to be maximized.
Regeneration occurs through electron transfer from the redox mediator to the oxidized
sensitizer. The frontier molecular orbitals, which govern the regeneration reaction, are the
highest occupied molecular orbital (HOMO) on the redox mediator, and the lowest unoccupied
beta-spin orbital (β-LUSO) on the oxidized sensitizer. Figure 1.9 shows the density functional theory calculated β-LUSO for a D-π-A sensitizer and a ruthenium sensitizer. The β-LUSO is
the molecular orbital which accepts the electron from the redox mediator. In the classic
delocalization of the orbital onto the ligands.63,64,68,70,71 For electron-transfer reactions, this can be highly beneficial as enhanced orbital overlap between the redox mediators in solution and
the β-LUSO will increase the regeneration rate. Density functional theory has been a powerful
tool in the analysis of the β-LUSO and its importance to regeneration.64,68,70–72 The ability to
design sensitizers with finite control over the molecular overlap and electronic coupling
between the β-LUSO and the redox mediator would allow control over the regeneration reaction.
Figure 1.9. A) Schematic showing the β-LUSO for an oxidized sensitizer (S+) at the TiO2 interface. B) and C) show the orbital density of the β-LUSO for two different sensitizers. The green arrow in B) and C) shows the regeneration reaction for iodide across the β-LUSO.
Another key property to consider is the thermodynamic driving force for regeneration.
This driving force should be small to minimize free energy losses. However, as described by
semi-classical Marcus theory, the lowered driving force slows down regeneration and allows
more of the injected electrons to recombine with the oxidized sensitizer. A few researchers
have investigated the driving force dependence of regeneration at the interface of TiO2, and
their results support that regeneration is well described by Marcus theory.73–75 However, as typifies diffusional bimolecular reactions, the rate constants eventually plateau at higher
Equation 1.13 shows the relation between the regeneration rate constant, kreg, and the
diffusion and electron-transfer rate constants, kdiff and kET respectively. KA is the association constant between the oxidized sensitizer and redox mediator.77 If kET is larger than kdiff, the diffusion limit is reached and 1/kreg = 1/kdiff. At lower driving forces or smaller electron-transfer
rate constants, KAkET is smalller than kdiff and 1/kreg = 1/KAkET. In the DSSC, diffusion limits
the regeneration reaction when a large electron-transfer driving force is present between the
redox mediator and the oxidized sensitizer. However, to improve photovoltage, lower driving
forces are typically utilized, which lowers kET and in turn the regeneration rate constant.78,79 Also, the use of viscous solvents lowers the diffusion limit and can seriously hinder
regeneration.47,49,
Equation 1.13. Electron transfer and diffusion rate constants
1 𝑘𝑟𝑒𝑔 =
1 𝑘𝑑𝑖𝑓𝑓+
1 𝐾𝐴𝑘𝐸𝑇
Based on the above discussion, it would be best to identify mediators in which the
maximum regeneration rate occurs with small free energy changes. In the rare studies that have
attempted to investigate this driving force dependence, a couple of broad conclusions were
reached.73–75 For a series of ferrocene derivatives, Daeneke et al. determined that the ideal driving force for maximizing regeneration (kreg = 5 x 10⁸ M-1 s-1) was 400 mV.73 A higher driving force did not benefit regeneration and instead lowered the DSSC photovoltage. In a
similar study, Feldt et al. suggested that with cobalt complexes, the maximum rate constant
was achieved with a driving forces between 0.7 – 1 V.74,75 However, DSSC’s fabricated with mediators that support lower driving forces for sensitizer regeneration still do produce
Mass transport of the mediator to the oxidized sensitizer can be slow in viscous
solutions or with redox mediators that are not highly soluble.78 This thesis seeks to enhance regeneration beyond mass transport limitations through the pre-association of the redox
mediator with the ground-state sensitizer through non-covalent interactions. This
pre-associated complex upon light excitation could undergo regeneration limited only by the rate
constant for electron transfer, which in carefully designed systems could reach 1012 s-1. These ideas will be developed further in section 1.4 after a discussion of the typical redox mediators
used in the DSSC.
1.2.4 Redox Mediators
Until recently, the triiodide/iodide redox mediator (I3-/I-) was the most prevalently used and held the highest efficiency for DSSCs.31,33,46,47 Other halide, pseudo-halide, and main group redox mediators have been utilized in attempts to replace I3-/I-, however none have surpassed the efficiencies reached with I-/I3-.47 Due to the complex redox chemistry and corrosive nature of iodide, simpler single electron-transfer redox mediators have been
developed which incorporate transition metals like cobalt and iron.47 Cobalt based redox mediators have been the target of intense investigation because of their low cost, ease of
preparation, and high DSSC efficiencies.41,47,49,80
1.2.4.1Halide Redox Mediators
The I3-/I- redox mediator is by far the most utilized redox mediator in DSSCs. However, due to the mechanistic complexity of its redox reactions, many processes with this mediator at
the interface are still only superficially understood. One of the many difficulties with the iodide
redox mediator is that only two electron processes occur at a metal electrode. Photomodulated
potential for iodide.81,82 However, most of the redox potentials are calculated from Latimer diagrams with kinetic data from pulse-radiolysis experiments.83 The known redox potentials for iodide are shown in Figure 1.10.84 For both regeneration and recombination, there are multiple reaction pathways that exist, and, in both cases, it is not well known which mechanism
is dominant. Below, the mechanisms for regeneration will be discussed in detail.
Figure 1.10. Formal reduction potentials for iodide in acetonitrile (CH3CN) solution. Green bars are the one electron reduction potentials, and the red bar (0.35 V) is the two-electron reduction of triiodide that occurs at the counter electrode. A reasonable position for the acceptor states and range of RuIII/II redox potentials are also shown. Known redox potentials for bromide and chloride-based electrolytes are shown with purple bars, and the orange fading in the RuIII/II region shows the needed increase in oxidizing potential. All redox potentials are reported vs. NHE and are in CH3CN except where mentioned.
Two mechanisms have been proposed for the one-electron oxidation of iodide. In the
single-atom pathway, iodide is oxidized to the iodine atom, Equation 1.14. In the concerted
pathway, bond formation is concurrent with iodide oxidation to produce the diiodide radical
anion, Equation 1.15.85,86 The concerted pathway was proposed by David Stanbury85 and Gwyneth Nord86, who, through multiple stopped-flow experiments, have suggested that at high iodide concentration the concerted mechanism dominates iodide reactivity. Both the concerted
diiodide as a primary product, the single-atom pathway forms diiodide through a secondary
reaction between the iodine atom and another iodide in solution, Equation 1.16.87 Diiodide anions are unstable with respect to disproportionation, and therefore form triiodide and an
iodide anion, as seen in Equation 1.17.88,89
Equation 1.14. Single-atom pathway
𝐼− → 𝐼•+ 𝑒−
Equation 1.15. Concerted pathway
2𝐼− → 𝐼2•−+ 𝑒−
Equation 1.16. Diiodide formation
𝐼•+ 𝐼− → 𝐼 2•−
Equation 1.17. Diiodide disproportionation
2𝐼2•− → 𝐼3−+ 𝐼−
It is still unknown which of these mechanisms plays the largest role in regeneration. In
the case where the driving force is favorable for the single-atom pathway, it would be expected
that this mechanism would prevail. While the concerted pathway may be favored by 300 mV,
the termolecular nature of the reaction suggests that kinetics favors the single-atom pathway.
In cases where the single-atom pathway is disfavored it has been claimed that the reaction will
proceed through the concerted reaction.33,46 However, beyond studies in the stopped-flow literature there exists no direct evidence for this reaction to occur either in solution or at the
interface. One study argued that the observation of a pre-association between iodide and the
oxidized ruthenium sensitizer showed that the concerted mechanism was active.90 However, this was only observed in one of the four sensitizers studied. Computational and experimental

![Figure 1.7. Schematic of light excitation to the 3 MLCT absorption of [Ru(bpy) 3 ] 2+](https://thumb-us.123doks.com/thumbv2/123dok_us/8264375.2189388/37.918.140.546.574.800/figure-schematic-light-excitation-mlct-absorption-ru-bpy.webp)