THE TRAJECTORY OF DISTRESS TOLERANCE FOLLOWING SUBSTANCE USE TREATMENT
Elizabeth Danielle Reese
A thesis submitted to the faculty at the University of North Carolina at Chapel Hill in partial fulfillment of the requirements for the degree of Master of Arts in the Department of Psychology
and Neuroscience in the University of North Carolina at Chapel Hill.
Chapel Hill 2017
Approved by: Stacey B. Daughters Jonathan S. Abramowitz
ii © 2017
iii ABSTRACT
Elizabeth Danielle Reese: The Trajectory of Distress Tolerance Following Substance Use Treatment
(Under the direction of Stacey B. Daughters)
Distress tolerance (DT), defined separately as the actual or perceived ability to withstand aversive affective states, has been linked to problematic substance use behavior within
nonclinical samples and treatment outcome among those with substance use disorders. Thus, DT may represent an important risk factor for substance use relapse, and has been evaluated as a target of substance use treatment. However, the longitudinal trajectory of DT among treatment seeking substance users remains unknown. The aims of the current study were to (a) characterize trajectories of perceived DT, assessed via self-report, and behavioral DT, assessed using a behavioral task, and (b) evaluate the influence of abstinence duration and frequency of use as predictors of DT change in a sample of residential treatment seeking substance users. Results of latent curve model analyses revealed that both perceived and behavioral DT improved
nonlinearly over time. Additionally, abstinence duration was associated with greater
iv
ACKNOWLEDGEMENTS
Thank you to my committee members, Stacey Daughters, Jon Abramowitz, and Daniel Bauer. In addition, thank you to Deepika Anand and Chris Conway for consultation and
v
TABLE OF CONTENTS
LIST OF TABLES ... vii
LIST OF FIGURES ... viii
LIST OF ABBREVIATIONS ... ix
CHAPTER 1: INTRODUCTION ...1
DT change in substance users ...2
Current study ...4
CHAPTER 2: METHODS ...5
Participants ...5
Procedure ...5
Measures ...6
Sample Characteristics ...6
Mirror Tracing Persistence Test—Computerized Version ...6
Distress Tolerance Scale ...7
Timeline Follow-Back ...8
Statistical Analysis ...9
CHAPTER 3: RESULTS ...13
vi
Power Analysis ...15
Longitudinal Measurement Invariance of DTS ...16
Unconditional Models of Perceived and Behavioral DT ...17
Model Comparison...17
Parameter Estimates ...20
Conditional Models of Perceived and Behavioral DT ...22
Time-invariant Covariate: Abstinence Duration ...24
Time-varying Covariate: Frequency of Use ...26
CHAPTER 4: DISCUSSION ...27
vii
LIST OF TABLES
Table
1. Associations of participant characteristics and DT at pre-treatment ...20 2. Means, standard deviations, and bivariate correlations among repeated
measures of DT ... 21
3. Unstandardized factor loadings and parameter estimates from unconditional
viii
LIST OF FIGURES
Figure 1 - Latent growth curve model examining change trajectory of perceived
and behavioral DT...26 Figure 2 - Observed and model estimated sample means for (a) perceived DT
estimated using total DTS scores and (b) behavioral DT estimated using task persistence time in minutes on the MTPT-C. Both figures show sample means (observed and model estimated) from DT
repeated measures administered at five time points from pre-treatment
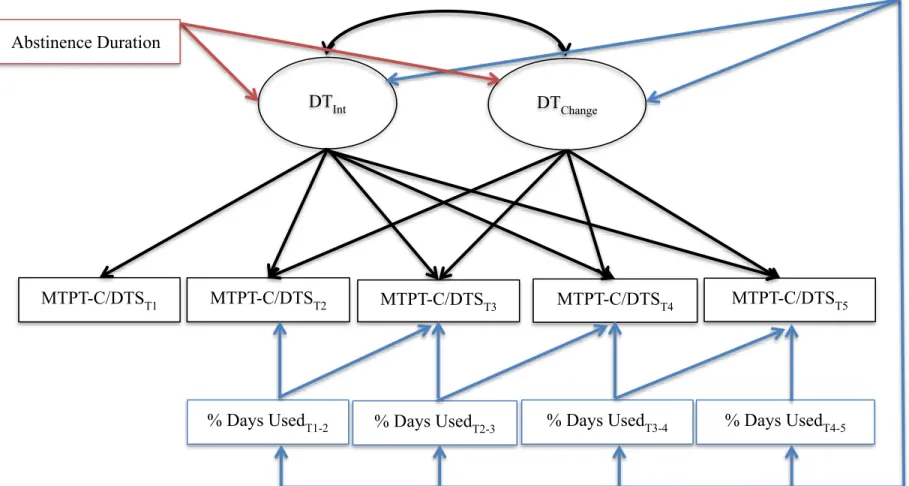
to 12-months post-treatment. ...27 Figure 3 - Latent growth curve model examining the association of weeks to
first use (red) and the influence of time-specific percentage of days
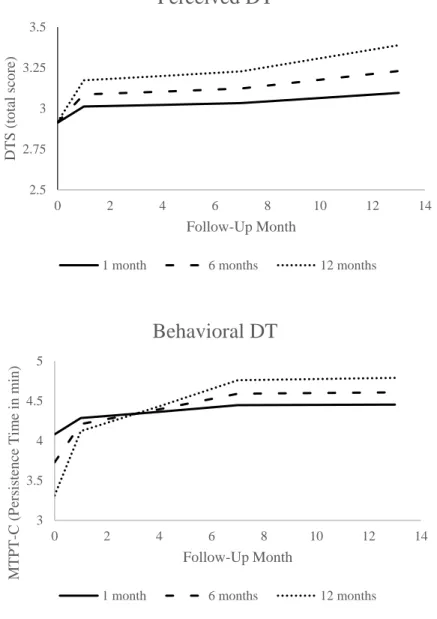
used (blue) on the change trajectory of perceived and behavioral DT ...30 Figure 4 - Model estimated trajectory of (a) perceived DT and (b) behavioral
DT at specified levels of abstinence duration, a time-invariant
predictor. Specifically, the figure shows both perceived and behavioral DT latent trajectory when abstinence duration is equal to 4 weeks
ix
LIST OF ABBREVIATIONS
CFI Comparative fit index
DSM-IV Diagnostic and statistical manual - fourth edition DT Distress tolerance
DTS Distress tolerance scale
KS Kolmogorov-Smirnov test of normality LCM Latent curve model
MTPT-C Mirror tracing persistence task - computerized version PASAT Paced auditory serial addition task
RMSEA Root-mean square error of approximation
SCID-NP Structured clinical interview for DSM disorders - non-patient edition SRMR Standardized root-mean-square residual
1
CHAPTER 1: INTRODUCTION
The negative reinforcement theory of addiction maintains that substance use functions to alleviate the aversive physiological and affective symptoms associated with withdrawal from substance use (Baker, Piper, McCarthy, Majeskie, & Fiore, 2004; Koob & Le Moal, 1997), thereby providing increased motivation for repeated use (Koob & LeMoal, 2001). To test this theory, researchers have quantified an individual’s distress tolerance (DT), operationalized both as behavioral capacity to persist towards a goal despite psychological or physical discomfort (behavioral DT; e.g., completing a difficult task in order to obtain reward), or as an individual’s perceived capacity to withstand aversive physical or psychological states (perceived DT). In doing so, substance use researchers can use DT as the conceptual approximation of a substance user’s ability to remain abstinent, a difficult undertaking that treatment-seeking substance users are highly motivated to pursue despite aversive physical or psychological states present in the early stages of abstinence (i.e., during withdrawal from substances). In support of this
2
and as such, DT-specific interventions have been developed and evaluated for SUD and show promising results (e.g., Bornovalova, Gratz, Daughters, Hunt, & Lejuez, 2012; Brown et al., 2008; Brown et al., 2013). Despite such promising work, methodologically relevant concerns prohibit a comprehensive understanding of DT within this population. Specifically, research investigating the associations of DT and substance use originates from both self-report (e.g., Distress Tolerance Scale; Simons & Gaher, 2005 ; Discomfort Intolerance Scale; Schmidt, Richey, & Fitzpatrick, 2006) and behavioral measures (e.g., Paced Auditory Serial Addition Task- PASAT; Lejuez, Kahler, & Brown, 2003; Mirror Tracing Persistence Task-Computerized Version MTPT-C; Daughters et al., 2005), which are thought to represent fundamentally
separable constructs as they are repeatedly weakly correlated with one another across studies (Glassman et al., 2015; Kiselica, Rojas, Bornovalova, & Dube, 2015; McHugh et al., 2011). In addition, there is not clear consensus among researchers if an individual’s perceived and actual ability to tolerate distress (hereafter referred to respectively as perceived and behavioral DT) represent temporally stable constructs versus malleable mechanisms of change leading to improvement in SUD treatment outcome (Leyro, Zvolensky, & Bernstein, 2010; Zvolensky, Vujanovic, Bernstein, & Leyro, 2010).
DT change in substance users
DT treatment studies provide some evidence for the malleability of DT, both perceived and behavioral, among substance users. In line with the negative reinforcement theory of addiction, DT treatments work to provide individuals with skills to tolerate aversive
3
individuals suggested an increase in perceived DT with DT-targeted treatment (Brown et al., 2014). Such evidence is preliminary and focused on change specifically related to DT-targeted treatment. However, the extent to which DT naturally changes over time among substance users remains unknown. Relatedly, the dearth of information within DT treatment studies on DT change as a result of targeted treatment and the relationship between this change and substance use is notable. In particular, it’s unclear how both perceived and behavioral DT change may relate to important aspects of substance use, specifically abstinence duration and severity of continued substance use within this population.
Fortunately, related work can inform theoretically based, data driven hypotheses concerning these processes. For example, research suggests multiple cognitive and
4
monitoring and response inhibition (for review, see Garavan, Brennan, Hester, & Whelan, 2013). Taken together research suggests that substance use influences both cognitive and
neurobiological processes underlying DT, while abstinence allows for the recovery of such processes. Thus, it is likely that the trajectory of DT change among substance users may be influenced by multiple factors, including abstinence and severity of use.
Current Study
As such, the aims of the current study were twofold. First, we sought to examine the natural temporal trajectory of perceived and behavioral DT among residential treatment seeking substance users at five assessment time points from pretreatment to 12-months post treatment. We hypothesized that both perceived and behavioral DT would increase over time. Second, we wanted to examine the influence of both abstinence and severity of substance use on the
5
CHAPTER 2: METHODS
Participants
The study sample consisted of 263 individuals receiving residential substance use treatment in a large urban area. Of these, 70.7% (n = 186) were male, 94.73% were African American (n = 249), 3% Caucasian (n = 8), 1.9% Native American/American Indian (n = 5) and 0.4% Asian (n = 1). Additionally, 192 (73%) individuals had at least a high school education or GED, and 213 (80.99%) were unemployed. The mean age of the sample was 42.68 years (SD = 11.76). Current DSM-IV substance dependence diagnoses included cocaine (n = 86; 32.70%) alcohol (n = 81; 30.80%), hallucinogen (n = 37, 14.07%), opioid (n = 31; 11.79%), marijuana (n = 28; 10.65%), and sedative (n = 2; 0.8%) with 25.1% (n = 66) meeting dependence criteria for more than one substance.
Procedure
Data for this study was part of a larger project assessing the efficacy of a behavioral activation treatment for substance use as compared to a contact time matched control condition (Daughters et al., 2017). Adults between the ages of 18 and 65 years of age were approached by research staff and assessed for study eligibility within one week of treatment entry. Participants were excluded if they (1) endorsed current psychotic symptoms, (2) evidenced impaired
6
condition (i.e., behavioral activation versus supportive counseling). Detailed study recruitment, flow, screening, and randomization procedures are published elsewhere (Daughters et al., 2017).
Study assessments occurred at pretreatment (T1), discharge from treatment (T2), 3-months
post-treatment (T3), 6-months post-treatment (T4), and 12-months post-treatment (T5).
Assessments consisted of interview, self-report, and computerized behavioral tasks. Upon completion of each assessment, participants were debriefed and compensated for study
participation. All study-related procedures were approved by the University Institutional Review Board.
Measures
Sample Characteristics
During the pre-treatment assessment, all participants completed a self-report
demographic questionnaire to assess age, sex, ethnicity, education, and employment status. In addition, DSM-IV substance dependence was assessed at pre-treatment using the SCID-NP (First, Spitzer, Gibbon & Williams, 1995).
7
through the four rounds. In the initial, easy phase, participants are asked to move the red dot along a star with a wide border until the tracing is complete. This level lasts for two minutes and difficulty level is titrated such that once the participant completes a star tracing, the border of the next star decreases in width until the allotted two minutes have elapsed. The next level of the task lasts for two minutes, and skill level during this phase of the task is dependent on participant performance in the first phase of the task. The same general procedure is used in the third phase of the task; however, the star’s line width is calibrated to a difficulty level that exceeds the participant’s performance on the previous round. This level lasts for one minute and is intended to induce distress. In the final phase, participants are shown a star identical to the one presented in the third phase, but unlike the previous phases, participants are given the option to end the task at any time by pressing a key on the computer keyboard. At the same time, participants are reminded that performance on this final phase dictates how much money they receive for study participation. All participants work independently on the task until voluntary task termination during the final phase or until the task self-terminates at the maximum 7-minute time limit. Behavioral DT was calculated as the latency (in minutes) to task termination on the final phase of this task.
Distress Tolerance Scale (DTS; Simons & Gaher, 2005)
8
e.g., “My feelings of distress or being upset are not acceptable”), how much attention is absorbed by the distress (Absorption subscale, e.g., “My feelings of distress are so intense that they
completely take over”), and effort expended to alleviate distress (Regulation subscale, e.g., “I’ll do anything to avoid feeling distressed or upset”). Scores on items in each subscale were meaned to create each subscale score. Subscale scores were then averaged to yield a DTS mean item score. The DTS demonstrated good internal consistency in the current study (α> .88 across all assessment time points), which is in line with previous studies (e.g., Hasan et al, 2015; Leyro, Bernstein, Vujanovic, McLeish, & Zvolensky, 2011; Vujanovic et al., 2017).
Timeline Follow-Back (TLFB; Sobell, Maisto, Sobell, & Cooper, 1979)
The TLFB is an interviewer-administered measure assessing substance use in calendar format. An interviewer guides participants through recollection of day-by-day substance use in reverse order, beginning with the current assessment date and working backwards until the time of last assessment. The interviewer prompts participant’s recollection of use with meaningful events such as birthdays, payday, weekend festivities and holidays that may have occurred over the time interval in question. This measure demonstrates high test-retest reliability, convergent and discriminant validity, and agreement with collateral reports of substance use and urinalyses (Fals-Stewart, O'farrell, Freitas, McFarlin, & Rutigliano, 2000). Data acquired from the TLFB was used in the current study to determine 1) abstinence duration, defined as the number of weeks from pre-treatment assessment until first substance use and 2) frequency of substance use, defined as the percent of substance use days in the total days occurring between assessment time points, specifically between pre-treatment and residential discharge (T1-2), residential discharge
and 3-months post-treatment (T2-3), 3-months and 6-months post-treatment (T3-4), and 6-months
9
conservatively considered relapsed, and in those cases abstinence was coded as the time elapsed between pre-treatment and the last attended assessment. For individuals who remained abstinent throughout the study period, abstinence was coded as the time elapsed between pre-treatment (T1) and 12-month post-treatment (T5) assessments.
Statistical Analysis
Perceived and behavioral DT trajectories from pre-treatment (T1)to 12-months
post-treatment (T5) were assessed separately using latent curve models (LCMs). LCM is a particularly
useful analytic tool for large data sets with partially missing data that provides higher levels of statistical power than are available with traditional longitudinal analytic methods (e.g., repeated measures analysis of variance). In addition, LCM can accommodate unequal spacing between time points and allow for the inclusion of both time-invariant and time-varying predictors (Bollen & Curran, 2006). The LCM framework typically includes intercept and slope factors (collectively called growth factors), whose means define the estimated average trajectory of a sample outcome. Variability in these growth factors can also be examined to understand individual differences in the shape of change over time.
10
to evaluate measurement invariance for behavioral DT, as the measure used was persistence time, a “one-item” behavioral variable.
To determine the functional form of change in DT, a series of nested LCMs were fit to the data for both perceived and behavioral DT. First, we tested an intercept-only model that implied no change in DT in the sample over the study timeframe. Second, a linear slope factor was added to the model to allow for linear change in the outcome over follow-up. This linear slope model was compared to the intercept-only model using a likelihood ratio test (i.e., chi-square difference), and the slope factor was retained significant improvement was observed in model fit. Finally, a freed loading slope factor was tested, which allows for non-linear growth in the outcome across study waves (Bollen & Curran, 2006). Specifically, the loadings of the observed indicators on this slope factor are fixed to 0 and 1 for the first and last waves (i.e., T1
and T5 respectively), and freely estimated for all other measurement occasions (i.e., T2, T3, and
T4). The freed loading model provides a flexible way to test for non-linear growth while
conserving parsimony by estimating fewer parameters than more traditional non-linear models (e.g., quadratic latent curve models; Bollen & Curran, 2006). As above, the freed loading slope factor was retained if results of a chi-square difference test indicated that including such a factor significantly improved model fit when compared to the linear slope model. Once the functional form of change was ascertained for perceived and behavioral DT, a final model was tested constraining time-specific residual variances of the DT indicators to equality over time in an effort to maximize model parsimony. If this restricted model did not result in significant decrement in model fit, it was retained and interpreted as the final model of DT change.
11
goodness of fit, the comparative fit index (CFI; Bentler, 1990), the Tucker-Lewis Index (TLI; Tucker & Lewis, 1973), the root-mean square error of approximation (RMSEA; Browne & Cudeck, 1993), and standardized root-mean-square residual (SRMR; Bentler, 1995). Acceptable fit was determined based on recommended guidelines (Hu & Bentler, 1999).
Finally, we examined the effect of substance use on the DT trajectory using two separate conditional LCMs based on the best-fitting unconditional models of perceived and behavioral DT. The conditional first model assessed the association between DT growth factors and
abstinence duration, which served as a time-invariant covariate in the analysis This allowed us to preliminarily test the hypothesis that DT would continually improve over time without the influence of substances. However, as relatively few individuals maintain abstinence
post-treatment (McLellan, Lewis, O’Brien, & Kleber, 2000; National Institute on Drug Abuse, 2012), it is useful to consider alternative indices, such as substance use severity. Thus, a second model was used to investigate the impact of a time-varying covariate, frequency of use between each assessment time point, on time-specific fluctuations in DT. Utilizing this conceptualization not only allowed us to quantify amount of substance use but also aided in conserving statistical power when compared to binary measurement approaches of use historically used in treatment outcome research (Fitzmaurice, Lipsitz, & Weiss, 2017). Specifically, we regressed the observed DT variables at each post-treatment wave (i.e., T2-T5) on a time-specific covariate that
represented the percentage of days within the interval since the last assessment during which participants had used substances (i.e., percent days used from T1-2, T2-3, T3-4, and T4-5). Thus, for
instance, the observed DT indicator at 3-months post-treatment (T3) was regressed on a covariate
12
of use and subsequent observed DT indicators to assess the impact of prior use on future DT. All paths were freely estimated for the time-varying covariate at contiguous and subsequent
13
CHAPTER 3: RESULTS
Preliminary Analyses
Associations between sample characteristics and DT at pre-treatment are reported in Table 1.
Table 1. Associations of participant characteristics and DT at pre-treatment.
DTST1 MTPT-CT1
Age r = -0.07 r = 0.03
Sex t(260) = 3.50** t(254) = 3.41**
Education t(260) = -2.46* t(254) = -1.27
Employment t(260) = -1.51 t(254) = -0.43
Treatment Condition t(260) = -1.00 t(254) = 0.24
Alcohol Dependence t(250) = 2.02* t(244) = -0.04
Cannabis Dependence t(249) = -0.34 t(243) = 0.20
Cocaine Dependence t(250) = 2.27* t(244) = 2.04*
Opioid Dependence t(249) = -0.72 t(243) = -0.61
Hallucinogen Dependence t(248) = -0.94 t(242) = 0.44
Sedative Dependence t(249) = 0.15 t(243) = -0.02
Note: r = Pearson correlation; t = independent samples t-test statistic; p < .05 = *, p < .01 = **, p < .001 = ***
Both gender and cocaine dependence were significantly associated with pre-treatment perceived and behavioral DT, while education and alcohol dependence were associated with pre-treatment perceived, but not behavioral, DT. Means, standard deviations, and bivariate
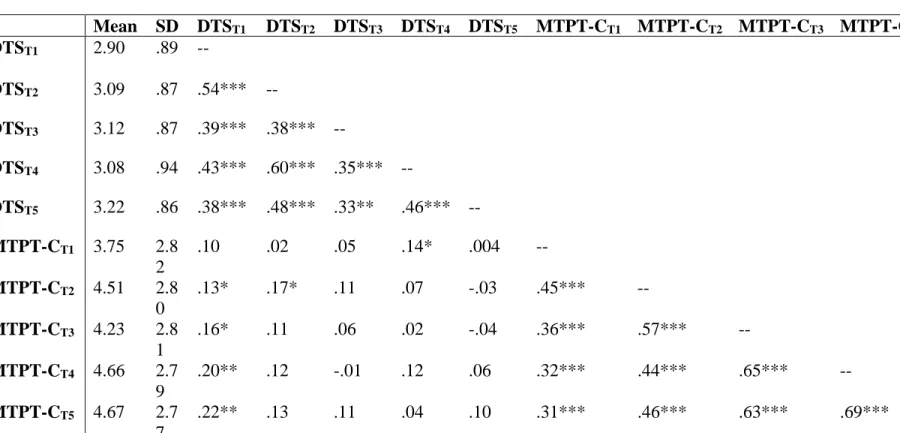
Table 2. Means, Standard Deviations, and Bivariate Correlations Among Repeated Measures of DT.
Mean SD DTST1 DTST2 DTST3 DTST4 DTST5 MTPT-CT1 MTPT-CT2 MTPT-CT3 MTPT-CT4
DTST1 2.90 .89 --
DTST2 3.09 .87 .54*** --
DTST3 3.12 .87 .39*** .38*** --
DTST4 3.08 .94 .43*** .60*** .35*** --
DTST5 3.22 .86 .38*** .48*** .33** .46*** --
MTPT-CT1 3.75 2.8
2
.10 .02 .05 .14* .004 --
MTPT-CT2 4.51 2.8
0
.13* .17* .11 .07 -.03 .45*** --
MTPT-CT3 4.23 2.8
1
.16* .11 .06 .02 -.04 .36*** .57*** --
MTPT-CT4 4.66 2.7
9
.20** .12 -.01 .12 .06 .32*** .44*** .65*** --
MTPT-CT5 4.67 2.7
7
.22** .13 .11 .04 .10 .31*** .46*** .63*** .69***
Note: DTS = Distress Tolerance Scale; MTPT-C = Mirror Tracing Persistence Task- Computerized Version (persistence time in minutes); SD = Standard Deviation; T1 = pre-treatment assessment; T2 = residential discharge assessment; T3 = 3-month follow-up assessment; T4 = 6-month follow-follow-up assessment; T5 = 12-month follow-follow-up assessment; p < .05 = *, p < .01 = **, p < .001 = ***
15
Significant positive correlations were observed within both perceived (r range: .33 to .60) and behavioral DT (r range: .31 to .69) over time. In contrast, concurrent measures of perceived and behavioral DT were generally small and not statistically significantly different from 0 (absolute values of r range from .004 to .22). In addition, inspection of descriptive statistics and normality plots revealed a ceiling effect for behavioral, but not perceived, DT indicating that a high percentage of participants persisted without quitting on the final phase of the MTPT-C at each time point (T1=33.1%, T2 = 42.2%, T3 = 30.4%, T4 = 39.5%, T5 = 37.3%). The
Kolmogorov-Smirnov (KS) test of normality was used to investigate distributions of all repeated measures of MTPT-C. Results of this test indicate significant deviation from normality at each time point (KSt1 = .19, KSt2 = .30, KSt3 = .25, KSt4 = .31, KSt5 = .31). Thus, a robust maximum
likelihood estimator was used to estimate the change trajectory of behavioral DT to account for non-normality observed in the data (Muthen & Muthen, 2010).
Power analysis
Data were generated for this a priori simulation study using suggested values for
intercept and slope factor variances, intercept and slope factor covariance, and residual variances of continuous outcomes (Muthen & Muthen, 2002). For the perceived DT simulation, a
16
0.20 (small standardized effect) and 0.50 (medium standardized effect). In addition, both models were generated assuming missing data. Because this study uses previously collected data, the probability of missing data was calculated and specified for each measurement occasion. Models were estimated by maximum likelihood for normally distributed data (i.e., DTS) and robust maximum likelihood for non-normally distributed data (i.e., MTPT-C).
Results of the Monte Carlo simulation studies for models where population slope mean estimates were set at 0.20 revealed that a linear latent growth model was adequately powered to detect intercept and slope effects (power = 1.00 for both intercept and slope) for both behavioral and perceived DT. A nonlinear model with freed factor estimates was also adequately powered to detect the intercept and slope effects for both behavioral and perceived DT outcomes
(intercept: power = 1.00; slope: power = .87 and .76 for perceived and behavioral DT
respectively). Alternatively, when using a medium effect size (0.5) for population slope mean estimates, both linear and freed factor loading models were well powered to detect mean latent intercept (power = 1.00) and slope factors (power > .99) for both behavioral and perceived DT. Longitudinal Measurement Invariance of DTS
We evaluated DTS measurement invariance in a series of three nested models. First, a configural invariance model, in which a unidimensional factor structure for the 15 DTS items was specified at each assessment wave, demonstrated good fit to the data (χ 2(120) = 239.74, p <
.001; CFI = .96; TLI = .93, RMSEA = .06, SRMR = .05). This result suggested consistency in the latent structure of perceived DT over time. Next, we tested a weak invariance model by constraining DTS factor loadings to equality over time. This model fit the data equally as well as the unrestricted configural invariance model, Δχ 2(12) = 20.02, p = .07, verifying that DTS
17
invariance model was tested by restricting both factor loadings and intercepts to be invariant over time. This model produced a significant decrement in fit when compared to the weak invariance model, Δχ 2(12) = 25.58, p = .01. Inspection of modification indices revealed that constraints
associated with strong invariance were particularly problematic for the DTS regulation subscale assessed at the second study wave (T2). This model was re-specified after freeing the equality
constraint on this item. This model fit equally well when compared to the weak invariance model, Δχ 2(11) = 15.14, p = .18, supporting partial strong invariance for the DTS. Overall, this
series of analyses justifies use of a LCM to interpret perceived DT change over time as measured by DTS.
Unconditional Models of Perceived and Behavioral DT
Model comparison
Concerning perceived DT, an intercept-only model was first tested and showed poor fit to the data, χ2(13) = 45.53, p < .001; CFI = .89; TLI = .92; RMSEA = .10; SRMR = .14. Next, a
linear growth model was tested and demonstrated significantly improved (Δχ2(3) = 18.41, p <
.001) but not optimal fit, χ2(10) = 27.12, p < .01; CFI = .94; TLI = .94; RMSEA = .08; SRMR =
.10. To test for a non-linear growth trajectory, a freed loading latent growth model was fit to the data, and demonstrated significant improvement over the linear growth model (Δχ2(3) = 9.65, p <
.05) and good model fit overall, χ2(7) = 17.47, p < .01; CFI = .97; TLI = .95; RMSEA = .08;
SRMR = .09. Finally, we tested a freed factor loading model with equality constraints imposed on time specific residuals, but this model produced a significant decrement in fit, Δχ2(4) = 9.72, p
18
The same sequence of model comparisons was conducted for behavioral DT using a robust maximum likelihood estimator to account for non-normality in the data. The intercept-only model showed poor fit to the data χ2(13) = 68.53, p < .001; CFI = .77; TLI = .82; RMSEA =
.13; SRMR = .12. The linear growth model demonstrated significantly improved (Satorra-Bentler Scaled Δχ2(3) = 35.61, p < .001), but not optimal fit to the data, χ2(10) = 32.99, p < .001;
CFI = .90; TLI = .90; RMSEA = .09; SRMR = .07. Thus, the freed loading model was tested and led to a significant improvement on the linear LCM (Satorra-Bentler Scaled Δχ2(3) = 17.28, p <
.001) and good fit to the data overall, χ2(7) = 15.37, p = .03; CFI = .97; TLI = .95; RMSEA =
.07; SRMR = .05. Constraining the observed indicator residual variances to equality significantly degraded model fit (Satorra-Bentler Scaled Δχ2(4) = 13.25, p = .01) so this restriction was
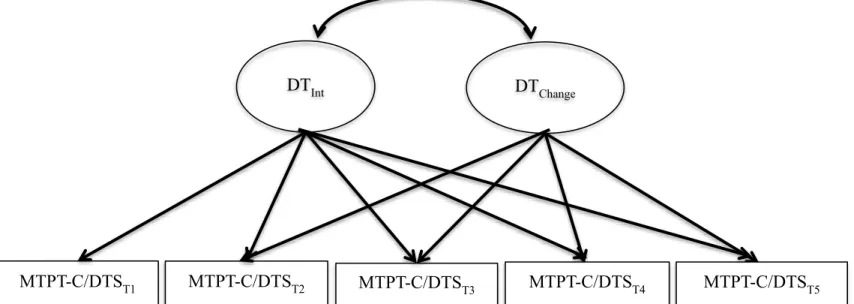
Figure 1. Latent growth curve model examining change trajectory of perceived and behavioral DT.
Note: MTPT-C = Mirror Tracing Persistence Test -Computerized Version; DTS = Distress Tolerance Scale; T1 = pre-treatment assessment; T2 = residential discharge assessment; T3 = 3-month follow-up assessment; T4 = 6-month follow-up assessment; T5 = 12-month follow-up assessment
DTInt DTChange
MTPT-C/DTST2
MTPT-C/DTST1 MTPT-C/DTST3 MTPT-C/DTST4 MTPT-C/DTST5
20 Parameter estimates
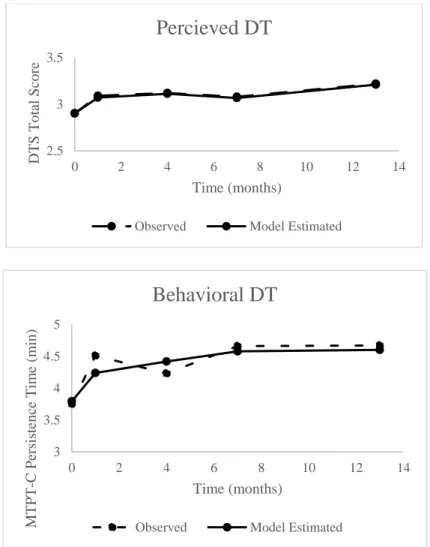
Observed and model estimated means of perceived and behavioral DT are displayed in Figure 2a-b.
Figure 2a-b. Observed and model estimated sample means for (a) perceived DT estimated
using total DTS scores and (b) behavioral DT estimated using task persistence time in
minutes on the MTPT-C. Both figures show sample means (observed and model estimated)
from DT repeated measures administered at five time points from pre-treatment to
12-months post-treatment.
Note: DT = Distress Tolerance; DTS = Distress Tolerance Scale; MTPT-C = Mirror Tracing
Persistence Test- Computerized Version 2.5
3 3.5
0 2 4 6 8 10 12 14
DTS Total Scor e Time (months)
Percieved DT
Observed Model Estimated
3 3.5 4 4.5 5
0 2 4 6 8 10 12 14
MTPT -C Persiste nce Tim e (m in) Time (months)
Behavioral DT
21
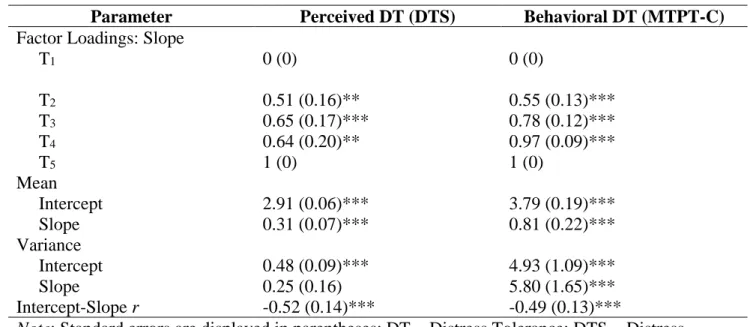
Additionally, unstandardized factor loadings and parameter estimates from the final unconditional freed loading model of both perceived and behavioral DT are presented in Table 3.
Table 3. Unstandardized factor loadings and parameter estimates from unconditional latent curve models of perceived and behavioral DT.
Factor loadings for the first (T1) and last (T5) assessment waves were set to 0 and 1
respectively to capture total DT change over the 12-month study period. The unstandardized loadings of the intervening waves (T2-4) can be interpreted as a percentage that represents the
proportion of change occurring between two time points relative to total change occurring between first and last time points (McArdle, 1988). As shown, the majority of improvement in both perceived and behavioral DT occurred between pre-treatment (T1) and residential discharge
(T2) assessments (51% and 55%, respectively). Slope factor means reflecting the expected
change in DT from the first to final assessment waves (T1 to T5) indicate that both perceived and
Parameter Perceived DT (DTS) Behavioral DT (MTPT-C)
Factor Loadings: Slope
T1 0 (0) 0 (0)
T2 0.51 (0.16)** 0.55 (0.13)***
T3 0.65 (0.17)*** 0.78 (0.12)***
T4 0.64 (0.20)** 0.97 (0.09)***
T5 1 (0) 1 (0)
Mean
Intercept 2.91 (0.06)*** 3.79 (0.19)***
Slope 0.31 (0.07)*** 0.81 (0.22)***
Variance
Intercept 0.48 (0.09)*** 4.93 (1.09)***
Slope 0.25 (0.16) 5.80 (1.65)***
Intercept-Slope r -0.52 (0.14)*** -0.49 (0.13)***
Note: Standard errors are displayed in parentheses; DT = Distress Tolerance; DTS = Distress Tolerance Scale; MTPT-C = Mirror Tracing Persistence Task- Computerized Version; T1 =
pre-treatment assessment; T2 = residential discharge assessment; T3 = 3-month follow-up assessment;
T4 = 6-month follow-up assessment; T5 = 12-month follow-up assessment; p < .05 = *, p < .01 = **,
22
behavioral DT exhibit a significant propensity to increase nonlinearly over time (ps < .001). Furthermore, significant variance in perceived and behavioral DT intercept factors indicate significant individual differences in DT at pre-treatment (T1), given that the variance of the
intercept factor reflects the estimated variability of the outcome at T1. Significant variance in the
behavioral, but not perceived, DT slope factor indicates significant inter-individual variability in behavioral DT change over follow up. Finally, significant negative correlations between both perceived and behavioral DT intercept and slope factors indicate greater DT improvement over time among individuals with low pre-treatment DT. Overall, these models explain 39-59% and 46-70% of the variance in time-specific measurements of perceived and behavioral DT
respectively (all ps < .001).
Conditional Models of Perceived and Behavioral DT
Figure 3 shows two conditional latent growth models for perceived and behavioral DT. The first
Figure 3. Latent growth curve model examining the association of weeks to first use (red) and the influence of time-specific percentage of days used (blue) on the change trajectory of perceived and behavioral DT.
Note: DT = Distress Tolerance; MTPT-C = Mirror Tracing Persistence Test -Computerized Version; DTS = Distress Tolerance Scale; T1 = pre-treatment assessment; T2 = residential discharge assessment; T3 = 3-month follow-up assessment; T4 = 6-month follow-up assessment; T5 = 12-month follow-up assessment
DTInt DTChange
MTPT-C/DTST2
MTPT-C/DTST1 MTPT-C/DTST3 MTPT-C/DTST4 MTPT-C/DTST5
% Days UsedT1-2 % Days UsedT2-3 % Days UsedT3-4 % Days UsedT4-5 Abstinence Duration
24 Time-Invariant Covariate: Abstinence Duration
The conditional model estimating the association between abstinence duration and perceived DT trajectory demonstrated adequate fit to the data, χ2(10) = 20.65, p = .02; CFI = .97;
TLI = .95; RMSEA = .06; SRMR = .09. Abstinence duration was significantly associated with the perceived DT slope factor (β = .24; b = 0.006, SE = 0.003, p < .05), but not intercept factor (β = -.01; b = 0.001, SE = 0.003, p = .91). Similarly, the conditional model estimating the
association between abstinence duration and the trajectory of behavioral DT fit the data well, χ2(10) = 19.95, p = .03; CFI = .96; TLI = .95; RMSEA = .06; SRMR = .05. Abstinence duration
was significantly associated with the behavioral DT slope factor (β = .20, b = .02, SE = .01, p = .02) but not intercept (β = -.15, b = -.02, SE = .01, p = .06). Results of both models are
graphically displayed in Figure 4a-b, with abstinence duration broken down into 4 weeks (1 month), 26 weeks (6 months), and 52 weeks (12 months) for ease of interpretation. As
25
Figure 4a-b. Model estimated trajectory of (a) perceived DT and (b) behavioral DT at
specified levels of abstinence duration, a time-invariant predictor. Specifically, the figure
shows both perceived and behavioral DT latent trajectory when abstinence duration is
equal to 4 weeks (1 month), 26 weeks (6 months), and 52 weeks (12 months).
2.5 2.75 3 3.25 3.5
0 2 4 6 8 10 12 14
DTS (total scor e) Follow-Up Month
Perceived DT
1 month 6 months 12 months
3 3.5 4 4.5 5
0 2 4 6 8 10 12 14
MTPT -C (P ersist ence Tim e in m in) Follow-Up Month
Behavioral DT
26 Time-varying Covariate: Frequency of use
Finally, we tested a LCM with the percentage of days (over follow-up) on which
participants used substances serving as a time-varying covariate in the perceived DT model. The initial model fit approached adequate fit, χ2(12) = 26.61, p < .01; CFI = .95; TLI = .88; RMSEA
= .07; SRMR = .06. To conserve parsimony, regressions of observed indicators on the time-varying covariates were constrained to equality and did not result in significant degradation of model fit, Δχ2(5) = 4.91, p = .43. This model fit the data well, χ2(17) = 31.52, p < .02; CFI = .95;
TLI = .92; RMSEA = .06; SRMR = .06, and revealed that frequency of use was not significantly related to DTS scores (i.e. perceived DT) at concurrent (b = .03, SE = .22, p = .89) nor
subsequent (b = -.01, SE = .16, p = .97) measurement occasions.
Analysis steps were next replicated using the behavioral DT model. The conditional LCM with percent days used as a time-varying covariate approached adequate fit to the data χ2(12) = 31.30, p < .01; CFI = .95; TLI = .86; RMSEA = .08; SRMR = .04. Regressions of
observed indicators on the time-varying covariates were constrained to equality to conserve model parsimony and did not result in significant degradation of model fit, Satorra-Bentler Scaled Δχ2(5) = 9.14, p = .10. This model was thus retained, and results revealed that higher
27
CHAPTER 4: DISCUSSION
The current study examined the trajectory of distress tolerance among substance users receiving residential treatment over a series of five assessment waves occurring intermittently from pre-treatment to 12-months post-treatment and investigated the relationship between DT change over time and both abstinence duration and severity of substance use post-treatment. As predicted, both behavioral and perceived DT improved over time, such that substance users evidenced increased persistence time on a distressing behavioral task, and rated self-reported ability to tolerate distress as generally increasing, from pre-treatment to 12-months post-treatment. In addition, abstinence duration post-treatment was positively associated with both perceived and behavioral DT such that individuals who were able to maintain longer periods of abstinence post-treatment evidenced greater improvements in perceived and behavioral DT. Moreover, greater frequency of use between post-treatment assessment waves was associated with attenuated improvement in post-treatment behavioral DT. Contrary to expectation, this association was not observed for perceived DT change.
28
DT change itself changes over time. One explanation may be the influence of environmental factors on an individual’s perceived and actual ability to improve DT over time. For example, as demonstrated in this study more than half of the total increase in both perceived and behavioral DT occurred while participants were in the restricted environment of residential treatment, between T1 (treatment entry) and T2 (residential treatment discharge). We observe fluctuations in
the rate of DT improvement among substance users after treatment discharge, between T2 and T5,
when environmental factors between participants were no longer held constant. In particular, housing and financial stability, employment, social networks, and acute stressors, that are known to influence the course of recovery for substance users (Davies, Elison, Ward, & Laudet, 2015; Sinha, 2007; Walton, Blow, Bingham, & Chermack, 2003; Worley, Witkiewitz, Brown,
Kivlahan, & Longabaugh, 2015) may also have influenced DT trajectories.
Relatedly, we found significant variance in the behavioral DT slope factor specifically, suggesting that not only does the rate of change in DT vary over time, but that differences in overall behavioral DT trajectories exist among substance users. Individual differences in both perceived and behavioral DT at pre-treatment have been investigated in previous studies,
revealing relationships between DT and gender (Ali, Seitz-Brown, & Daughters, 2015; Burjarski, Norberg, & Copeland, 2012; Daughters et al., 2009; Tull et al., 2013), and co-occurring
29
specific substance dependence diagnoses reported here (Table 1) provide additional evidence supporting the importance of future studies identifying additional predictors of DT trajectories to further elucidate nuanced variation in DT change.
In the current study, we were specifically interested in examining the influence of
substance-related predictors of DT change, namely abstinence and severity of use post-treatment. As predicted, sustained abstinence was associated with greater improvements in both perceived and behavioral DT. This is consistent with findings showing that sustained abstinence allows for recovery of cognitive and affective processes as well as changes in underlying neurobiological structure and function related to DT (Fox, Hong, & Sinha, 2008; Fox et al., 2007; Garavan, Brennan, Hester, & Whelan, 2013; Schmidt, Pennington, Cardoos, Durazzo, & Meyerhoff, 2017; Tull, Schulzinger, Schmidt, Zvolensky, & Lejuez, 2007; Wang et al., 2012). In addition, we found that greater post-treatment frequency of use was associated with attenuated behavioral DT such that participants who used more frequently between assessment waves were unable to persist on a distressing task for as long as those who used less frequently, if at all, during the study period. Research indicates that impairment in cognitive function is associated with acute and chronic substance use (Broyd, van Hell, Beale, Yucel, & Solowij, 2016; Everitt & Robbins, 2016; Volkow et al., 2016), and may be exacerbated by increased rates of use (Grant &
30
al., 2009). Thus it may be that individuals who used substances post-treatment were unable to realize the impact of use on current functioning, particularly when evaluating DT. Additional research is needed to understand discrepancies between perceived and behavioral DT within this population more specifically and the implications of this disconnect on future functioning. Nonetheless, findings from the current study lend support to this work and suggest that abstinence allows for recovery of DT while substance use has acute and temporally-specific effects on behavioral DT in particular, providing preliminary evidence for the malleability and sensitivity of DT to proximal psychological and biological events.
Though findings from this study are both novel and important, there are several
31
three months treatment was associated with attenuated behavioral DT at three-months post-treatment but was not related to DT at six months post-post-treatment. One explanation for the null findings of lagged effects may be the large and variable temporal spacing between assessment waves. It may be that substance use behavior has a more immediate effect on DT than could be determined in the current study. Thus, future studies assessing DT and substance use behavior at more frequent intervals post-treatment may be needed to disentangle temporal relationships between substance use and DT change. Finally, the results of the current study reflect the impact of substance use on DT change among a primarily African American sample of residential treatment seeking substance users, limiting the generalizability of study findings. One future direction may be to replicate the current study in other populations, including those from varying racial and ethnic backgrounds, and even non-treatment-seeking substance users or individuals in alternative treatment settings.
32
33
REFERENCES
Ali, B., Ryan, J. S., Beck, K. H., & Daughters, S. B. (2013). Trait aggression and problematic alcohol use among college students: the moderating effect of distress tolerance. Alcoholism, Clinical and Experimental Research, 37(12), 2138-2144.
doi:10.1111/acer.12198
Ali, B., Seitz-Brown, C. J., & Daughters, S. B. (2015). The interacting effect of depressive symptoms, gender, and distress tolerance on substance use problems among residential treatment-seeking substance users. Drug and alcohol dependence, 148, 21-26.
Allan, N. P., Macatee, R. J., Norr, A. M., Raines, A. M., & Schmidt, N. B. (2015). Relations between common and specific factors of anxiety sensitivity and distress tolerance and fear, distress, and alcohol and substance use disorders. Journal of anxiety disorders, 33, 81-89.
Baker, T. B., Piper, M. E., McCarthy, D. E., Majeskie, M. R., & Fiore, M. C. (2004). Addiction Motivation Reformulated: An affective processing model of negative reinforcement. Psychological Review, 111(1), 33-51.
Bentler, P. M. (1990). Comparative fit indexes in structural models. Psychological bulletin, 107(2), 238.
Bollen, K. A., & Curran, P. J. (2006). Latent curve models: A structural equation perspective (Vol. 467). John Wiley & Sons.
Bornovalova, M. A., Gratz, K. L., Daughters, S. B., Hunt, E. D., & Lejuez, C. W. (2012). Initial RCT of a distress tolerance treatment for individuals with substance use disorders. Drug and Alcohol Dependence, 122(1-2), 70-76. doi:10.1016/j.drugalcdep.2011.09.012
Brandon, T. H., Herzog, T. A., Juliano, L. M., Irvin, J. E., Lazev, A. B., & Simmons, V. N. (2003). Pretreatment task persistence predicts smoking cessation outcome. Journal of Abnormal Psychology, 112(3), 448-456.
Brown, R. A., Bloom, E. L., Hecht, J., Moitra, E., Herman, D. S., & Stein, M. D. (2014). A pilot study of a distress tolerance treatment for opiate-dependent patients initiating
buprenorphine: rationale, methodology, and outcomes. Behavior Modification, 38(5), 730-759.
Brown, R. A., Lejuez, C. W., Kahler, C. W., & Strong, D. R. (2002). Distress tolerance and duration of past smoking cessation attempts. Journal of Abnormal Psychology, 111(1), 180-185.
34
Brown, R. A., Reed, K. M. P., Bloom, E. L., Minami, H., Strong, D. R., Lejuez, C. W., . . . Hayes, S. C. (2013). Development and preliminary randomized controlled trial of a distress tolerance treatment for smokers with a history of early lapse. Nicotine & Tobacco Research, 15(12), 2005-2015.
Browne, M. W., & Cudeck, R. (1993). Alternative ways of assessing model fit. Sage focus editions, 154, 136-136.
Broyd, S. J., van Hell, H. H., Beale, C., Yücel, M., & Solowij, N. (2016). Acute and chronic effects of cannabinoids on human cognition—a systematic review. Biological psychiatry, 79(7), 557-567.
Buckner, J. D., Keough, M. E., & Schmidt, N. B. (2007). Problematic alcohol and cannabis use among young adults: The roles of depression and discomfort and distress
tolerance. Addictive Behaviors, 32(9), 1957-1963.
Buckner, J. D., Jeffries, E. R., Terlecki, M. A., & Ecker, A. H. (2016). Distress tolerance among students referred for treatment following violation of campus cannabis use policy: Relations to use, problems, and motivation. Behavior modification, 40(5), 663-677.
Bujarski, S. J., Norberg, M. M., & Copeland, J. (2012). The association between distress tolerance and cannabis use-related problems: the mediating and moderating roles of coping motives and gender. Addictive behaviors, 37(10), 1181-1184.
Cameron, A., Reed, K. P., & Ninnemann, A. (2013). Reactivity to negative affect in smokers: The role of implicit associations and distress tolerance in smoking cessation. Addictive Behaviors, 38(12), 2905-2912.
Dahlgren, M. K., Sagar, K. A., Racine, M. T., Dreman, M. W., & Gruber, S. A. (2016).
Marijuana use predicts cognitive performance on tasks of executive function. Journal of studies on alcohol and drugs, 77(2), 298-308.
Daughters, S. B., Lejuez, C., Kahler, C. W., Strong, D. R., & Brown, R. A. (2005).
Psychological distress tolerance and duration of most recent abstinence attempt among residential treatment-seeking substance abusers. Psychology of Addictive Behaviors, 19(2), 208.
Daughters, S. B., Lejuez, C. W., Bornovalova, M. A., Kahler, C. W., Strong, D. R., & Brown, R. A. (2005). Distress Tolerance as a Predictor of Early Treatment Dropout in a Residential Substance Abuse Treatment Facility. Journal of Abnormal Psychology, 114(4), 729-734. Daughters, S. B., Ross, T. J., Bell, R. P., Yi, J. Y., Ryan, J., & Stein, E. A. (2016). Distress
35
Daughters, S. B., Magidson, J. F., Anand, D., Seitz‐Brown, C. J., Chen, Y., & Baker, S. (2017). The Effect of a Behavioral Activation Treatment for Substance Use on Post‐treatment Abstinence: A Randomized Controlled Trial. Addiction.
Daughters, S. B., Sargeant, M. N., Bornovalova, M. A., Gratz, K. L., & Lejuez, C. W. (2008). The relationship between distress tolerance and antisocial personality disorder among male inner-city treatment seeking substance users. Journal of personality disorders, 22(5), 509-524.
Daughters, S. B., Reynolds, E. K., MacPherson, L., Kahler, C. W., Danielson, C. K., Zvolensky, M., & Lejuez, C. W. (2009). Distress tolerance and early adolescent externalizing and internalizing symptoms: The moderating role of gender and ethnicity. Behaviour research and therapy, 47(3), 198-205.
Davies, G., Elison, S., Ward, J., & Laudet, A. (2015). The role of lifestyle in perpetuating substance use disorder: the Lifestyle Balance Model. Substance abuse treatment, prevention, and policy, 10(1), 2.
Everitt, B. J., & Robbins, T. W. (2016). Drug addiction: updating actions to habits to compulsions ten years on. Annual review of psychology, 67, 23-50.
Fals-Stewart, W., O'farrell, T. J., Freitas, T. T., McFarlin, S. K., & Rutigliano, P. (2000). The timeline followback reports of psychoactive substance use by drug-abusing patients: psychometric properties. Journal of Consulting and Clinical Psychology, 68(1), 134. First MB, Spitzer RL, Gibbon M, Williams JBW. (1994). Structured clinical interview for
DSM-IV patient edition (SCID-NP, Version 2.0) New York, NY: Biometrics Research Department.
Fitzmaurice, G. M., Lipsitz, S. R., & Weiss, R. D. (2017). Statistical considerations in the choice of endpoint for drug use disorder trials. Drug & Alcohol Dependence.
Fox, H., Axelrod, S., Paliwal, P., Sleeper, J., & Sinha, R. (2007). Difficulties in emotion regulation and impulse control during cocaine abstinence. Drug and Alcohol Dependence, 89(2), 298-301.
Fox, H., Hong, K., & Sinha, R. (2008). Difficulties in emotion regulation and impulse control in recently abstinent alcoholics compared with social drinkers. Addictive Behaviors, 33(2), 388-394.
Garavan, H., Brennan, K., Hester, R., & Whelan, R. (2013). The neurobiology of successful abstinence. Current Opinion in Neurobiology, 23(4), 668-674.
36
Measuring the Same Construct?. Journal Of Rational-Emotive & Cognitive-Behavior Therapy, 34(2), 87-99.
Goldstein, R. Z., Bechara, A., Garavan, H., Childress, A. R., Paulus, M. P., & Volkow, N. D. (2009). The neurocircuitry of impaired insight in drug addiction. Trends in cognitive sciences, 13(9), 372-380.
Gorka, S. M., Ali, B., & Daughters, S. B. (2012). The role of distress tolerance in the relationship between depressive symptoms and problematic alcohol use. Psychology of Addictfoxive Behaviors, 26(3), 621.
Grant, J. E., & Chamberlain, S. R. (2014). Impulsive action and impulsive choice across
substance and behavioral addictions: cause or consequence?. Addictive behaviors, 39(11), 1632-1639.
Hasan, N. S., Babson, K. A., Banducci, A. N., & Bonn-Miller, M. O. (2015). The prospective effects of perceived and laboratory indices of distress tolerance on cannabis use following a self-guided quit attempt. Psychology of Addictive Behaviors, 29(4), 933.
Horn, J. L., & McArdle, J. J. (1992). A practical and theoretical guide to measurement invariance in aging research. Experimental Aging Research, 18, 117-144.
Hsu, S. H., Collins, S. E., & Marlatt, G. A. (2013). Examining psychometric properties of distress tolerance and its moderation of mindfulness-based relapse prevention effects on alcohol and other drug use outcomes. Addictive behaviors, 38(3), 1852-1858.
Hu, L. T., & Bentler, P. M. (1999). Cutoff criteria for fit indexes in covariance structure analysis: Conventional criteria versus new alternatives. Structural equation modeling: a
multidisciplinary journal, 6(1), 1-55.
Kiselica, A. M., Rojas, E., Bornovalova, M. A., & Dube, C. (2015). The nomological network of self-reported distress tolerance. Assessment, 22(6), 715-729.
Koob, G. F., & Le Moal, M. (1997). Drug abuse: hedonic homeostatic dysregulation. Science, 278(5335), 52-58.
Koob, G. F., & Le Moal, M. (2001). Drug addiction, dysregulation of reward, and allostasis. Neuropsychopharmacology, 24(2), 97-129.
Lejuez, C., Kahler, C. W., & Brown, R. A. (2003). A modified computer version of the Paced Auditory Serial Addition Task (PASAT) as a laboratory-based stressor. The Behavior Therapist, 26(4), 290-293.
Leyro, T. M., Zvolensky, M. J., & Bernstein, A. (2010). Distress tolerance and
37
Leyro, T. M., Bernstein, A., Vujanovic, A. A., McLeish, A. C., & Zvolensky, M. J. (2011). Distress Tolerance Scale: A confirmatory factor analysis among daily cigarette smokers. Journal of psychopathology and behavioral assessment, 33(1), 47-57.
Magidson, J. F., Listhaus, A. R., Seitz-Brown, C. J., Anderson, K. E., Lindberg, B., Wilson, A., & Daughters, S. B. (2013). Rumination mediates the relationship between distress tolerance and depressive symptoms among substance users. Cognitive therapy and research, 37(3), 456-465.
McArdle, J. J. (1988). Dynamic but structural equation modeling of repeated measures data. In Handbook of multivariate experimental psychology (pp. 561-614). Springer US.
McHugh, R. K., Daughters, S. B., Lejuez, C. W., Murray, H. W., Hearon, B. A., Gorka, S. M., & Otto, M. W. (2011). Shared variance among self-report and behavioral measures of distress intolerance. Cognitive Therapy and Research, 35(3), 266-275.
McLellan, A. T., Lewis, D. C., O'brien, C. P., & Kleber, H. D. (2000). Drug dependence, a chronic medical illness: implications for treatment, insurance, and outcomes evaluation. Jama, 284(13), 1689-1695.
Muthén, L. K., & Muthén, B. O. (2002). How to use a Monte Carlo study to decide on sample size and determine power. Structural equation modeling, 9(4), 599-620.
Muthen, L. K., & Muthén, B. O. (2010). Mplus user’s guide, v. 6.1. Los Angeles, CA: Muthen and Muthen, UCLA.
National Institute on Drug Abuse, (2012). Prinicples of drug addition treatment: A Research-based guide (3rd ed.). NIH Publication No. 12-4180. Rockville, MD: National Institute on Drug Abuse.
Perkins, K. A., Giedgowd, G. E., Karelitz, J. L., Conklin, C. A., & Lerman, C. (2012). Smoking in response to negative mood in men versus women as a function of distress tolerance. Nicotine & Tobacco Research, 14(12), 1418-1425.
Quinn, E. P., Brandon, T. H., & Copeland, A. L. (1996). Is task persistence related to smoking and substance abuse? The application of learned industriousness theory to addictive behaviors. Experimental and Clinical Psychopharmacology, 4(2), 186.
Schmidt, N. B., Richey, J. A., & Fitzpatrick, K. K. (2006). Discomfort intolerance: Development of a construct and measure relevant to panic disorder. Journal of Anxiety Disorders, 20(3), 263-280.
38
alcohol use disorders and changes with abstinence. Journal of clinical and experimental neuropsychology, 39(1), 22-34.
Simons, J. S., & Gaher, R. M. (2005). The Distress Tolerance Scale: Development and validation of a self-report measure. Motivation and Emotion, 29(2), 83-102.
Sinha, R. (2007). The role of stress in addiction relapse. Current psychiatry reports, 9(5), 388-395.
Sobell, L. C., Maisto, S. A., Sobell, M. B., & Cooper, A. M. (1979). Reliability of alcohol abusers' self reports of drinking behavior.
Strong, D. R., Brown, R. A., Sims, M., Herman, D. S., Anderson, B. J., & Stein, M. D. (2012). Persistence on a Stress-challenge Task Before Initiating Buprenorphine Treatment Was Associated With Successful Transition From Opioid Use to Early Abstinence. Journal of Addiction Medicine, 6(3), 219-225. doi:10.1097/ADM.0b013e31825d927f
Trafton, J., & Gifford, E. (2010). Biological bases of distress tolerance. Zvolensky, MJ, Bernstein A, Vujanovic AA (Eds). Distress Tolerance: Theory, Research and Clinical Applications: New York: The Guilford Press.
Tucker, L. R., & Lewis, C. (1973). A reliability coefficient for maximum likelihood factor analysis. Psychometrika, 38(1), 1-10.
Tull, M. T., Gratz, K. L., Coffey, S. F., Weiss, N. H., & McDermott, M. J. (2013). Examining the interactive effect of posttraumatic stress disorder, distress tolerance, and gender on
residential substance use disorder treatment retention. Psychology of Addictive Behaviors, 27(3), 763-773. doi:10.1037/a0029911
Tull, M. T., Schulzinger, D., Schmidt, N. B., Zvolensky, M. J., & Lejuez, C. (2007). Development and initial examination of a brief intervention for heightened anxiety sensitivity among heroin users. Behavior Modification, 31(2), 220-242.
Volkow, N. D., Swanson, J. M., Evins, A. E., DeLisi, L. E., Meier, M. H., Gonzalez, R., ... & Baler, R. (2016). Effects of cannabis use on human behavior, including cognition, motivation, and psychosis: a review. JAMA psychiatry, 73(3), 292-297.
Vonmoos, M., Hulka, L. M., Preller, K. H., Minder, F., Baumgartner, M. R., & Quednow, B. B. (2014). Cognitive impairment in cocaine users is drug-induced but partially reversible: evidence from a longitudinal study. Neuropsychopharmacology, 39(9), 2200-2210.
39
Wang, T. Y., Fan, T. T., Bao, Y. P., Li, X. D., Liang, C. M., Wang, R. J., ... & Shi, J. (2017). Pattern and related factors of cognitive impairment among chronic methamphetamine users. The American journal on addictions, 26(2), 145-151.
Wang, X., Li, B., Zhou, X., Liao, Y., Tang, J., Liu, T., ... & Hao, W. (2012). Changes in brain gray matter in abstinent heroin addicts. Drug and alcohol dependence, 126(3), 304-308.
Walton, M. A., Blow, F. C., Bingham, C. R., & Chermack, S. T. (2003). Individual and social/environmental predictors of alcohol and drug use 2 years following substance abuse treatment. Addictive behaviors, 28(4), 627-642.
Weiss, N. H., Bold, K. W., Sullivan, T. P., Armeli, S., & Tennen, H. (2017). Testing
bidirectional associations among emotion regulation strategies and substance use: a daily diary study. Addiction, 112(4), 695-704.
Worley, M. J., Witkiewitz, K., Brown, S. A., Kivlahan, D. R., & Longabaugh, R. (2015). Social network moderators of naltrexone and behavioral treatment effects on heavy drinking in the COMBINE study. Alcoholism: Clinical and Experimental Research, 39(1), 93-100.