THE SIGNALING EFFECTS OF FDA DRUG DESIGNATIONS
Kathleen L. Miller
A dissertation submitted to the faculty at the University of North Carolina at Chapel Hill in partial fulfillment of the requirements for the degree of Doctor of Philosophy in the Department of Health Policy and Management in the Gillings School of Global Public Health.
Chapel Hill 2014
iii ABSTRACT
Kathleen L. Miller: The Signaling Effects of FDA Drug Designations (Under the direction of Kristin Reiter)
Investors in pharmaceutical firms face substantial information asymmetries. Only a small fraction of drugs that enter development are ever approved by the U.S. Food and Drug Administration (FDA), causing uncertainty for investors. While investors desire information regarding a drug’s potential likelihood of a successful approval, firms are limited in their ability to share any proprietary information, because in doing so they may lose their competitive advantage. Instead, firms may use signals to indicate to investors the likelihood of success of drugs in their pipeline.
iv
v
vi
ACKNOWLEDGEMENTS
I would first like to thank my committee members for their feedback, support, and encouragement during this dissertation process. I could not have completed it without their belief in the value of this work. Mark Holmes encouraged me to think more critically about my conceptualization of the signaling effects and my significance tests. David Ridley encouraged me to think more broadly about the implications of the results of this dissertation. George Pink commented on drafts faster than anyone I have ever known, and his comments were insightful, relevant and detailed. His excitement for the topic was contagious, and provided me with the encouragement I needed to keeping moving forward.
Clark Nardinelli was more than just a committee member, he was also my mentor and supervisor at the FDA. I can’t begin to express my gratitude to him for giving me the opportunity to work with him and the rest of the Economics Staff. His support from the very beginning inspired me to push myself and my research, and I have learned so much from him. I would also like to thank my coworkers at FDA for their unfailing encouragement, comments and inspiration: Mike, Andreas, Elizabeth, Carolyn, Trini and Sharnell.
vii
I would also like to thank Morris Weinberger. Morris gave me an opportunity when I needed one most, and did everything in his power to make sure that I was successful. That kind of support in a program director is rare, and speaks volumes for Morris’s empathy, integrity, and commitment to his students.
I could not have gotten through this dissertation without the support of my friends. Whitney was with me from the beginning, and provided the perfect counterpoint to all things grad school. Lisa understood what was journey was all about, more personally than anyone else. Mona made sure that I stayed grounded, kept me level, and reminded me that spring rolls & Matt Bomer can make almost anything better. I also want to thank Claire, Jesse, Jeff and Semra for keeping me smiling.
viii
TABLE OF CONTENTS
LIST OF TABLES.………xi
LIST OF FIGURES……….…xii
LIST OF ABBREVIATIONS……….……xiii
CHAPTER 1: INTRODUCTION………1
CHAPTER 2: THE SIGNALING EFFECTS OF THE FDA FAST-TRACK DESIGNATION……….8
Abstract……….8
Introduction………9
The Fast-Track Designation………..11
Investor Reactions to Drug Development Announcements: Previous Studies……….13
Study Theory Development………....15
Signaling Theory……….15
The Fast-Track Designation as a Signal to Investors………..17
Longitudinal Changes in the Strength of the Fast-Track Signal……….19
The Strength of the Fast-Track Signal by Firm Size……….22
Methods……….23
Defining the Event Timeline………23
Calculating the Expected Returns………..24
Calculating the Cumulative Abnormal Returns……….25
ix
The Wilcoxon Rank Sum Significance Test………26
Data………..27
Exclusion Criteria………27
Final Data……….28
Results and Discussion……….30
Longitudinal Analysis………..32
Firm Size Analysis………..33
Sensitivity Analyses………..34
Limitations………..37
Conclusion………39
CHAPTER 3: THE SIGNALING EFFECTS OF THE FDA ORPHAN DESIGNATION………..41
Abstract……….41
Introduction………41
Background……….43
History of the Orphan Drug Designation………43
The Literature on FDA Designation Event Studies………..45
Conceptual Framework………..46
The Orphan Designation as a Signal to Investors………46
The Strength of the Orphan Designation Signal over Time………..47
The Strength of the Orphan Designation Signal by Firm Size……….48
Methods……….49
Specifications for Longitudinal and Firm Size Analyses………..51
x
Data………..52
Exclusion Criteria………52
Final Study Sample………54
Results……….56
Sensitivity Analyses………..58
Discussion……….60
Conclusion………64
CHAPTER 4: THE SIGNALING EFFECTS OF STACKED FDA DESIGNATIONS………..………66
Abstract……….66
Introduction………67
Conceptual Framework………..68
Methods and Data………..70
Study Sample and Exclusion Criteria………72
Results……….76
Sensitivity Analyses………..78
Discussion……….79
Limitations………..81
Conclusion………81
CHAPTER 5: CONCLUSION………..83
xi LIST OF TABLES
Table 2.1 – Average Daily Returns for Estimation Window (-121, -11)………..……29
Table 2.2 – Average Daily Returns for Event Window (0, 1)………..30
Table 2.3 – Results of Main Analyses ……….31
Table 2.4 – Results of Main Sensitivity Analyses……….35
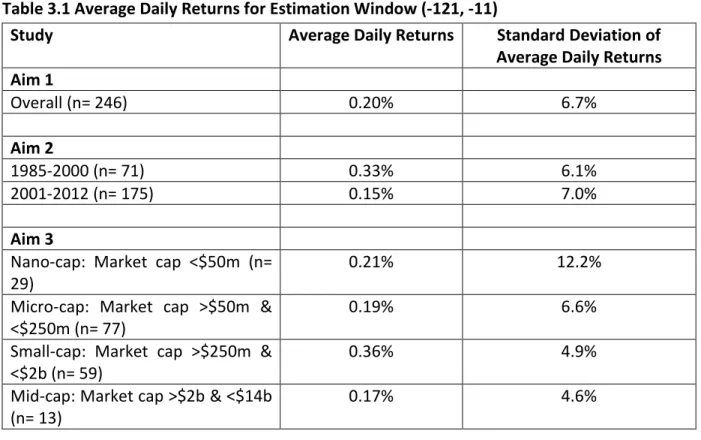
Table 3.1 – Average Daily Returns for Estimation Window (-121, -11)………..55
Table 3.2 – Average Daily Returns for Event Window (0, 1)………..55
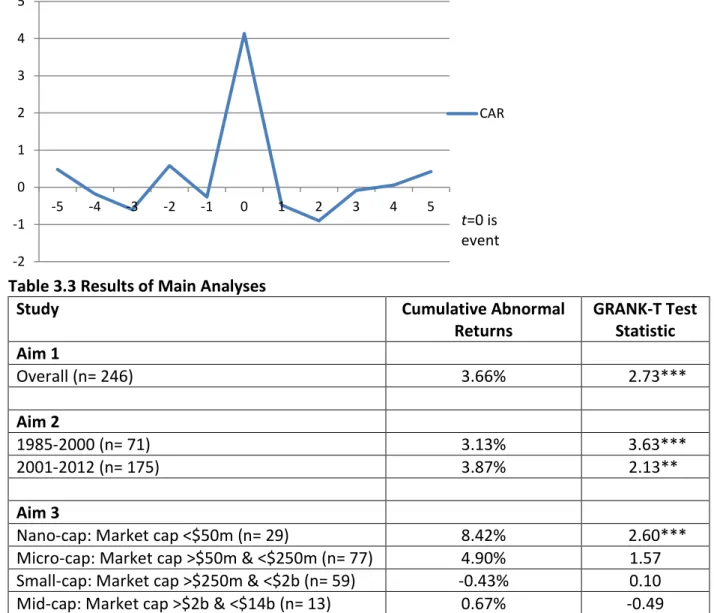
Table 3.3 – Results of Main Analyses...……….56
Table 3.4 – Results of Sensitivity Analyses………..59
Table 4.1 – Average Daily Returns for Estimation Window (-121, -11)………..74
Table 4.2 – Average Daily Returns for Event Window (0, 1)………..75
Table 4.3 – Results of Overall Analysis………..76
Table 4.4 – Results of Longitudinal Analysis………..77
Table 4.5 – Results of Company Size Analysis………..78
xii
LIST OF FIGURES
Figure 2.1 – Event Study Timeline……….24
Figure 2.2 – Graph of Cumulative Abnormal Returns Between (-5, 5)………31
Figure 2.3 – Graph of Longitudinal Cumulative Abnormal Returns Between (-5, 5)……….33
Figure 2.4 – Graph of Cumulative Abnormal Returns by Firm Size Between (-5, 5)………..34
Figure 3.1 – Graph of Cumulative Abnormal Returns Between (-5, 5)………56
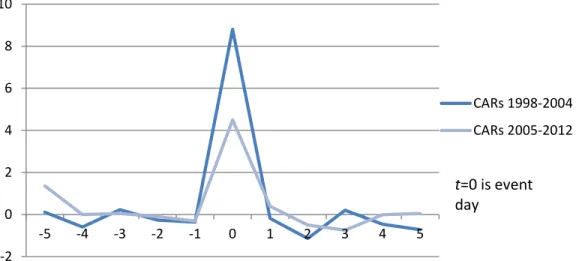
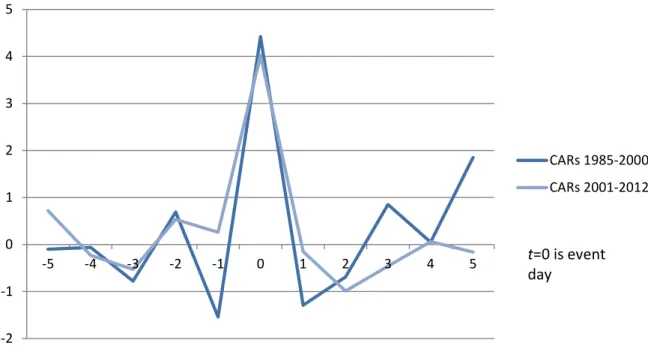
Figure 3.2 – Graph of Longitudinal Cumulative Abnormal Returns Between (-5, 5)……….57
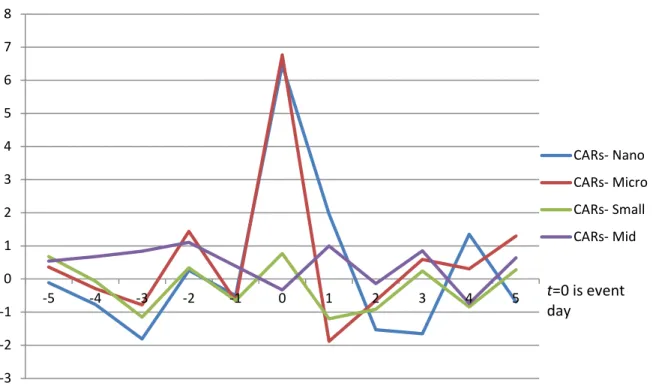
Figure 3.3 – Graph of Cumulative Abnormal Returns by Firm Size Between (-5, 5)………..58
xiii
LIST OF ABBERVIATIONS
BLA Biologic License Agreement CARs Cumulative Abnormal Returns
CRSP Center for Research in Security Prices FDA US Food and Drug Administration
FDAMA Food and Drug Administration Modernization Act of 1997 IND Investigational New Drug
1
Chapter 1 – Introduction
Modern drug development began in the early part of the 20th century, with the creation of the first antimicrobials and vaccines. Since then, the degree of complexity of drug development has increased significantly to now include biologic drugs created from cell lines, as well as targeted and genomic therapies. With these advances came lowered mortality rates, higher life expectancies, and a higher standard of health. However, there are still diseases for which there is no cure, or where current treatments are not as safe or effective as would be desired. Continuing to stimulate drug development is therefore critical if advances in health are to be sustained.
2
Public policy measures for encouraging drug development fall into two primary categories: designations, which are given during the development process, and prizes, which are awarded once a drug has gained marketing approval. The Hatch-Waxman Act of 1985, that created a regulatory pathway for generic drugs, is the earliest example of a prize. The prize created by this legislation was market exclusivity; a new drug was rewarded five years of market exclusivity after approval before generic entry could begin. The prize was created to allay fears that the entry of generic drugs would cause a decrease in drug development because firms would not be able to recoup their full investment costs before generic entry.
The second public policy measure, and the topic of this dissertation, is designations. Designations are given during the drug development process, and may contain prizes as part of the award package. For example, one of the first designations was the Orphan drug designation, created in 1983. The Orphan designation is awarded to drugs that are indicated to treat a rare disease, defined as affecting 200,000 or fewer patients in the US. This designation provides multiple tangible benefits, including a prize of two extra years of exclusivity on the indication if the drug is approved. The Orphan designation also makes some clinical trial costs for the drug tax-deductible, provides more defined access to the FDA to discuss clinical trial design and other regulatory matters, and waives user fees if a drug submits a marketing application.
3
sponsoring firm can take advantage of more frequent communication with the FDA, as well as a rolling review. The rolling review allows the firm to submit pieces of its marketing approval application as they are completed, rather than all at once, which is standard. A drug that receives a fast-track designation is also potentially eligible for an accelerated approval or priority review, although these programs are also available to non-fast-track drugs.
Assessing the impact of these designations is an important component of the public policy process. New designations, such as the Breakthrough designation, continue to be created, yet minimal research has been done to determine the effectiveness of the current programs. Some studies have looked at the impact of a single piece of legislation; for example, Yin (2008) assessed the Orphan Drug Act. Other studies such as Alefantis, Kulkarni, and Vora (2005) and Anderson and Zhang (2010) looked at the impact of a single designation, specifically the fast-track designation.(1-3) However, the focus of these assessments has not been on examining current programs with an eye for predicting the success of future policies.
4
important to step back and assess the effects of the designation at the beginning of the drug development process.
Investors are a central piece of the drug development process. For both public and private firms, investors bring in needed capital. And given the high costs of drug development, this capital outlay is substantial. Without investors, drug development projects would never get off the ground, as seen in the rare disease space before the Orphan Drug Act was passed. However, to get investors interested in a drug, some information needs to be conveyed regarding the drug’s quality, i.e. its likelihood of producing a future profit. However, not all of the information regarding a drug’s potential can be conveyed to investors, due to proprietary concerns. For example, information such as a drug’s molecular structure, and advantage over other drugs under development, cannot be conveyed publicly because other firms may use the information to further their own development projects. This information asymmetry between firms and investors can be reduced using signals.
5
To determine how investors perceive designations (i.e., whether or not designations are effective signals), an event study methodology will be used. The event study assesses how much a firm’s stock price changes after an announcement of the receipt of a designation, thereby acting as a proxy for investors’ perceptions of the designation. This methodology works well with designations for multiple reasons. First, many of the designations are publicly announced, making them visible to both investors and researchers. Second, the designations are discrete events, thereby increasing the validity that the designation has the impact on stock price. Lastly, most of the designation announcements are specifically tailored to investors, increasing the likelihood that they will see them and that they will add the information contained within them to their valuation of the firm.
This study covers three policies, correlating to each of its chapters. The first chapter studies the fast-track designation, the second the Orphan designation, and the third the stacked designation (a fast-track designation which has a prior Orphan designation). Each of the chapters tests three main research hypotheses: (1) whether the announcement of a designation has an overall effect on stock price; (2) whether this effect has changed over time; and, (3) whether the effect is different for different sized firms. The specific hypotheses are outline below.
Aim 1: To determine whether the fast-track designation is an effective signal.
Hypothesis 1A: The fast-track designation does provide a signal to investors.
Hypothesis 1B: The strength of the average fast-track signal decreases over time.
6
Aim 2: To determine whether the Orphan designation is an effective signal.
Hypothesis 2A: The Orphan designation does provide a signal to investors.
Hypothesis 2B: The strength of the average Orphan signal increases over time.
Hypothesis 2C: The strength of the average Orphan signal will be higher for smaller firms than for larger firms.
Aim 3: To determine whether having a prior Orphan designation increases the strength of a subsequent fast-track signal.
Hypothesis 3A: Having a stacked designation increases the strength of the signal, compared to a non-stacked designation.
Hypothesis 3B: The strength of the average stacked designation signal increases over time.
Hypothesis 3C: The strength of the average stacked designation signal will be higher for smaller firms than for larger firms.
7
Chapter 2 – The Signaling Effects of the Fast-Track Designation
Abstract
8
CARs of 6.53% after the announcement of a fast-track designation. In the second section, the study examines whether the strength of the fast-track signal changed over time due to investors updating their priors regarding the quality of the fast-track signal (between 1998 and 2004 for n=86 firms and 2005-2012 for n=110 firms). Findings suggest a decrease in CARs of almost 50% between the first years of the fast-track program, and the later years of the program. In the last section, the study analyzes whether the strength of the fast-track signal differs based on firm size. It finds CARs of 12.01% for the smallest firms and CARs of only 0.13% for the largest firms, possibly indicating significant differences in information asymmetries between different sized firms.
Introduction
Pharmaceuticals have evolved over the last hundred years from vaccines and antimicrobials to include everything from monoclonal antibodies to targeted therapies. It has been estimated that pharmaceutical innovation was the catalyst for over 40% of the longevity gains in the United States between 1970 and 1991.(4) In recent years, over $250 billion has been spent on prescription drugs annually in the United States, and pharmaceutical firms have spent over $65 billion a year on research and development (R&D).(5, 6) Pharmaceutical innovation, therefore, represents an important part of both the public’s health and the economy, and encouraging further innovation is an important policy objective.
9
information asymmetries. Specifically, it is difficult for investors to determine whether a drug will eventually be approved and brought to market. Although by 2008 over 100 approved drugs had reached the level of blockbusters, grossing over $1 billion a year in sales, this is the exception, not the rule; only one in nine new drugs to be studied in humans (investigational new drugs, INDs) ever gains regulatory approval. (7-10) Having a drug approved by the U.S. Food and Drug Administration (FDA) is the most important outcome of a development project, because if the drug fails, R&D costs cannot be recouped, and future profits cannot be used to fund new projects. If a drug is not going to be approved, it is desirable for it to fail early in the development process, as each stage of R&D costs more than previous ones.(11) Despite the importance of information regarding a drug’s likelihood of success to investors, pharmaceutical firms cannot share all drug development information due to the fear that other companies might utilize proprietary information for their own projects. For example, this could include sharing the molecular structure of a drug, or when patents on the drug are expected to expire. In order to overcome this information asymmetry, pharmaceutical firms may have used FDA drug designations to signal a drug’s likelihood of approval to investors.
10
likelihood of the drug’s potential success, and led to an increase in the stock price of the firm. Therefore, an event study methodology was used to determine the strength of the signal provided by a fast-track designation, where signal strength was measured by an abnormal increase in the stock price of a firm after the announcement occurred.
The study investigated three questions regarding the signaling effects of the fast-track designation. The first aim of this analysis was to determine whether the fast-track designation acted as a signal to investors over the period 1998 to 2012. The second aim of this research was to determine whether the strength of the average fast-track designation signal had changed over time. As new information became available, investors were able to see how well this designation predicted the future success of a drug, and thus they were likely to update their priors regarding how well this designation signaled the drug’s likelihood of approval.(13-15) The third aim of this research was to determine whether the fast-track designation had differing signaling effects for different sized firms. It was hypothesized that small firms benefited more from the fast-track designation than larger firms. These small firms may have had a limited or nonexistent track record for bringing drugs to market, and therefore there may have been greater information asymmetries between these firms and their investors. The announcement of a designation would therefore have caused a greater reduction in the information asymmetries, resulting in stronger signaling effects.
The Fast-Track Designation
11
process for approval.(16) The FDA had the ability to grant a fast-track designation to a drug if it met two criteria. First, the drug must have been used to treat a serious or life-threatening condition. Second, the drug must have met an unmet medical need.(12) A drug could meet an unmet medical need if it treated a condition for which no other therapy existed, or the drug provided a significant improvement over existing therapies. If a drug was indicated for multiple conditions that met the criteria for the designation, a firm could apply for fast-track designations for each of the conditions. The application process involved the firm submitting a written request for the designation to the FDA, along with supporting documentation regarding the drug’s indication and how it fills an unmet medical need. The FDA would review these materials to determine whether the drug met the congressionally mandated requirements for designation. As of 2008, the percent of applications for fast-track designation that subsequently received the designation was 74.5% for pharmaceuticals and 63.6% for biologics.(17) As of December 31st, 2012, there had been 712 fast-track designations conferred, on 669 unique drugs.(18)
12
to determine whether the drug would be approved for public use. A rolling review would allow the firm to submit sections of the NDA/BLA for review at different times, rather than submitting the entire NDA/BLA at one time, as was standard. This process could have allowed the application to be reviewed more expediently. A second incentive of the fast-track designation was that it allowed firms to have pre-NDA/BLA conferences with the FDA to discuss clinical trial designs and the composition of the NDA/BLA application.(17) While historically any firm was able to meet with the FDA to discuss clinical trial design, or any other concerns, the fast-track designation created a built-in mechanism for firms to request these meetings, by formally requiring the FDA to provide them when requested. Lastly, most fast-track drugs were also eligible for a priority review.(19) A priority review was given to drugs which treated serious conditions and demonstrated significant improvement, in safety or efficacy, over existing therapies. If the FDA granted a priority review, the time the FDA spent reviewing the drug was reduced to six months, from the standard ten months. This meant that, if approved, a drug could reach the market four months earlier, and was therefore able to generate profits sooner.(16)
Investor Reactions to Drug Development Announcements: Previous Studies
13
FDA. Sharma and Lacey (2004) found average abnormal returns (the assessed change in stock price due to the announcement) of 0.48% on the day of an approval announcement(21) while Sarkar and Jong (2006) found average abnormal returns of 0.35%.(22) Strum, Dowling, and Roder (2007) found average abnormal returns of 0.74% and 0.25% for biotech and pharmaceutical firms, respectively, on the day of announcement.(23) The authors suggested that these low abnormal returns may have been evidence that most of the information regarding the likelihood of an approval was incorporated before the official announcement.
Ahmed, Gardella, and Nanda (2002) studied the wealth effects on firms when an announcement of a drug withdrawal occurred.(13) They found abnormal returns of -7.85% on the day before and day of the announcement; but also found that the negative abnormal returns were much greater for firms whose drug had not yet been approved (-18.69%), than for those drugs which were withdrawn during post-market surveillance (-1.83%). Together, the results of previous studies suggest that much of the wealth effect created by a successful drug was already incorporated into the stock price before the drug was approved. Therefore, it was likely that early announcements in the drug development pipeline would be stronger signals to investors than announcements occurring later in development.
14
quartiles based on firm size, using market value of equity as the proxy. They found significantly higher abnormal returns for the smallest quartile than for the largest quartile. Alefantis, Kulkarni, and Vora (2005) also aimed to determine whether a fast-track designation would increase the stock price of a given firm. (3) Their sample was limited to any drug receiving a fast-track designation between 1998 and 2001 (n=26). The authors found an average positive stock price increase of 10.2%.
In sum, previous research suggested that between 1998 and 2004, announcement of a fast-track designation by pharmaceutical firms resulted in average abnormal returns of between 9 and 10.2 percent. Announcements of any event early in the drug development process were more likely to convey meaningful information to investors, as were announcements by smaller firms relative to larger firms. Building on these findings, this study examined the signaling effects of fast-track designations, contributing to existing knowledge in two significant ways. First, the sample period was increased to include the years 1998-2012. And second, a longitudinal analysis was performed to determine whether the strength of the fast-track signal had changed over time.
Study Theory Development
Signaling Theory
15
industry, for three central reasons. First, because most R&D projects (such as drug development projects) were unique to a firm, the R&D performance of a given firm in an industry did not convey any information regarding the R&D performance of other firms in the industry. Second, there were no organized markets for R&D, and therefore no set prices for it from which an investor could glean information. Lastly, accounting and reporting rules surrounding R&D were not set up to provide any indication of the value or productivity of the R&D expenditures.(24) These information asymmetries created the potential for adverse selection, where low quality pharmaceutical firms were able to act as high quality pharmaceutical firms to investors, and investors needed to use trial and error to determine which firms were high quality.(25, 26) Because this was not an optimal equilibrium for either investors or the high quality pharmaceutical firms, high quality firms needed to find a way to demonstrate the quality of drugs in their R&D pipeline to investors without divulging proprietary information. To demonstrate this, high quality pharmaceutical firms could use signals to show investors their true quality.
16
for a signal to separate high and low quality pharmaceutical firms for investors, it must be both observable and costly.
The standard signaling timeline is typically split into four periods: the first period, in which the signal has not yet been sent; the second period, in which the signaler has sent the signal to the receiver; the third period, in which the receiver has received the signal; and the final period, in which the receivers update their priors regarding the quality of the signal. (27) In event studies, the second and third periods are collapsed into a single period following the semi-strong form of the efficient market hypothesis. This hypothesis states that all information regarding a firm is immediately incorporated into its stock valuation as soon as the information becomes available.
The Fast-Track Designation as a Signal to Investors
17
Hypothesis 1: Investors perceived the fast-track designation as a positive signal of a drug’s quality over the period 2008 to 2012.
The fast-track designation satisfied all the theoretical criteria needed for being considered a signal of a drug’s future profits. Specifically, the designation was both costly and observable. Firms applied to the FDA for the designation, which was costly in terms of both employee time and monetary costs. While the monetary costs were fairly low to submit an application, they were not zero.(11) Additionally, firms were able to publicly announce the receipt of the designation, making it easily observable. Importantly, the FDA was a neutral, third-party gatekeeper with access to all current data on the drug. The firms were able to provide proprietary information to the FDA, which could not be revealed to investors, due to the FDA’s strict non-disclosure policies. The FDA also had no incentive to approve designations for drugs that did not meet the congressionally mandated standards for the designation. These two features ensured that the integrity of the fast-track signal was not compromised, and that firms with low-quality drugs could not easily (that is, at low cost) imitate those with high-quality drugs.
18
For this analysis, the signaling environment for the fast-track designation was conceptualized as comprising two parties and three time periods. The two parties were the signaler (the pharmaceutical firm that wished to show its underlying R&D pipeline quality) and the receiver (the investors who were deciding which firms to invest in). The signal was the announcement of the receipt of the fast-track designation. The three time periods were the period prior to the announcement of the fast-track designation, the period when the signal was sent by the firm and received by investors, and the period during which investors updated their priors regarding the quality of the signal’s information. Assuming the semi-strong form of the efficient market hypothesis means the value of the fast-track designation should be incorporated into a firm’s stock price as soon as the announcement is made. The second study question, discussed below, extends the final period, when receivers update their priors, to incorporate a longitudinal learning component.
Longitudinal Changes in the Strength of the Fast-Track Signal
The purpose of the fast-track designation was to signal to investors that a firm had a high quality drug, that is, a drug that had a high likelihood of generating future profits. However, over time there may have been a learning component to the investor’s evaluation of the signal’s informational quality.(15, 26) Specifically, if the average fast-track designation was not highly correlated with subsequent marketing approval, and therefore the ability to generate profits, then investor’s perceptions of the value of information conveyed by the signal may have decreased over time.
19
was given to drugs that were used to treat a serious or life-threatening condition, which typically had a lower regulatory approval hurdle.(19) However, the actual regulatory outcomes of fast-track drugs were significantly lower than expectations. As of 2008, of the drugs that had received a fast-track designation, only 10.6% of the pharmaceuticals and 17.7% of the biologics were subsequently approved.(17) In comparison, during approximately the same time period, the overall Investigational New Drug (IND; clinical trial phase of drug development) success rate was 20.9%.(7) Therefore, over time, investors were able to see that drugs that received a fast-track designation actually had a lower rate of approval than the average new drug that did not receive a fast-track designation. It was then likely that, acting as rational actors, investors updated their priors regarding their perception of the fast-track designation as a signal of drug quality. The second aim of this research was to determine whether, over time, the strength of the fast-track signal changed as investors updated their priors regarding the quality of the signal’s information. This led to the second hypothesis:
Hypothesis 2: The magnitude of the fast-track signal was higher for the earlier announcements than it was for later announcements.
20
accumulated the aggregate amount of information necessary for them to have reassessed their prior that the fast-track designation had positive predictive power that a drug would be subsequently approved.
21
analysis was therefore split into pre- and post-2004 time periods to compare the strength of the fast-track signal.
The Strength of the Fast-Track Signal by Firm Size
A central ancillary benefit of the fast-track designation signal was to reduce information asymmetries between firms and investors. The previous aims of this study set out to determine the magnitude of the signal, as a proxy of investor’s perceptions of its quality. This third aim of the research was undertaken to determine whether the magnitude of the signal differed by firm size. Such a finding would suggest heterogeneity in information asymmetries between different sized firms and investors. (2, 31-33)
22
produce another $100 million in annual profit, then the firm had increased its annual profit by 100%, and investors should have appreciated the gain accordingly. In contrast however, if a large firm, with annual profit of $1 billion were to bring the same drug to market, the annual profit would have only increased by 10%, an entire order of magnitude lower. And while investors should have responded positively to this approval, the magnitude of the response would likely be lower than for the smaller firm.
Lastly, investors may have already expected larger firms to go after these designations, as they had the infrastructure and institutional knowledge to be able to successfully apply for them.(36) Therefore the information conveyed by an announcement of the receipt of a fast-track designation by a larger firm would have conveyed less unanticipated information, causing a decrease in the magnitude of the market response compared to a smaller firm. In contrast, the announcement of the receipt of a designation by a smaller firm would likely have been met with a higher market response as obtaining the designation was likely more costly, and investors gained more unanticipated information from the fast-track signal for a small firm. The theory surrounding differences in the fast-track signal by firm size led to the third hypothesis: Hypothesis 3: The magnitude of the fast-track signal was higher for the smallest firms than it was for the largest firms.
Methods
Defining the Event Timeline
23
stock at the time of the announcement of the fast-track designation. For this analysis, an estimation window of 110 trading days (t= -121, -11) was used, where t= 0 was the day of the announcement.(22) The event window encompassed the days over which the abnormal returns precipitated by the announcement were expected to occur, and an event window of t= 0, 1 was used. While the semi-strong form of the efficient market hypothesis theorized that all public information should have been immediately incorporated into a stock price after the fast-track designation was announced, the trading day after the announcement was included in the event window due to the sometimes obscure nature of the announcement, and to stay consistent with the literature in using a multi-day event window.(15)
Figure 2.1 Event Study Timeline
Calculating the Expected Returns
24
analysis had multiple instances of fast-track announcements on the same or close days, which could cause cross-correlation in the residuals, the market model was deemed the best fit.
The market model for a single event was calculated as expressed in Equation 1. In this model, 𝑅𝑖,𝑡 and 𝑅𝑚,𝑡 were the period t returns on the stock of firm 𝑖 and the representative market portfolio, respectively. Conceptually, if a perfect linear relationship between the market return and an individual stock return were expected, 𝛼𝑖 (the intercept term) and 𝛽𝑖 (the slope term) should have perfectly predicted the individual stock return𝑅𝑖,𝑡, and 𝜖𝑖,𝑡 should therefore have been mean zero. Unexplained deviations from this relationship would be picked up by the error term, which was the basis for calculating the abnormal returns.
𝑅𝑖,𝑡 = 𝛼𝑖 +𝛽𝑖𝑅𝑚,𝑡+𝜖𝑖,𝑡 (1)
The S&P 500 Composite Index was used to measure the market return. This index has been widely used in the literature, and had the added benefit of containing numerous pharmaceutical and biotech firms, ensuring that it picked up both market and industry effects.(21, 35, 39)
Calculating the Cumulative Abnormal Returns
The abnormal returns, 𝜖̂𝑖,𝑡 , were calculated using Equation 2.(37, 40, 41)
𝜖̂𝑖,𝑡 = 𝑅𝑖,𝑡− 𝑎�𝑖,𝑡− 𝑏�𝑖,𝑡𝑅𝑚,𝑡 (2)
25 The GRANK-T Significance Test
The standard method of testing the statistical significance of CARs in the event study literature involved parametric tests. However, as abnormal stock returns are typically non-normally distributed, evidence suggests that nonparametric tests should be used for significance testing in event studies.(40) A limitation of previous nonparametric tests was that they could not be accurately extended to encompass multiple event days.(42, 43) This shortcoming was addressed in the nonparametric generalized rank t-test, known as the GRANK-T test, described in Kolari and Pynnonen (2011).(38) GRANK-This test accounted for the multiple event days problem by condensing all the CARs of multiple event days into one observation, which was then used to conduct the significance test. The authors showed that the empirical power of their test was stronger than other popular parametric and nonparametric tests of CARs that had been used previously. Additionally, the test was found to be robust against the cross-correlation caused by event day clustering. As there were multiple instances in the data where this occurred, this was a further benefit of choosing this particular test. This test was used to determine the statistical significance of the CARs for all three hypotheses.
The Wilcoxon Rank Sum Significance Test
26
test the hypothesis that there were statistically significant longitudinal changes in the CARs between 1998-2004 and 2005-2012.
Data
The announcements of the receipt of a fast-track designation were found via a systematic, manual search of LexisNexis using the search terms “fast track” and “FDA”. A total of 442 announcements were found, spanning the time period 1998-2012. Stock data were extracted from the Center for Research in Securities Prices (CRSP). Data included both the daily returns for individual firms, as well as the daily returns for the S&P 500 Composite Index used as the market return. Market capitalization, the market value of the firm’s trading and non-trading share issues, was used as the proxy for firm size.(44) The market cap data from the year the designation was announced were extracted from the “market value” variable in Compustat.
Exclusion Criteria
Once the announcements of a fast-track designation were gathered, the following exclusion criteria were applied to ensure that the event study methodology could be used.
First, designations for drugs that had been previously approved by any worldwide drug regulatory agency were excluded because they were likely inherently different from announcements for drugs which had not been approved. Approved drugs were much less uncertain to investors, as their safety and efficacy profiles were public and well known. A total of 22 announcements were excluded for this reason.
27
The second was that data for the full time period were not available from CRSP. (There were many possible reasons for this, including the firm going public sometime during the time period, or getting acquired during the time period.) A total of 168 announcements were excluded due to this exclusion criterion.
Lastly, the remaining firms were excluded if another significant event occurred during the event window (t= 0, 1). This was to ensure that there were no confounding events within the event window. Observations were excluded if one of the following was announced during the event window: (a) general drug news (e.g., clinical trial results, patent received, drug approved, grant received, other designation received); (b) financing news (e.g., common stock offering, credit downgraded, debt financing); (c) leadership news (e.g., senior leadership resigning, being hired, or optioning stock); (d) firm news (e.g., merger/acquisition announced or finalized, partnership deal announced, licensing deal announced). A total of 55 announcements were excluded due to this criterion.
Additionally, one announcement was excluded from the analyses because it was an outlier in its abnormal returns. In event studies, it is necessary to check for outliers because they are inherently different from the other events, and biased CARs can strongly affect the conclusion of a study.(35, 45)
Final Data
28
cap data, resulting in a total sample size of 154 firms. Of those firms, 12 were classified as nano-cap (market nano-cap less than $50 million), 48 were classified as micro-nano-cap (market nano-cap between $50 and $250 million), 71 were classified as small-cap (market cap between $250 million and $2 billion), and 23 were classified as mid-cap (market cap between $2 and $10 billion). There were no firms in the final sample with a market cap greater than $10 billion.
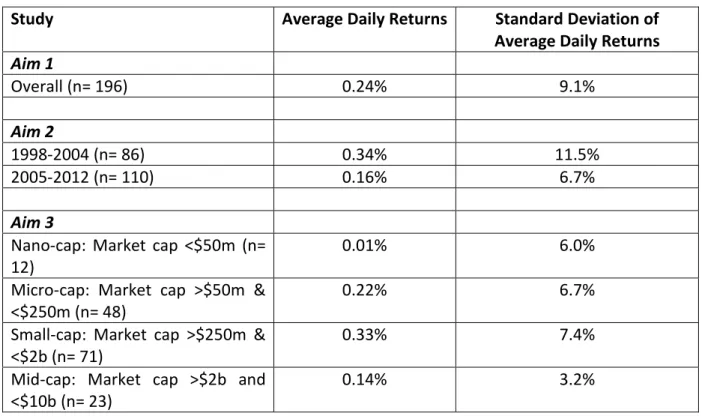
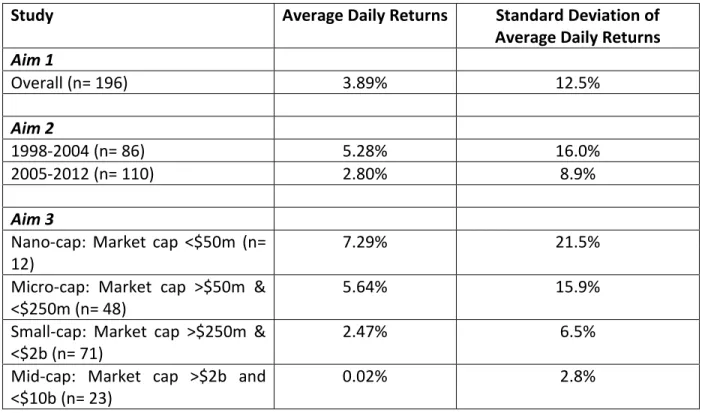
Average daily returns calculated during the estimation window (t= -121, -11) showed minimal abnormal returns (Table 2.1). The returns were especially small for the nano-cap firms, as well as for the second time period of the longitudinal analysis. Average daily returns calculated during the event window (t= 0, 1) showed substantial increases in daily returns, except for the largest firms (Table 2.2).
Table 2.1 Average Daily Returns for Estimation Window (-121, -11)
Study Average Daily Returns Standard Deviation of
Average Daily Returns Aim 1
Overall (n= 196) 0.24% 9.1%
Aim 2
1998-2004 (n= 86) 0.34% 11.5%
2005-2012 (n= 110) 0.16% 6.7%
Aim 3
Nano-cap: Market cap <$50m (n=
12) 0.01% 6.0%
Micro-cap: Market cap >$50m &
<$250m (n= 48) 0.22% 6.7%
Small-cap: Market cap >$250m &
<$2b (n= 71) 0.33% 7.4%
Mid-cap: Market cap >$2b and
29
Table 2.2 Average Daily Returns for Event Window (0, 1)
Results and Discussion
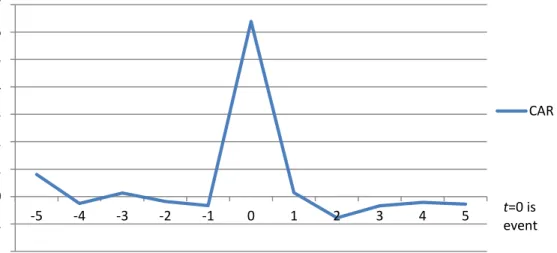
The cumulative abnormal returns found over the entire time period were 6.53%, which was statistically significant at the 10% level (Table 2.3 and Figure 2.2). This result implied that the announcement of a fast-track designation caused the average firm’s stock price to increase by 6.53% over what it would have been had the announcement not occurred. Although statistical significance was weak, this finding provided some support for the first hypothesis: that investors perceived the fast-track designation as a positive signal of drug quality. The 6.53% CARs were substantially greater than those found when a drug was approved, and were similar in absolute value to those found when a drug was withdrawn from the market, as previously discussed. This suggests that investors perceived the fast-track designation as conveying about as much positive information as a drug withdrawal provided negative information.
Study Average Daily Returns Standard Deviation of
Average Daily Returns Aim 1
Overall (n= 196) 3.89% 12.5%
Aim 2
1998-2004 (n= 86) 5.28% 16.0%
2005-2012 (n= 110) 2.80% 8.9%
Aim 3
Nano-cap: Market cap <$50m (n=
12) 7.29% 21.5%
Micro-cap: Market cap >$50m &
<$250m (n= 48) 5.64% 15.9%
Small-cap: Market cap >$250m &
<$2b (n= 71) 2.47% 6.5%
Mid-cap: Market cap >$2b and
30
Figure 2.2 Graph of Cumulative Abnormal Returns Between (-5, 5)
These results deviated substantially from the previous event studies of the fast-track designation, where Anderson and Zhang, and Alefantis, Kulkarni, and Vora found CARs of between 9% and 10% after the announcement of a fast-track designation. Abnormal returns found in this analysis were between 2.5 and 3.5 percentage points lower, or about 50% lower on average. This discrepancy may have been caused by the small time frame utilized in the previous studies (four to seven years versus the 15 years used by this study), particularly if investors lost confidence in the positive signal of the fast-track designation over time.
Table 2.3 Results of Main Analyses
Study Cumulative Abnormal
Returns GRANK-T Test Statistic Aim 1
Overall (n= 196) 6.53% 1.69*
Aim 2
1998-2004 (n= 86) 8.63% 1.79*
2005-2012 (n= 110) 4.89% 1.35
Aim 3
Nano-cap: Market cap <$50m (n= 12) 12.01% 2.36** Micro-cap: Market cap >$50m & <$250m (n= 48) 9.27% 3.92*** Small-cap: Market cap >$250m & <$2b (n= 71) 4.42% 1.10
-2 -1 0 1 2 3 4 5 6 7
-5 -4 -3 -2 -1 0 1 2 3 4 5
CAR
31
Mid-cap: Market cap >$2b and <$10b (n= 23) 0.13% 0.24
***statistically significant at the 1% level; **statistically significant at the 5% level; *statistically significant at the 10% level
Longitudinal Analysis
There was some evidence to support the second hypothesis of a longitudinal change in investor perceptions of the fast-track designation (Table 2.3 and Figure 2.3). During the first seven years of fast-track designation (1998-2004), this study found CARs of 8.63%, which was statistically significant at the 10% level, and almost identical to the approximately 9% CARs found by Anderson and Zhang during the same time period. However, in the most recent eight years of the fast-track designation (2005-2012), this study found CARs of only 4.89% (not statistically significant). Although the Wilcoxon rank sum test did not identify a statistically significant difference between the two CARs (z = -0.90), practically, this difference, a decrease of almost 50% in the cumulative abnormal returns, was large.
32
Figure 2.3 Graph of the Longitudinal Cumulative Abnormal Returns Between (-5, 5)
Firm Size Analysis
The results of the analysis of signal strength by firm size were striking, and provided strong support for the third hypothesis. The smallest firms, the nano-caps with a market cap of less than $50 million, had CARs of 12.01% after a fast-track designation was announced, and the result was statistically significant at the 5% level (Table 2.3 and Figure 2.4). These CARs were almost twice as large as those found for the study sample overall. The magnitude of the CARs fell only slightly for the micro-caps to 9.27% relative to the nano-caps, and the result was statistically significant at the 1% level. The CARs for the small-cap and mid-cap firms were 4.42% and 0.13%, respectively, and neither result was statistically significant.
These results suggest significant heterogeneities by size of firm for the signaling effects of the fast-track designation, and therefore provide compelling support for the hypothesis that there are different levels of asymmetric information between investors and firms based on firm size. The theory suggested that the information asymmetries between smaller firms and investors would be greater than those for larger firms. Smaller firms may have had a smaller, or
-2 0 2 4 6 8 10
-5 -4 -3 -2 -1 0 1 2 3 4 5
CARs 1998-2004 CARs 2005-2012
33
non-existent, history of producing successful drugs. Therefore, investors would have had less overall information with which to assess a particular drug’s likelihood of successful development by a smaller firm. The results of the study supported this hypothesis. The difference of almost 12 percentage points in CARs between the largest firms and the smallest firms indicated that investors valued the information provided by the fast-track designation significantly more for small firms. This suggested that the fast-track designation reduced investor information asymmetries substantially for the smaller firms, while providing no statistically significant reduction in asymmetries for the largest firms.
Figure 2.4 Graph of the Cumulative Abnormal Returns by Firm Size Between (-5, 5)
Sensitivity Analyses
Sensitivity analyses for the first hypothesis indicated that the overall CARs were robust to extensions of the event window after the event occurred (Table 2.4). No additional increases in CARs were observed after the announcement of a fast-track designation. However, when the
-3 -2 -1 0 1 2 3 4 5 6 7 8
-5 -4 -3 -2 -1 0 1 2 3 4 5
CARs- Nano CARs- Micro CARs- Small CARs- Mid
34
event window was extended to include the day prior to the event, a gain in CARs of approximately 0.2 percentage points was observed. The CARs during the (-1, 1) event window were 6.72%, and were statistically significant at the 1% level. This was most likely due to the different sample of firms that was included in the analysis when the event window was extended. Sixteen firms were removed because they had concurrent events during t= -1. During the (0, 1) window, the removed firms had CARs of 1.84%, while the remaining sample, which was used in the (-1, 1) window, had CARs of 6.95%. This indicated that the removal of these firms possibly caused a spurious inflation of the CARs in the (-1, 1) event window. However, it cannot be ruled out that part of this result was caused by some form of early information on the part of investors.(24) Multiple other event studies of the pharmaceutical industry also found abnormal returns on the day prior to an event.(13, 15, 21-23, 37)
Sensitivity analyses for the second hypothesis substantiated the hypothesized break point of 2004-2005 in the longitudinal analysis (Table 2.4). Analyses comparing the 1998-2003 vs. 2003-2012 and 1998-2006 vs. 2007-2012 time periods also found substantially decreasing CARs, although the declines continued to be statistically insignificant. As these sensitivity results did not differ substantially from the originally hypothesized break point, the original break point was deemed reasonable.
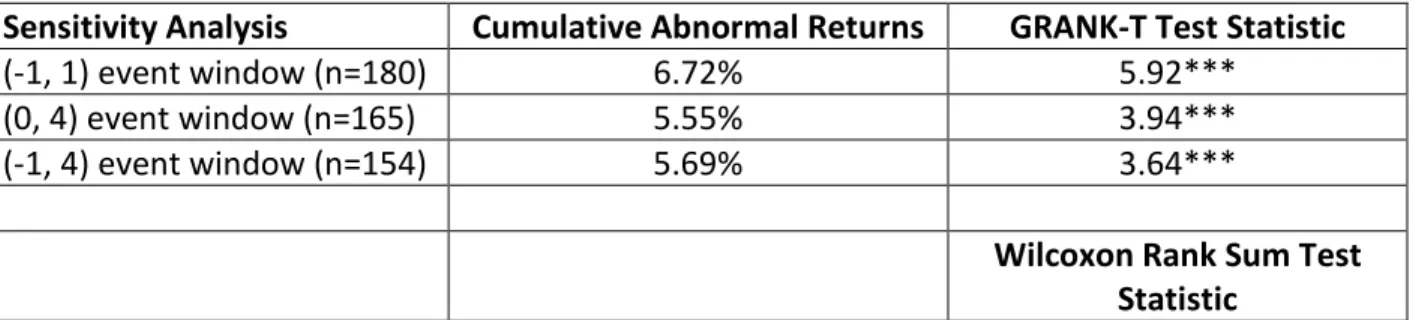
Table 2.4 Results of Main Sensitivity Analyses
Sensitivity Analysis Cumulative Abnormal Returns GRANK-T Test Statistic
(-1, 1) event window (n=180) 6.72% 5.92***
(0, 4) event window (n=165) 5.55% 3.94***
(-1, 4) event window (n=154) 5.69% 3.64***
35
1998-2002 (n=40) 8.43% -1.30
2003-2012 (n=156) 6.04%
1998-2006 (n=134) 7.25% 0.76
2007-2012 (n=62) 4.97%
***statistically significant at the 1% level
A sensitivity analysis was also conducted around data overlaps, that is, when a firm had an announcement occur during the estimation window of a separate announcement by the firm. It was possible that this data overlap would cause bias in the coefficients, although other event studies of the pharmaceutical industry did not find any bias.(37, 45) There were 14 occurrences (28 observations) of overlap in the data. Removing the first of the overlapping announcements led to overall CARs of 6.61%, and removing the second of the overlapping announcements led to overall CARs of 6.66%. This very limited difference from the overall CARs of 6.53% indicated that bias due to data overlap was not a serious threat to this analysis.
36 Limitations
One limitation of this study was that it was possible that the manual search for the fast-track announcements failed to find some early announcements, and therefore the date of announcement set for the analysis was mis-specified. It was also possible that the manual search for announcements failed to find some of the announcements that occurred. However, as long as there was no systematic failure in finding announcements, this should not cause bias in the results.
37
A third limitation arises from the second part of the exclusion criteria that limited the sample to only firms that had no other announcements during the event window. It is possible that this excluded larger firms disproportionally, and therefore the results are not generalizable to the largest firms that received the fast-track designation. A simple calculation was conducted to identify whether large firms, defined as those with brand name recognition at the time of announcement, were more likely to be excluded from the sample. In the sample of announcements which remained after the first exclusion criteria was applied (that firms must be publicly listed on a US exchange), approximately 11% of the sample was composed of these large firms. In the final sample, once the event window exclusion criteria had been applied, this figure had decreased to approximately 4%. These results indicate that the proportion of large firms that was in the sample may have declined by as much as two-thirds due to concurrent events. This limitation in generalizability may therefore be substantial, and the results of this study may not apply to the largest of pharmaceutical firms.
While the limitations described above may limit the generality of the results, they are a known cost of using the event study methodology. Future research should focus on determining the effects of the designation on large firms, private firms, and foreign firms, which may involve a mixed-methods approach.
38
increasing investor awareness of lesser known firms. Further analysis should be done to determine the long-term effects of this designation on investment.
Conclusion
Publicly traded pharmaceutical firms and their investors have always faced information asymmetries. The intensive R&D nature of the pharmaceutical industry has created valid concerns about releasing propriety information that could reduce information asymmetries, but could also be used to co-opt a firm’s competitive advantage in drug development. Since continued investment was critical to funding the drug development projects of these pharmaceutical firms, firms needed to signal to investors that there was value in the investment. This was especially true for smaller firms that did not have a history of successfully approved drugs that could both inform investors and provide a source of cash flow for funding current projects. This study analyzed whether the FDA fast-track designation was effectively used to signal to investors the value of a drug in development. Utilizing an event study methodology and a non-parametric test for statistical significance, the analysis found that the announcement of a fast-track designation did act as a signal to investors. Additionally, it found that the strength of the signal changed over time, as investors updated their priors regarding the value of the designation after observing the success, or failure, of previous designated drugs. Finally, the study found that the fast-track designation reduced investor information asymmetries substantially for the smallest firms, while providing no statistically significant reduction in asymmetries for the largest firms.
39
designation continued to be met. Congress’s goal in creating the fast-track destination was to speed drug development for serious or life-threatening conditions for which there was an unmet medical need. The implicit impact of this speed was that more drugs would be approved, to be used by patients. The degree to which investors react to the designation is a rough proxy for how successful these drugs are in obtaining marketing approval. The declining signaling effects of the designation may have implied that investors felt less confident in the information a fast-track designation supplied: which would be a strong correlation between receiving the designation and receiving a speedy regulatory pathway and approval. This implies that the fast-track designation may be failing to meet its goal of supporting clinically needed drug development. Second, the results of the firm size analysis suggested that the signaling benefits of the fast-track designation were disproportionately going to the smallest firms. This was not necessarily outside the intended actions of the designation, but policymakers should be aware that this has been its effect, and adjust future policies as needed.
40
Chapter 3 – The Signaling Effects of the FDA Orphan Designation
Abstract
The Orphan drug designation was created by Congress in 1983 to encourage drug development for rare diseases. The designation provided multiple financial incentives that aimed to decrease the costs to pharmaceutical firms of developing these drugs. It was hoped that the incentives would increase the amount of investment in rare disease drug development programs by allaying investors’ fears that the costs of developing these drugs would far outweigh the expected profits of the drugs. This study sought to determine whether investors perceived the awarding of an Orphan designation as a signal of the drug’s expected profits. Using an event study methodology, the analysis found that, on average, a firm’s stock price increased by 3.66% after the awarding of the designation was announced, as compared to what it would have been had there been no announcement. The study also found that investors’ perceptions of the designation improved over time, and that the designation increased the stock price more for smaller firms than for larger firms. Therefore, the results implied that the Orphan designation was successful in increasing investor’s perceptions of a drug’s expected profits, and therefore was also potentially successful in its goal of increasing investment in drug development for rare diseases.
Introduction
41
treatments. Since its creation through the Food, Drug and Cosmetics Act of 1938, the FDA has undertaken numerous public policy initiatives to foster this goal. These initiatives range from public-private partnerships, to greater transparency of FDA processes, to special designations that provide incentives for drug development in areas of unmet medical need.
A central part of encouraging innovative drug development was encouraging initial, and continuing, investment in drug development projects. This was especially true for drug development for rare diseases, where the potential market size for a drug was typically too small to justify the research and development (R&D) costs necessary to bring a drug to market. In 1983, Congress created a special designation for drugs in development that were indicated to treat a rare disease.(46) This was the Orphan designation, and it also conveyed tangible financial incentives to the developer of the drug (such as making some clinical trial expenses tax deductible).
42
number of new molecular entities (NMEs), or new innovative drugs, approved yearly – has been relatively stable since the 1980s.(48)
This analysis evaluated how investors responded to the Orphan designation over time, thereby acting as a proxy for how successful the designation was in generating investment in drugs for rare diseases. An event study methodology was used to determine whether investors viewed the Orphan designation as increasing the expected profits of a drug, as measured by increasing investment in the firm once the awarding of an Orphan designation was announced. If investors perceived the Orphan designation as increasing expected profits, then there may have been greater investment in innovative rare disease drug development, consistent with the aim of this FDA program.
Background
History of the Orphan Drug Designation
43
To receive an Orphan designation, a firm submits a standardized application to the FDA to request the designation, along with supporting documentation that shows rare disease status for the disease that drug is being indicated to treat. There were no additional requirements for receiving the designation. If a firm was successful in applying for the designation, it was eligible for multiple financial benefits.(51) First, some clinical trial expenditures for the development of the drug were made tax deductible. This was a less important benefit for small firms, which usually did not have any, or had low, tax liabilities as they were not yet profitable. However, for larger firms, this could have helped make the development of these drugs less costly to develop. Second, if the firm submitted the drug for regulatory approval, the user fees were waived. This decreased the cost of development significantly for both large and small firms. Average user fees in fiscal year 2014 for submission with clinical trial data were over $2 million.(52) Last, if the drug was eventually approved, it received seven years of marketing exclusivity, which was two years more than for new drugs without an Orphan designation. This increased the potential profit stream for both large and small firms. In addition to conferring direct financial incentives, drugs with an Orphan designation were generally eligible for a priority review, and some were eligible for an accelerated approval, both of which shortened the potential time to market.
44
an Orphan designation were approved.(53) Additionally, since 2002, approximately 30% of all approved NMEs have been Orphan drugs.(53)
The Literature on FDA Designation Event Studies
An extensive search of the literature did not find any previous studies that examined how investors responded to an Orphan designation using an event study methodology. However, there have been two studies that have examined the signaling effects of the fast-track designation, another FDA designation given to drugs that are for serious or life-threatening conditions and treat an unmet medical need. While not looking at the Orphan designation, these studies could provide a starting point from which to compare investor reactions to FDA designation.
fast-45
track designation between 1998 and 2001 that they were able to identify through a news database search (n=26). The authors found an average positive stock price increase of 10.2%. Conceptual Framework
In this study, the Orphan designation was conceptualized as signaling unobserved information about a drug’s potential profitability. Information asymmetry, where firms have more information about a drug’s potential for success than investors, has always been a critical problem in the investor-firm relationship. Firms are limited in the amount of information they can divulge to investors due to the need to safeguard proprietary information. These problems are magnified in R&D intensive industries, such as the pharmaceutical industry. This information asymmetry creates the potential for adverse selection, where low quality firms are able to portray themselves as high quality firms to investors, and investors must use trial and error to determine which firms are high quality. Because this is not an optimal equilibrium for either investors or the high quality firms, high quality firms need to find a way to demonstrate their quality to investors without giving up proprietary information. To demonstrate this, these firms can use signals to show investors their true quality.
The Orphan Designation as a Signal to Investors
46
cost of developing the drugs, and allowing for an extended earnings stream if the drug reached the market, thereby increasing the expected profits of Orphan drugs.
Because of the design of the incentives, however, many of the tangible benefits of the Orphan designation were only valuable at later stages of a drug’s development. Therefore, the immediate value of the designation was dependent on its ability to signal to investors information about a drug’s lifetime expected profits. If investors viewed the Orphan designation as increasing a drug’s expected profits, then investors were expected to respond favorably to a firm’s announcement of receipt of the designation by increasing their investment in the firm. This framework led to the study’s first hypothesis: announcement of the receipt of an Orphan designation provided a positive signal about expected profits to investors.
The Strength of the Orphan Designation Signal Over Time
The Orphan designation has made substantial gains since its introduction in 1983: from being a new and unknown tool at its inception, the Orphan designation is now a part of 30% of all NME approvals. This statistic alone shows that Orphan drugs have become a substantial part of the overall drug development pipeline. Additionally, Orphan drugs have become more financially successful than anticipated. Beginning in the early 2000’s, numerous scientific breakthroughs in Orphan conditions were beginning to finish clinical development, and many Orphan drugs saw tremendously high reimbursement rates from insurers, in the hundreds of thousands of dollars per patient, per year.(54)
47
felt about the Orphan designation’s ability to signal increased expected profits. This confidence would translate into greater investment in firms that received an Orphan designation in later years. Because 2000 was the year before Orphan designated drugs became a major sector of the drug development pipeline, after 2000 investors would have been expected to place more value on an Orphan designation. This development led to the study’s second hypothesis: the strength of the Orphan signal was greater in the most recent years of the designation than in the initial years.
The Strength of the Orphan Designation Signal by Firm Size
While the Orphan designation conveyed tangible financial benefits to any recipient firm, these benefits may have been more valuable to some firms than others. Specifically, these benefits were likely more valuable to smaller firms than larger ones. In large firms, the financial benefits conveyed by the designation offset some of the initial costs of development, and the additional exclusivity ensured that profitability would be extended if the drug were approved. However, while important, the overall magnitude of these benefits was not particularly large when compared to the sales volume of most of these firms. In contrast, the value to smaller firms may have been significant.
48
Investors in small pharmaceutical firms may therefore have found the award of an Orphan designation relatively more important as a signal of the drug’s expected profits. The designation decreased the amount the firm would have to spend developing the drug, and therefore decreased the risk of the firm becoming insolvent and increased the speed at which the development process could progress, both of which would have significantly increased the drug’s expected profits. Therefore, investors should have reacted more favorably to an Orphan designation received by a smaller pharmaceutical firm than a larger pharmaceutical firm. This led to the study’s third hypothesis: the strength of the Orphan signal was greater for smaller firms than for larger firms.
Methods
49
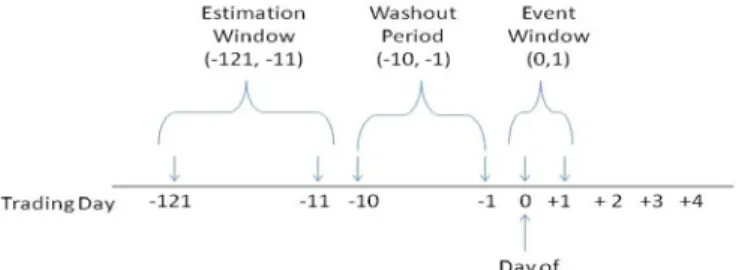
The event timeline included three periods: the estimation window, the washout period, and the event window (Figure 2.1). The estimation window was defined as a period of time prior to the event, and was used to estimate the expected return. This analysis used the 120 trading days prior to the public announcement by a firm of award of the Orphan designation, through the 11 trading days prior to the event, as the estimation window (t= -121,-11).(22) The washout period was defined as the 10 days before the event occurred (t= -10,-1), and was used to provide a buffer between the estimation window and event window, to ensure that the expected returns were not biased by any near-event occurrences. The event window was the period of time during which the effects of the event were expected to be reflected in the firm’s stock price. For this analysis, the event window was defined as the day of the event (t= 0) plus the day after the event (t= 1). The day after the announcement of the Orphan designation was included in the event window to capture any residual reactions from investors.
50
𝑅𝑖,𝑡 = 𝛼𝑖 +𝛽𝑖𝑅𝑚,𝑡+𝜖𝑖,𝑡 (1)
The abnormal returns, 𝜖̂𝑖,𝑡 , were calculated using Equation 2.(40, 41) The abnormal returns could be interpreted as the investors’ reaction to the event for the individual firm.
𝜖̂𝑖,𝑡 = 𝑅𝑖,𝑡− 𝑎�𝑖,𝑡− 𝑏�𝑖,𝑡𝑅𝑚,𝑡 (2)
Finally, the abnormal returns were aggregated by individual firms across time and then aggregated across both firms and time, known as the cumulative abnormal returns. The cumulative abnormal returns were interpreted as the investors’ reactions to the event at large; the average reaction to the event over all firms.
Specifications for Longitudinal and Firm Size Analyses
The time period covered by the study was 1983-2012. The longitudinal analysis examined the difference in cumulative abnormal returns in the two time periods 1983-2000 and 2001-2012, with break point determined as outlined in the conceptual framework.
In the firm size analysis, market capitalization, the market value of the firm’s trading and non-trading issues, was used as the proxy for firm size.(44) Firms were stratified into four sizes based on market cap: less than $50 million, known as nano-cap firms; between $50 and $250 million known as micro-cap firms; between $250 million and $2 billion, known as small-cap firms; and, between $2 and $14 billion, known as mid-cap firms. Cumulative abnormal returns were analyzed separately for each firm size category, and the differences between them were compared.
Significance Testing