CHARTER SCHOOL EFFECTS ONCHARTER SCHOOLSTUDENTS ANDTRADITIONALPUBLIC
SCHOOL STUDENTS IN NORTHCAROLINA
Joshua Horvath
A dissertation submitted to the faculty at the University of North Carolina at Chapel Hill in par-tial fulfillment of the requirements for the degree of Doctor of Philosophy in the Department of
Economics.
Chapel Hill 2018
Approved by:
Jane Cooley Fruehwirth
Doug Lauen
Klara Peter
Helen Tauchen
c
2018
ABSTRACT
Joshua Horvath: Charter School Effects on Charter School Students and Traditional Public School Students in North Carolina
(Under the direction of Jane Cooley Fruehwirth)
National growth of school choice has raised concerns about charter school effects on charter students and students left in traditional public schools (TPSs), particularly disadvantaged and minority students. The shift in North Carolina (NC) charters to serving higher-achieving students supports this concern. While much is known about charter school effects on charter students in primary school, much less is known about charter high school effects, and how charters affect TPS students.
My dissertation fills this gap in two ways. First, I use data covering all 9th grade public school students in NC from 2005 to 2016 to examine charter high school effects on charter student academic outcomes. I use propensity score matching and find that charters increase student English 1 and ACT scores, and decrease GPA. Charter school entrants (not in a charter in 8th grade) are more likely than TPS students to be retained in 9th grade and less likely to graduate in four years. These negative effects are significantly larger for black charter entrants than white charter entrants.
Second, I use panel data covering all public school students in NC from 1997 to 2016 to examine charter school effects on TPS student test scores in grades three through eight. Controlling for student and school fixed effects, I find no overall effect from competition, but higher-achieving charter competition has small positive ef-fects. Lower-achieving competition has zero to small negative effects and, unlike higher-achieving competition, increases achievement gaps for some disadvantaged and minority populations.
ACKNOWLEDGMENTS
TABLE OF CONTENTS
LIST OF TABLES . . . viii
LIST OF FIGURES . . . xi
1 INTRODUCTION TO CHARTER SCHOOLS AND THE RELEVANT LITERATURE . . . 1
1.1 Introduction . . . 1
1.2 Background . . . 4
1.3 Literature Review . . . 5
1.3.1 Charter Elementary and Middle School Effects on Charter Students . . . 5
1.3.2 Charter High School Effects on Charter Students . . . 8
1.3.3 Charter Elementary and Middle School Effects on Traditional Public School Students . . . 10
2 CHARTER SCHOOL IMPACTS ON HIGH SCHOOL ACADEMIC OUT-COMES IN NORTH CAROLINA (CO-AUTHORS SARAH CRITTEN-DEN FULLER, DOUG LAUEN, AND ANDREW MCEACHIN) . . . 15
2.1 Introduction . . . 15
2.2 Data . . . 17
2.2.1 Descriptive Statistics . . . 17
2.3 Analysis . . . 19
2.3.1 Charter 8th Grade Control . . . 22
2.3.2 Robustness Checks . . . 23
2.3.3 Heterogeneity by Student Characteristics . . . 24
2.3.4 Heterogeneity by School Characteristics . . . 24
2.4 Results . . . 25
2.4.2 Main Results . . . 25
2.4.3 Robustness Check Results . . . 27
2.4.4 Heterogeneity by Student Characteristics Results . . . 28
2.4.5 Heterogeneity by School Characteristics Results . . . 29
2.5 Conclusion . . . 29
3 THE EFFECTS OF CHARTER SCHOOLS ON TRADITIONAL PUB-LIC SCHOOL STUDENTS IN NORTH CAROLINA . . . 44
3.1 Introduction . . . 44
3.2 Data . . . 47
3.2.1 Time Periods . . . 48
3.2.2 Measures of Competition . . . 48
3.2.3 Summary Statistics . . . 51
3.3 Empirical Strategy . . . 52
3.3.1 Empirical Model . . . 52
3.3.2 Persistence . . . 55
3.3.3 Robustness Checks . . . 56
3.3.4 Heterogeneity by School Type . . . 61
3.3.5 Heterogeneity by Student Type . . . 61
3.3.6 School Level Effects . . . 61
3.4 Results . . . 62
3.4.1 Main Results . . . 62
3.4.2 Persistence Results . . . 63
3.4.3 Robustness Check Results . . . 64
3.4.4 Heterogeneity by School Type Results . . . 66
3.4.5 Heterogeneity by Student Type Results . . . 67
3.4.6 School Level Effects Results . . . 68
3.5 Conclusion . . . 70
A APPENDIX FOR THE EFFECTS OF CHARTER SCHOOLS ON TRA-DITIONAL PUBLIC SCHOOL STUDENTS IN NORTH CAROLINA . . . 89
A.1 Geocoding . . . 89
A.2 Split Competition Measures . . . 90
A.3 Relative Achievement Defined by School Achievement Lags . . . 92
A.4 Varying Attrition Cut-Off Levels . . . 94
A.5 Remove Attrition Outliers . . . 95
A.6 Charter School Grade-Spans . . . 97
A.7 Charter and Traditional Public School Location in North Carolina . . . 98
LIST OF TABLES
1.1 Traditional Public Schools, Charter Schools, and New Charter Schools by Year . . . 13
1.2 Charter School Grade Spans First Year Observed in the Data and Last Year Observed in the Data, 1998-2016 . . . 14
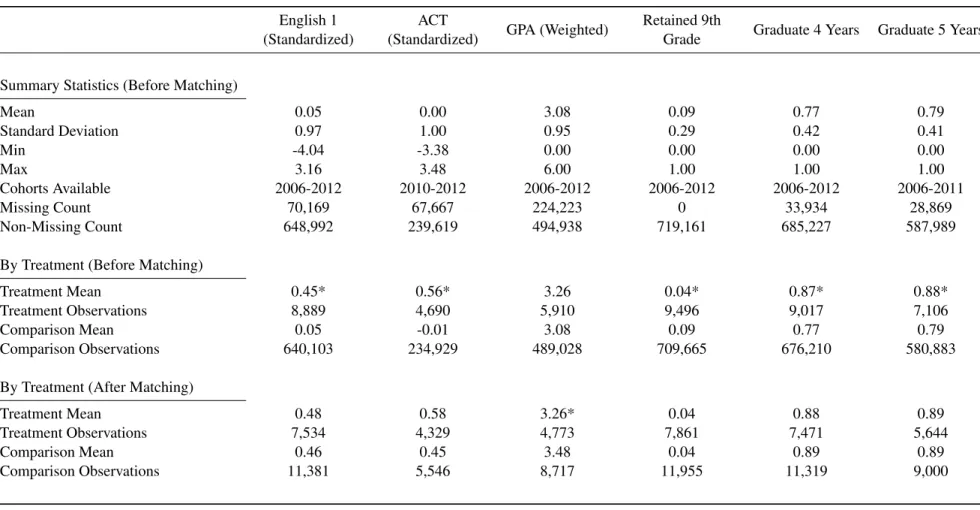
2.1 Descriptive Statistics for Dependent Variables . . . 31
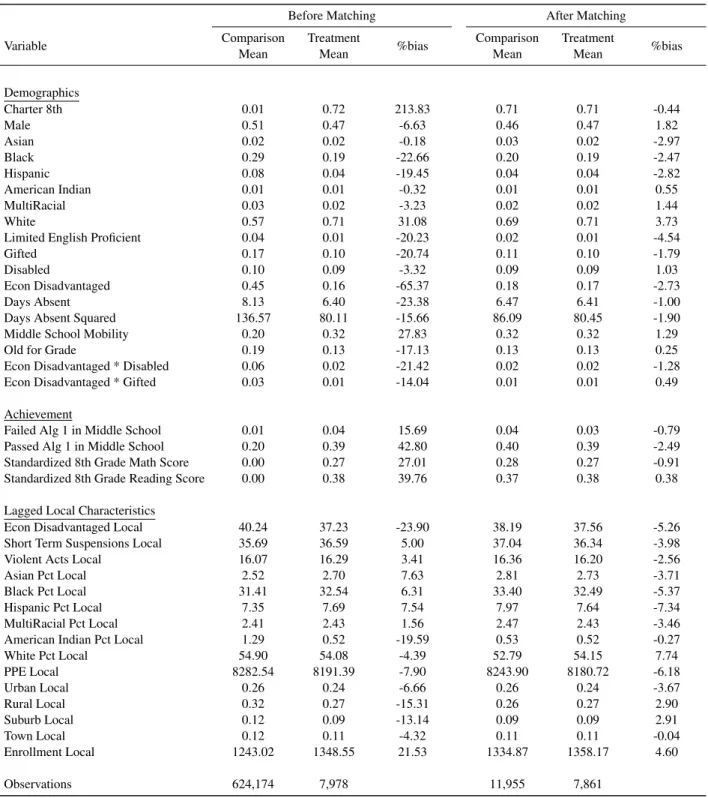
2.2 Descriptive Statistics for Treatment and Comparison Groups Before and After Matching . . . 32
2.3 Types of Student Moves Between 8th and 9th Grade . . . 33
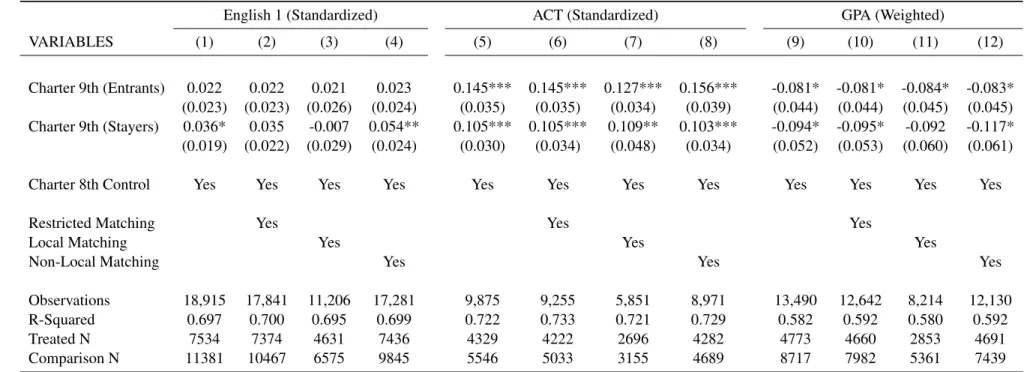
2.4 High School Achievement Outcomes . . . 34
2.5 High School Attainment Outcomes . . . 35
2.6 High School Achievement Outcomes - Robustness Checks . . . 36
2.7 High School Attainment Outcomes - Robustness Checks . . . 37
2.8 High School Achievement Outcomes - Student Ethnicity . . . 38
2.9 High School Attainment Outcomes - Student Ethnicity . . . 39
2.10 High School Achievement Outcomes - Heterogeneity Based on Various Student Characteristics . . . 40
2.11 High School Attainment Outcomes - Heterogeneity Based on Various Student Characteristics . . . 41
2.12 High School Achievement Outcomes - Heterogeneity Based on Various School Characteristics . . . 42
2.13 High School Attainment Outcomes - Heterogeneity Based on Various School Characteristics . . . 43
3.1 Competition Measure Definitions . . . 72
3.2 Summary of Distances between Traditional Public and Charter Schools by Urbanicity . . . 73
3.4 Count and Proportion of Traditional Public Schools Experiencing Attri-tion to Higher or Lower-Achieving Charter Schools for Period 1 and Pe-riod 2 in Math and Reading Conditional on Schools Experiencing Any
Attrition . . . 75
3.5 Control Variable Definitions . . . 76
3.6 First Differenced Regressions of Standardized Student Test Score Gains on Attrition Competition Measures Interacted with Relative Achievement
and Period for Years 1997-2016 without School Trends . . . 77
3.7 First Differenced Regressions of Standardized Student Test Score Gains on Attrition Competition Measures Interacted with Relative Achievement
for Years 1997-2016 without School Trends: Various Persistence Strategies . . . 78
3.8 First Differenced Regressions of Standardized Student Test Score Gains on Attrition Competition Measures Interacted with Relative Achievement
for Years 1997-2016: Math Robustness Checks . . . 79
3.9 First Differenced Regressions of Standardized Student Test Score Gains on Attrition Competition Measures Interacted with Relative Achievement
for Years 1997-2016: Reading Robustness Checks . . . 80
3.10 Fixed Effect Regressions of Standardized Student Test Score Gains on Attrition Competition Measures Interacted with Relative Achievement for
Years 1997-2016 without School Trends . . . 81
3.11 First Differenced Regressions of Standardized Student Test Score Gains on Distance Competition Measures Interacted with Relative Achievement
for Years 1997-2016 without School Trends . . . 82
3.12 First Differenced Instrumental Variable Regressions of Standardized Stu-dent Test Score Gains on Attrition Competition Measures Interacted with
Relative Achievement for Years 1997-2016 without School Trends . . . 83
3.13 First Differenced Regressions of Standardized Student Test Score Gains on Attrition Competition Measures Interacted with Relative Achievement and Demographic Measures for Years 1997-2016 without School Trends:
Heterogeneity by School Type . . . 84
3.14 First Differenced Regressions of Standardized Student Test Score Gains on Attrition Relative Achievement Competition Measures Interacted with Student Demographics for Years 1997-2016 without School Trends:
Het-erogeneity by Student Type . . . 85
3.15 School Fixed Effect Regressions of Various School Outcomes on Attrition Competition Measures Interacted with Relative Achievement for Years
A.1 First Differenced Regressions of Standardized Student Test Score Gains on Attrition Competition Measures Interacted with Relative Achievement
for Years 1997-2016 without School Trends: Split Competition Measures . . . 91
A.2 First Differenced Regressions of Standardized Student Test Score Gains on Attrition and Distance Competition Measures Interacted with Relative Achievement (Defined by Lagged School Achievement) for Years
1997-2016 without School Trends . . . 93
A.3 First Differenced Regressions of Standardized Student Test Score Gains on Attrition Competition Measures Interacted with Relative Achievement
for Years 1997-2016 without School Trends: Various Attrition Cut-Offs . . . 94
A.4 First Differenced Regressions of Standardized Student Test Score Gains on Attrition Competition Measures Interacted with Relative Achievement
for Years 1997-2016 without School Trends: No Outliers . . . 96
A.5 Count and Proportion of Charter Schools By Grade-Span When First and
LIST OF FIGURES
3.1 Relative Achievement Regression Coefficients by Persistence Parameter
Values for Math, 1997-2016 . . . 87
3.2 Relative Achievement Regression Coefficients by Persistence Parameter
Values for Reading, 1997-2016 . . . 88
A.1 School Level Histogram of Percent Attrition Conditional on Any Attrition . . . 95
A.2 Charter and Traditional Public School Location in North Carolina in 2016:
CHAPTER 1
INTRODUCTION TO CHARTER SCHOOLS AND THE RELEVANT LITERATURE
1.1 Introduction
Charter schools are schools of choice that are publicly funded, tuition free, and open to any student regardless of background. Although charter schools are public schools, they operate outside the normal bounds of the traditional public school sector with significant flexibility in the use of funds, hiring practices, and curriculum choice. Since the first charter school legislation was passed in Minnesota in 1991, more than 40 states have enacted charter school legislation by 2018 (Education Commission of the States), and over 5% of public school students in the United States attended a charter school as of fall 2014 (National Center for Education Statistics). Proponents of charter schools have argued two main claims. The first is that charter schools will have a direct and positive effect on their own student outcomes. This may be due to the increased flexibility and freedom to adjust learning environments as they see fit, or because competitive forces induce them to improve in order to attract students. The second claim is that charter schools will have a positive effect on nearby traditional public schools because charter schools introduce or add to existing competition between schools. On the other hand, opponents worry that increased flexibility and competitive forces will not drive charter schools or traditional public schools to improve. Additionally, there is concern that charter schools may negatively affect traditional public school students by draining resources and talent from traditional public schools.
Researchers have spent considerable time evaluating the effects of charter elementary and middle schools on their own students. Studies that focus on a subset of over-subscribed charter schools generally find large positive effects on students’ test scores while studies utilizing fixed effect or matching methods find that charter schools are similar to traditional public schools in terms of improving student achievement.1 In North Carolina, researchers find that in more recent years charter schools perform similarly to traditional public schools although, in earlier years, charter school effects were more negative (CREDO 2009, 2013b; Ladd et al. 2016).
While our knowledge of charter effects on test scores in elementary and middle school has grown substan-tially, less is known about the effects of charter high schools on longer term outcomes such as ACT scores,
retention, and high school graduation.2 There are at least two reasons for the more limited literature on charter high schools and longer term outcomes. The first concerns estimation. The most credible matching estimators require baseline measures of the outcome of interest. For test scores, this is often easy because end of grade test-ing is required in grades three through eight. With outcomes such as retention and graduation, there is no lagged measure available. Additionally, panel data methods are not an option because many high school outcomes are not observed repeatedly for the same student over time. Second, charter high schools are simply less common than charter elementary and middle schools and so received less attention. Although test scores are important in so far as they positively predict longer term student success, it remains important to assess charter effects on longer term outcomes, such as high school graduation, which is predictive of college attendance, employment, and wages.
Additionally, much less is known concerning the spillover effects of charter schools on traditional public school students. The current literature finds mixed results, although generally, even studies that find effects, find small effects (Betts 2009; Epple et al. 2015).3 Assessing spillover effects is important for two reasons.
First, whether or not the students left in traditional public schools are hurt or helped by charter schools is important in its own right because more and more students have been exposed to potential spillovers as the charter sector has grown. Second, credible estimates of the effects of charter schools on their own students require the assumption that charter schools do not have spillover effects on traditional public schools. For example, in matching approaches to evaluate the effect of charter schools on their own students, charter students are often matched to comparison students in nearby traditional public schools. If these traditional public school students are affected by charter schools, they are no longer valid comparison students for assessing causal effects.4 Therefore, it is important to assess whether charter schools have spillover effects on traditional public school students.
My dissertation addresses the limitations in the literature in two ways. First, using data covering all 9th grade public school students in North Carolina between 2006 and 2012, I examine charter high school effects of student outcomes including English 1 scores, ACT scores, final GPA, 9th grade retention, and four and five year high school graduation. I use a regression adjusted propensity score matching approach in which 9th grade charter school students are matched to comparison traditional public school students with similar 8th grade
2See Section 1.3.2 for a detailed discussion of this literature.
3
See Section 1.3.3 for a detailed discussion of this literature.
4
test scores and demographic characteristics. I find that charter high schools slightly increase English 1 scores, have moderate positive effects on ACT, and have small negative effects on GPA. I also allow effects to vary by whether a student was in a charter school in 8th grade and continued in a charter school in 9th grade (stayers) and whether a student was in a traditional public school in 8th grade and a charter in 9th grade (entrants). I find that charter school entrants are more likely than traditional public school students to be retained in 9th grade and less likely to graduate in four years. The negative effects on retention are driven by black students, and black charter entrants are significantly less likely to graduate than white charter entrants.
Second, using panel data covering all public school students in North Carolina from 1997 to 2016, I ex-amine the effect of charter schools on traditional public school student math and reading test scores in grades three through eight. I control for student and school fixed unobservable characteristics and find no overall effect from charter competition on traditional public school students. However, higher-achieving charter competi-tion has small positive effects and does not increase achievement gaps for disadvantaged or minority students. Lower-achieving charter competition has zero to small negative effects and increases achievement gaps for some disadvantaged and minority groups.
The results from my dissertation suggest three things. First, the finding of no overall competitive effect suggests that estimates of the effect of charter schools on their own students are not biased by spillovers. How-ever, the finding of heterogeneous competitive effects based on school and student characteristics suggests that subgroup analysis of charter school effects on their own students could be biased, although the competition es-timates are small which suggests the bias may be negligible.5 Second, the finding of no competitive effects on students left in traditional public schools and some positive effects from charter high schools suggests that the marginal expansion of charter schools in North Carolina does not hurt public school students, and may even be beneficial. Third, analysis by student and school characteristics demonstrates that average effects may mask im-portant heterogeneous effects. In particular, black charter entrants experience more negative effects from charter high schools than white charter entrants, and lower-achieving charter competition increases achievement gaps for some disadvantaged and minority groups. This may suggest that charter high schools should shift resources toward black charter entrants, and traditional public schools facing lower-achieving competition should shift resources to more disadvantaged and minority groups.
The rest of Chapter 1 proceeds as follows. Section 1.2 provides more detailed background information on
charter schools. Section 1.3 reviews the current literature concerning the effects of charter elementary and mid-dles schools on their own students, charter high school effects on their own students, and the spillover effects of charter schools on traditional public school students. I emphasize particular gaps in the literature in order to motivate my contributions, which are explained in the remaining chapters. Chapter 2 details my empirical ap-proach and results concerning the effects of charter high schools on charter student academic outcomes. Finally, Chapter 3 discusses estimation and effects of charter schools on traditional public school student achievement in North Carolina.
1.2 Background
Charter schools are operated by independent non-profit boards of directors and are freed from many of the regulations facing traditional public schools, but still must participate in the state accountability program. Charter schools do not have class size restrictions, curriculum requirements, and are not required to have all teachers licensed. Additionally, charter schools do not have to provide transportation and do not have to provide free and reduced price lunch to low income students. They have open enrollment policies, cannot charge tuition, and cannot be religiously affiliated. Oversubscribed schools must hold lotteries to randomly determine student entrants.
Funding policies vary by state, but in North Carolina charter schools receive state funding for each student that is equal to the per pupil allocation for average daily membership in the local education agency (LEA) in which the charter resides. Additional state funds are appropriated based on the number of students with disabilities and that are classified as limited English proficient. The LEA in which the charter student resides is required to transfer an amount equal to the per pupil local current expense appropriation fund of the LEA. In short, local and state funds follow the student so a local education agency that loses a student is also losing the funding that is attached to that student. Unlike traditional public schools, charter schools do not receive separate capital funding for school building construction or renovation.
Charter schools first opened in North Carolina in the 1997-1998 school year with the passage of the Charter School Act, and sole authority of charter school authorization was given to the State Board of Education.6 Originally, a 100 school cap was placed on the total number of charter schools allowed in operation, but that cap was lifted in 2011. This created a situation in which the majority of growth in the charter school sector occurred from 1998 to 2002 and from 2013 to 2016. The final column of Table 1.1 shows the growth of the charter sector over time. Of all charter school openings between 1998 and 2016, 53% occurred between 1998
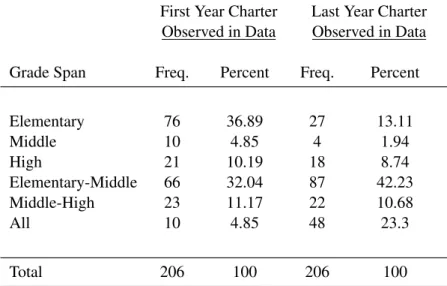
and 2002 and 33% between 2013 and 2016. In 1998, 34 charter schools were in operation comprising 1.7% of all public schools. By 2016, a total of 157 charter schools were in operation or about 6.1% of all public schools. In North Carolina, traditional public schools normally follow traditional elementary (grades K-5), middle (grades 6-8), and high school (grades 9-12) grade spans. Charter schools do not follow this traditional pattern and are more likely to expand grade levels as they age. Table 1.2 shows the distribution of charter school grade spans the first and last year they are observed between 1998 and 2016. In their first year, about 36% of charter schools serve only elementary school grades and about 32% serve both elementary and middle school grades. In their last year observed, only 13% serve only elementary grades, and over 75% span some combination of elementary, middle, and high school grades. Charter schools serving some high school grade levels are included in the charter high school analysis which, in their last year observed, includes about 33% of charter schools. The competitive effect analysis focuses on effects from charter schools serving elementary or middle school grade levels which, in their last year observed, includes about 80% of charter schools.
1.3 Literature Review
1.3.1 Charter Elementary and Middle School Effects on Charter Students
Studies evaluating the effects of charter elementary and middle schools on student achievement can broadly be categorized based on the empirical strategy they employ. The main concern in estimation is that charter school students choose to enroll in charter schools, and therefore may differ in unobservable ways from students that stay in traditional public schools. The first set of studies, with the strongest internal validity, exploits ran-dom variation created by oversubscribed charter schools. Over-subscribed charter schools must hold lotteries to randomly determine student entrants so lottery winners and lottery losers theoretically have similar unobserv-ables. However, charter school lottery information is not always available so a second group of studies controls for student selection into charter schools using student fixed effects. Fixed effect methods assume that student selection is not based on time-varying unobservables after controlling for fixed unobservable student character-istics and observable time-varying charactercharacter-istics. Finally, researchers are concerned with the external validity of lottery and fixed effect studies so several studies use matching or other non-fixed effect regression methods to evaluate charter school effects. These methods often control for baseline achievement measures and assume that matched comparison students with similar baseline characteristics to treatment students are also similar in unobservables.7
7
Lottery based strategies compare lottery winners to lottery losers to assess the effect of over-subscribed charter schools on their own students. This is termed the intent to treat effect because not all lottery winners choose to attend a charter school and some lottery losers still go to charter schools. An alternative treatment effect, and potentially one that is more policy relevant, is the treatment effect on the treated which is estimated using an instrumental variable strategy where attendance at a charter school is instrumented with the offer of admission.8 Several studies use lottery based strategies and generally find positive effects on student math and reading test scores (Hoxby and Rockoff 2004; Hoxby and Murarka 2009; Angrist et al. 2010; Dobbie and Fryer 2011; Abdulkadirolu et al. 2011; Tuttle et al. 2013, 2015). The exception is Gleason et al. (2010) which finds no effect on student achievement, but does find some positive effects for certain student subgroups.
Although lottery based studies have strong internal validity, they are identifying the effects of over-subscribed schools which may not be representative of all charter schools, and they are identifying the effects on students in over-subscribed charter schools who entered through a lottery. In practice, some students enter over-subscribed charter schools outside the lottery because of sibling preference or other factors.9 Additionally, many charter
schools are not over-subscribed, and, even if they are, their lottery records may not be reliable. Because of these limitations, several charter school studies utilize student fixed effect strategies.
Studies utilizing student fixed effects find less favorable results than lottery studies. Several studies find negative effects on both math and reading test scores (Bifulco and Ladd 2006; Sass 2006; Booker et al. 2007; Hanushek et al. 2007; Ni and Rorrer 2012; Ladd et al. 2016) while Zimmer et al. (2003) find negative effects on math test scores and no effect on reading test scores, and Witte et al. (2007) find positive effects.10 Several of these studies also find that charter school effects are more negative when charter schools first open or when students first enter a charter school, and then become similar to traditional public schools as the charter ages or the student has been in a charter longer. Two studies find no effect on achievement (Imberman 2011a; Nisar 2012). Finally, while most studies focus on a single state, district, or city, a handful of studies analyze several areas within the same analysis. Zimmer and Buddin (2006) find no effects in Los Angeles and small negative effects in San Diego. Zimmer et al. (2009) and Zimmer et al. (2012) find positive effects on math test scores in Texas, Denver, and Milwaukee. Otherwise they find null to negative effects on math or reading test scores in
8
The treatment effect on the treated is more relevant because the intent to treat effect includes students that may not have actually received treatment (attended a charter school).
9
See Zimmer and Engberg (2014) for a more detailed discussion.
Chicago, Denver, Milwaukee, Philadelphia, Ohio, San Diego, and Texas.
Fixed effect estimates are identified from students switching between charter and traditional public schools which raises concerns over external validity in so far as switchers are not representative of the entire charter stu-dent population. This may explain the divergent results between fixed effect and lottery based studies because each focuses on different subpopulations. Studies with the highest external validity rely on matching or regres-sion based approaches (controlling for baseline test scores) that neither restrict the sample to over-subscribed charter schools (lottery studies) or student switchers (fixed effect studies). Results from matching and non-fixed effect regression approaches show mixed results. Several studies find positive achievement effects (Woodworth et al. 2008; Tuttle et al. 2010; CREDO 2013a; Gleason et al. 2013; Baude et al. 2014), one finds null effects (Furgeson et al. 2012), and many find negative impacts (CREDO 2009; Berends et al. 2010; CREDO 2011). Chingos and West (2015) find negative effects on math test scores and no effect on reading test scores.
Perhaps the most comprehensive examination of charter schools was conducted by CREDO. They started by evaluating charter schools in 16 states (CREDO 2009), and then updated that paper by examining charter schools in 27 states (CREDO 2013b). Although effects earlier in time were generally negative in math and reading, the updated report reveals that charter schools are improving over time until they are outperforming traditional public schools in reading and performing similarly in math. Ladd et al. (2016) uses fixed effects and also evaluates differences in effects over time in North Carolina and finds that although charter schools do not outperform traditional public schools, their effects do become less negative over time.11
Given the discussion above, it would be informative to know whether lottery estimates, fixed effect estimates, and matching estimates are similar when estimated on the same samples. Fortunately, there are several studies that compare charter school lottery estimates to matching estimates (Abdulkadirolu et al. 2011; Tuttle et al. 2013; Dobbie and Fryer 2013; Fortson et al. 2015), and one study that compares matching estimates to fixed effect estimates (Davis and Raymond 2012). These studies conduct within-study comparisons in which two estimation methods are performed on the same sample. For example, matching estimates and lottery estimates are compared using the same sample of lottery students. These studies generally find qualitatively similar results between methods, although sometimes the magnitude of effects differs somewhat between methods. This bolsters the use of fixed effect and matching methods in the charter school literature.
1.3.2 Charter High School Effects on Charter Students
The literature examining charter high school effects uses several empirical strategies including random as-signment based on lottery information and observational methods. Oversubscribed charter schools must hold lotteries to randomly determine student offers of admission. Because the offer is random, comparing lottery win-ners and losers produces estimates with high internal validity. Abdulkadirolu et al. (2011) examine the effects of Boston charter high schools using student assignment lotteries and find large positive charter high school effects on test scores. Angrist et al. (2016) estimate the effects of Boston charter high schools that held lotteries on col-lege preparation and enrollment. They report higher pass rates on exit exams, increased SAT scores, and a shift in college enrollment from 2-year to 4-year institutions. Additionally, they find that charter schools substantially decrease the likelihood of graduating on time, but have no effect on 5-year high school graduation rates or on high school grade retention in 9th through 11th grade. Finally, Davis and Heller (2017) examine the effect of Noble Street Charter School in Chicago using randomized lottery information and find large positive effects on college enrollment and persistence.12 These studies provide an important proof of concept: that the no-excuses model in two metro areas in the U.S. can have some positive impacts for students - with the exception of effects on graduating within 4 years in Boston. However, the external validity of these studies is weak since they are concentrated in two regions and draw from only one type of many charter school educational approaches.
Abdulkadirolu et al. (2011) addresses some generalizability concerns by using OLS on lottery and non-lottery Boston charter schools controlling for baseline test scores and demographics. They find that, among lottery schools, the observational estimates are very similar to the lottery estimates. This suggests that observa-tional estimates are valid and can be extended to estimate impacts for non-lottery charter schools. They find that non-lottery charter school effects are about half the size of lottery charter effects, suggesting quite limited exter-nal validity of lottery estimates from the over-subscribed charters in their sample. Additioexter-nally, their validation of observational estimates against lottery estimates supports the empirical strategy I employ in Chapter 2 - at least in terms of test score outcomes. Because of concerns over external validity and the difficulty of obtaining lottery information, several studies use observational methods to identify the effects of charter high schools on student outcomes.
Several studies examining test score effects in elementary and middle school using student fixed effects, pre-viously discussed in Section 1.3.1, also examine test scores in high school. Zimmer et al. (2003) find secondary
12
charter schools do slightly better in reading and slightly worse in math, although the authors conclude charters are keeping pace with traditional public schools. Sass (2006) finds negative charter high school effects on math scores and no effect on reading with effects becoming more positive as charter schools age. Zimmer and Buddin (2006) group middle and high school together and find positive reading effects and negative math effects in San Diego and the reverse in Los Angeles. Ni and Rorrer (2012) find negative high school effects on language arts scores in the first year a charter opens, and no effect after the first year in Utah. The main concern with the fixed effect approaches are lack of generalizability because they rely on switchers. Finally, Chingos and West (2015) control for 8th grade test scores using OLS regression and find negative math effects and no effects on reading or writing in Arizona. Although these studies provide valuable information in assessing the effectiveness of charter high schools in raising test scores, they do not examine important longer term outcomes such as ACT scores, retention, or graduation.
Tuttle et al. (2015) use a matching design to examine the impacts of KIPP charter high schools on test scores and college readiness. They separately estimate effects for students entering a KIPP charter for the first time (entrants) and for those continuing from a KIPP middle school to a KIPP high school (stayers). For entrants, they report positive effects on achievement and graduation, although graduation effects are not statistically significant. KIPP high schools do not have positive effects on stayer achievement, but stayers are more likely to apply to college and more likely to take advanced courses than comparison students who did not have the option to attend a KIPP high school. Furgeson et al. (2012) use propensity score matching to form an appropriate comparison group to analyze the effects of charter high schools that were overseen by a Charter Management Organization. They find positive, statistically insignificant effects on graduation and college enrollment. Although the results concerning KIPP schools and charters under a management organization are informative, these studies lack generalizability.
public school students who, in some cases, may have chosen to exit the charter sector which is simply another form of selection. It is unclear that the sample restriction would increase internal validity, and it necessarily decreases external validity.
Overall, the literature suggests that charter high schools have some positive effects on high school test scores, graduation, and college enrollment. At the very least, they are doing no worse than traditional public schools with the exception of 4-year graduation in Boston and some small negative effects on test scores in Zimmer and Buddin (2006) and Chingos and West (2015). Generalizability is the main limitation of the current literature either because samples are restricted to specific geographic regions, particular types of charter schools, or particular types of charter school students. Additionally, many high school papers focus on test scores and do not extend the analysis to more important outcomes such as high school graduation. In Chapter 2, I address the generalizability concerns and examine longer term outcomes including ACT test scores, GPA, retention, and high school graduation.
1.3.3 Charter Elementary and Middle School Effects on Traditional Public School Students
In addition to concerns over student selection into schools, competitive effect studies are also concerned over charter school location. If charter schools were randomly assigned location this would not be a concern, but it is likely that charter schools strategically locate, and location may be correlated with unobservable factors affecting traditional public school student achievement. Broadly, the literature examining the competitive effects of charter schools has developed starting with school level analyses using various empirical strategies, then moving into student and school fixed effect approaches, and finally, several recent papers have shifted to other empirical methods.
mile radius of a traditional public school, and Ni controls for school specific unobserved linear trends. The main concern with school level analysis is that average school test scores may be masking student movement. For example a traditional public school may be feeding a nearby charter school below average students. Then in a school level analysis, it may appear that traditional public school students improved when in fact the pool of students changed.13
Later papers employ student level panel data to limit bias from compositional effects. Bifulco and Ladd (2006) examine the effects of charters on nearby traditional public school students using data from North Car-olina. They find no effect of charters on traditional public school student test scores using a restricted value added model of achievement where competition is measured as being near a charter or the number of nearby charters. In order to account for the endogeneity of charter school location, they use a student-school spell fixed effect which accounts for any time-invariant unobservables related to charter school location, student movement, and test score outcomes. Estimates will not be consistent if selection depends on time varying unobservables that are also related to achievement. Sass (2006) uses the same empirical strategy, but uses the enrollment share of charters as an additional measure of competition. Results from students in Florida indicate no effect on reading scores but a positive effect on math scores.
Booker et al. (2008) use a similar empirical model looking at students in Texas and find positive achievement effects. They make two notable contributions. The first is that they include both district and school level measures of competition because the district as a whole may respond to competitive pressure from charters. Second they look at heterogeneous effects based on race and traditional public school quality. Minority students and lower quality traditional public schools experience the largest positive effects. Zimmer and Buddin (2009) use California student level data and school principal survey results. A spell fixed effect regression of student achievement on varying measures of competition, including the number of nearby charters and enrollment share, finds no effects on student achievement. Survey results from traditional public school principals largely confirms this empirical finding.
Winters (2012) restricts attention to New York City and uses student attrition to charters as the measure of competition. Different combinations of school and student fixed effects reveal mixed results when examining student achievement. The majority of previous studies are confined to one or two states. In order to assess the generalizability of results, Zimmer et al. (2009) examine competitive effects in seven states. Only Texas reveals significant positive effects. The empirical approach of this branch of the literature has two main weaknesses.
First, the spell fixed effect method controls for selection on time-invariant factors, but not for the possibility that charter schools locate based on unobservable trends in traditional public school achievement. Second, the literature relies on an assumption that student achievement is perfectly persistent. If it is the case that there is decay in learning from year to year and lagged achievement is correlated with charter school location, then spell fixed effect estimates will be inconsistent.
Because of the limitations just mentioned, a few recent papers on this topic have shifted analysis away from the spell fixed effect approach. Imberman (2011b) examines competitive effects in a large urban district in the Southwest and employs a novel instrumental variable for being near a charter. The instruments are variations of the supply of buildings of appropriate size for a charter school. Charter schools do not generally receive funds for building schools and so rely on local buildings to rent. Results show a statistically significant drop in math and language test scores. Imberman extends the analysis to other outcomes including attendance and behavior, and finds significant positive effects in middle and high school. Mehta (2017) models competition to determine both direct and spillover effects of charter schools and finds small positive spillover effects in North Carolina.
Finally, Cremata and Raymond (2014) and Cordes (2018) allow competitive effects to vary by the achieve-ment of charter schools relative to the district. Using a difference-in-differences strategy, Cremata and Raymond (2014) find that being near charter schools with higher achievement positively affects student achievement in nearby traditional public schools. Using a lagged value added model with school fixed effects, Cordes (2018) finds no differential effect on math test scores, but a small positive effect on reading test scores from charter schools with higher achievement. These papers, however, measure a charter school’s achievement relative to the district rather than relative to the traditional public schools they define as competing with the charter school, which is arguably the more relevant comparison. Additionally, they lack generalizability because they are con-fined to two large urban districts.
Table 1.1: Traditional Public Schools, Charter Schools, and New Charter Schools by Year Year Traditional Public School Count Charter School Count Charter Schools % of All Public New Charter School Count Growth in Charter Schools
1995 1,952 0 0.0% 0
-1996 1,967 0 0.0% 0
-1997 1,989 0 0.0% 0
-1998 2,006 34 1.7% 34
-1999 2,028 59 2.8% 26 76.5%
2000 2,063 77 3.6% 23 39.0%
2001 2,096 90 4.1% 15 19.5%
2002 2,125 93 4.2% 8 8.9%
2003 2,145 93 4.2% 5 5.4%
2004 2,160 93 4.1% 2 2.2%
2005 2,178 97 4.3% 5 5.4%
2006 2,232 99 4.2% 2 2.1%
2007 2,288 93 3.9% 1 1.0%
2008 2,349 98 4.0% 7 7.5%
2009 2,380 97 3.9% 2 2.0%
2010 2,413 96 3.8% 0 0.0%
2011 2,424 99 3.9% 3 3.1%
2012 2,409 100 4.0% 1 1.0%
2013 2,414 108 4.3% 9 9.0%
2014 2,424 128 5.0% 22 20.4%
2015 2,431 149 5.8% 23 18.0%
2016 2,437 157 6.1% 12 8.1%
Table 1.2: Charter School Grade Spans First Year Observed in the Data and Last Year Observed in the Data, 1998-2016
First Year Charter Observed in Data
Last Year Charter Observed in Data
Grade Span Freq. Percent Freq. Percent
Elementary 76 36.89 27 13.11
Middle 10 4.85 4 1.94
High 21 10.19 18 8.74
Elementary-Middle 66 32.04 87 42.23
Middle-High 23 11.17 22 10.68
All 10 4.85 48 23.3
Total 206 100 206 100
CHAPTER 2
CHARTER SCHOOL IMPACTS ON HIGH SCHOOL ACADEMIC OUTCOMES IN NORTH CAROLINA (CO-AUTHORS SARAH CRITTENDEN FULLER, DOUG LAUEN, AND ANDREW
MCEACHIN)
2.1 Introduction
While we know quite a bit about charter school impacts on test scores for elementary and middle school grades, we know very little about charter school impacts in high school grades. This omission is notable given that about 500,000 students nationwide are enrolled in charter high schools (Snyder et al. 2016). Additionally, ACT test scores, high school graduation, and college attendance may be more predictive of later life success and so of more interest to policymakers and researchers. To date, there are only a small handful of studies of charter high school impacts on non-test score outcomes which generally report positive effects. Two of these are lottery-based studies reporting positive impacts of charters in two cities, Boston and Chicago, most of which subscribe to the so-called no excuses approach (Angrist et al. 2016; Davis and Heller 2017). The fact that these studies focus on one type of charter in two cities greatly limits the generalizability of inferences about charter high school impacts of the full range of charters or in different locales. Another study of KIPP, a charter school network that subscribes to the no excuses philosophy, finds positive high school charter effects as well (Tuttle et al. 2015). Another set of studies with superior external validity examine citywide effects in Chicago and statewide effects in Florida using observational data with probit estimation and matching analysis and generally find positive impacts (Booker et al. 2011; Sass et al. 2016). These studies, however, restrict the sample to students who were already in a charter school in 8th grade. This limits external validity with an uncertain payoff to internal validity.
heterogeneous impacts based on characteristics of the student (ethnicity, sex, limited English proficiency status, disability status) and of the school (grade structure, age, proportion white).
Specifically, using statewide administrative data, we conduct a propensity score analysis with 3:1 nearest neighbor matching with regression adjustment estimation to estimate impacts on six outcomes: English I end of course tests, ACT scores, weighted final GPA, retention in 9th grade, four-year high school graduation, and five-year high school graduation. We include cohorts that began ninth grade between 2004-05 and 2011-2012, inclusive. Our sample contains nearly 9,500 charter students, more than 700,000 potential comparison students, and around 12,000 matched comparison students. We attain excellent balance for our preferred specification on observable 8th grade matching covariates and match about 83% of the treatment group, depending on specifi-cation. We report four treatment-on-the-treated effects: 1) the effect of attending a charter school in 9th grade, 2) the effect of attending a charter in 9th grade conditional on attending a charter school in 8th grade, 3) the effect of entering a charter high school in 9th grade for students who were not observed in a charter school in 8th grade (effect on entrants), and 4) the effect of staying in the charter school sector for those already observed in a charter in 8th grade (effect on stayers).1
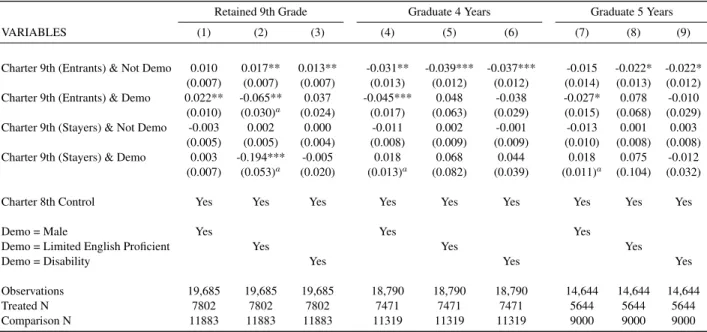
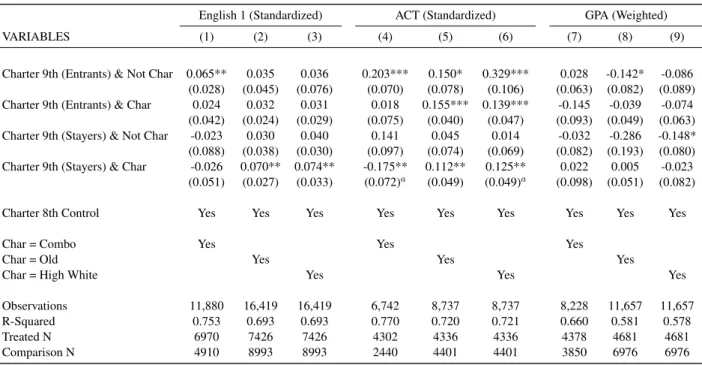
In brief, we find weak positive overall effects on English I end of course tests, stronger positive effects on ACT scores, and small negative effects on GPA. In English 1 and ACT, the charter school effect conditional on 8th grade treatment status (charter or not) is smaller in absolute value than the effect that does not condition on baseline charter enrollment. In addition, across all three achievement outcomes, the effects are symmetric between charter entrants and charter stayers. Across the attainment outcomes, we find a different pattern. We report retention rates, four-year graduation rates, and five-year graduation rates very close to zero in all specifi-cations. However, we find small differences between entrants and stayers, with entrants facing higher retention probabilities and lower graduation probabilities than stayers. Furthermore, the increased retention rate for char-ter entrants is largely driven by black students, and black charchar-ter entrants are significantly less likely to graduate in four or five years than white charter entrants. Students in older charter schools generally experience more positive effects across outcomes than students in younger charter schools. Finally, students in charter schools with above average proportions of white students are less likely to be retained and more likely to graduate than students in charter schools with below average proportions of white students.
2.2 Data
This study uses longitudinal administrative data provided by the North Carolina Department of Public In-struction (NCDPI). This data includes all students who attended North Carolina public schools, including charter schools, from 2004-05 to 2015-16. It allows us to follow individual students longitudinally as long as they re-main enrolled in NC public schools. At the student level this data set contains demographics, including gender, student ethnicity, an indicator for economic disadvantage, disability, giftedness, limited English proficiency, state standardized test scores, ACT scores, absences, graduation, GPA, and course taking information. At the school level, the data set includes percent economically disadvantaged, short terms suspension, violent acts, ethnic breakdown, per pupil expenditures, urbanicity, and total enrollment.
This study includes seven cohorts of students who began 9th grade for the first time during the 2005-06 to 2011-12 school years. Students are included in the cohort only if they appear in 8th grade and 9th grade in North Carolina public schools in consecutive years. Students are identified as treatment students if they attend a charter school anytime in 9th grade. Treatment students who subsequently exit the charter sector (sometime after 9th grade) are retained in the treatment group. The data set includes 9,496 treatment students enrolled in a charter school in 9th grade and 709,665 comparison students who enrolled in traditional public schools in 9th grade. Of these, 7,978 treatment students and 624,174 comparison students have non-missing information on all control variables and so are eligible to be in the matched sample.
2.2.1 Descriptive Statistics
grade. Graduation is coded as missing if a student leaves the state, dies, leaves for a private school, or leaves for home school. About 77% of students graduate within 4 years of their first year in high school, and a slightly higher percent, 79%, graduate within 5 years.
Before matching, treatment students have statistically significantly lower retention rates and higher English 1 test scores, ACT test scores, GPA, and graduation rates. It is unclear whether these differences are causal or reflect the selection of higher performing students into charter schools. In order to explore this further, we utilize baseline information from 8th grade or earlier. Student level controls are measured at baseline except for middle school mobility and passing or failing algebra 1 in middle school. Middle school mobility is an indicator that is one if a student ever switched schools while observed in grades six through eight. Algebra 1 is counted whenever a student first takes it in middle school, which could be before 8th grade. Control variables are divided into three groups listed below.
• Demographic Controls: male, limited English proficient, gifted, disabled, economically disadvantaged, days absent, days absent squared, middle school mobility, old for grade, interacted economically disad-vantaged with disabled, and interacted economically disaddisad-vantaged with gifted
• Achievement Controls: failed algebra 1 in middle school, passed algebra 1 in middle school, standardized 8th grade math test scores, and standardized 8th grade reading test scores2
• Lagged Local Characteristic Controls: economically disadvantaged, short terms suspension, violent acts, percent Asian, black, Hispanic, multi-racial, American Indian, white, per pupil expenditures, urbanicity, and enrollment
Old for grade is an indicator that is one of a student is strictly greatly than 15 years old by the 1st of September of his or her 8th grade year. Lagged local characteristics are the lagged average characteristics of the five nearest traditional public high schools within 15 miles of the high school a student is attending in 9th grade. For traditional public schools, this average includes the traditional public school itself, but charter schools are always excluded from the local average. Essentially, this requires that treatment students are matched to comparison students in high schools with similar local characteristics.
The first two columns of Table 2.2 display means of the control variables by treatment group, and suggest that students attending charter schools in 9th grade are different along several observable dimensions than traditional
2
public school students. For example treatment students are much more likely to have attended a charter school in 8th grade, are significantly more likely to be white, and have higher 8th grade math and reading test scores than comparison students. This suggests simply comparing mean outcomes is not causal, and more sophisticated econometric methods are needed.
2.3 Analysis
The main concern when estimating the effects of charter high school attendance on student outcomes is that students choose whether or not to attend a charter school, and the choice to attend may be based on unobservable student or family characteristics that are also correlated with student outcomes. For example, more motivated parents may be more likely to enroll their children in charter schools. Conversely, students performing poorly in charter schools may be more likely to exit to traditional public schools. Selection comes in two forms. First, students not enrolled in a charter school in 8th grade may select into a charter high school in 9th grade (entrants). Second, students already enrolled in a charter school in 8th grade may select out of the charter sector even though they can continue in the charter sector into 9th grade (leavers). The option to continue in the same charter school from 8th to 9th grade is prevalent in North Carolina because the majority of charter high schools are combination schools serving both middle and high school grade levels. Table 2.3 displays the frequency of different types of student moves between charter and traditional public schools between 8th and 9th grade. There are 6,663 9th grade charter students that were in a combination charter school in 8th grade or a charter school expanding to serve 9th grade (combo schools), which makes up about 65% of all 9th grade charter students. We denote students that stay within the charter sector between 8th and 9th grade “stayers” and those that enter the charter sector in 9th grade and were not in a charter in 8th grade “entrants”. In terms of Table 2.3, rows 5 and 7 are stayers and rows 2 and 3 are entrants which implies that 70% of 9th grade charter students are stayers and 30% are entrants.
In order to control for student selection, we utilize a two-step approach. First, we use propensity score matching to construct a comparison group of traditional public school students that are similar in baseline char-acteristics to charter school students. Second, we use weighted regression on this matched sample controlling for the same set of covariates used in the first step. Together, this provides a regression adjusted propensity score matching estimator that is more robust than matching or regression alone, which is discussed in more detail shortly.
More specifically, baseline is defined as 8th grade, and treatmentTiis defined as students that attend a charter
school at any point in 9th grade. LetYi(1)denote the potential outcome of studentihad he or she attended a
traditional public school in 9th grade (Ti = 0). We are interested in the average effect of attending a charter high
school for those that attended a charter high school, or in terms of our notation
∆tt=E[Yi(1)−Yi(0)|Ti = 1], (2.1)
which is termed the treatment on the treated. For an individual student, both potential outcomes cannot be observed, so we require the construction of an appropriate counterfactual. Because of the selection issues already noted, we cannot simply compare the difference in means between students who do and do not attend a charter high school in 9th grade. Rather, we assume conditional independence: conditional on observable characteristics Xi, the potential outcome under no treatmentYi(0)is independent of treatmentTi,
Yi(0)⊥Ti|Xi. (2.2)
In other words, once we match students on observable baseline characteristics, whether a student receives treat-ment or not is unrelated to the outcome a student would realize if not treated, and comparing the difference in means between the treated and matched comparison students is an unbiased estimate of the treatment on the treated.3 Instead of exact matching on observable characteristics, we follow the approach of Rosenbaum and Rubin (1983) and match on the probability of treatment (propensity score) to reduce dimensionality.4
In the first step, the probability of attending a charter school in 9th grade is modeled as
P rob(Ti = 1) =
eα0+Xiα1+γc
1 +eα0+Xiα1+γc, (2.3)
whereTiis the treatment status of studenti,Xiis a vector of control variables, andγcis cohort fixed effects. The
propensity models are estimated using logistic regression. The control vector consists of three main sets of vari-ables: demographic controls, achievement controls, and lagged local characteristics. After propensity scores are estimated, treatment students are matched to up to 3 students with nearest propensity scores (nearest neighbors).5
3
It is not necessary to assume independence fromYi(1)because we are interested in the treatment effect on the treated (Imbens
2004).
4Because we do not exact match on covariates (we match on similar propensity scores within a pre-specified range), covariates will differ between matched treatment and comparison students. This may introduce some bias, but the estimator is consistent because we are matching on only one continuous variable - the propensity score (Imbens 2004; Abadie and Imbens 2006; Imbens and Wooldridge 2009).
5
Matching is with replacement, so the same comparison student can be matched to multiple treatment students. Matches are restricted to be within 0.01 units of the treated propensity score to ensure match quality. A student is not allowed to be matched to students in different cohorts (exact matching on cohort). Treatment students with propensity scores more than a 0.01 unit difference from any potential comparison students are unmatched and omitted from the analysis. After matching, the treatment and comparison group observable characteristics are compared to assess balance.
In the second step, treatment effect estimation is carried out on the matched sample using OLS or Logit estimation using the following regression model:
Yi =β0+β1Ti+Xiβ2+λc+i, (2.4)
whereYi is outcome for studenti,Tiis an indicator for attending a charter school in 9th grade,Xiis the same
vector of covariates used in the propensity score model,λc are cohort fixed effects, andi is an idiosyncratic
error. The model includes the same set of covariates used in the matching process in order to control for any remaining differences between the treatment and comparison groups and to increase precision. Standard errors are clustered at the high school level. OLS regression is used for continuous outcomes: standardized English 1 scores, standardized ACT scores, and weighted GPA. Logistic regression is used for dichotomous outcomes: retained in 9th grade, graduated in 4 years, and graduated in 5 years.
The regression is weighted because in the matching process some comparison students are matched to mul-tiple treatment students and some treatment students match to less than three nearest neighbors. Treatment students always receive a weight of one. Comparison students are re-weighted so that the sum of comparison weights is equal to the number of matched treatment students. For example, if no comparison student was matched more than once and each treatment student was matched to exactly three comparison students, each matched comparison student would be weighted one-third, and the matched comparison weights would sum to the total number of matched treatment students. If one of the comparison students was matched to two treatment students, that student’s weight would be adjusted to two-thirds.
With the addition of the second estimation step in equation 2.4, the coefficient,β2, is a two-step estimator,
(Imbens 2004). Additionally, this estimator is robust to misspecification of the regression function in the second step (Abadie and Imbens 2011).
2.3.1 Charter 8th Grade Control
Propensity score matching provides strong protection against selection bias in so far as selection into or out of charter schools is uncorrelated with unobservable characteristics conditional on observable baseline char-acteristics. Charter high schools present a unique context because students may have already selected into a charter school before high school. Some prior studies restrict analysis to students that attended a charter school in 8th grade with the idea that unobservable characteristics predicting selection into a middle school charter also predict selection into a high school charter (Booker et al. 2011; Sass et al. 2016). They argue that this restriction limits selection bias at the cost of some external validity.
While it is important to control for 8th grade charter status, either because it controls for selection or because it captures lagged effects from prior charter attendance, we pursue a different approach in this paper. We contend that a sample restricted to only students observed in 8th grade in charter schools limits external validity with uncertain benefits to internal validity. If we restrict the sample to students who attended a charter in 8th grade, students who chose to stay in a charter will be compared to students who chose to exit. The validity of this comparison rests on the assumption that selection out of a charter school is independent of any unobservable shocks. In other words, we are assuming that selection out of treatment is controlled. Conversely, if we restrict the sample to students who did not attend a charter in 8th grade, students who chose to enter a charter will be compared to those that did not. In other words, we are assuming that selection into treatment is controlled. It is unclear whether matching methods would control for selection out of treatment while not controlling for selection into treatment, so we include estimates for both sets of students.
In practice, we specify a model that both matches and controls for 8th grade charter school status (CH 8th) and separately identifies the effect of charter attendance for 9th grade charter students that did not attend a charter in 8th grade (Entrant) and those that are continuing in a charter from 8th grade (Stayer). After matching, we fit an outcome model with indicator variables for these two types of students:
Yi =δ0+δ1Entrant+δ2Stayer+δ3CH 8th+Xiβ2+CH 8th×Xiβ3+λc+CH 8th×λc+i. (2.5)
grade traditional public school students that were in a charter in 8th grade (leavers). In estimation, all covariates and cohort fixed effects are interacted with the indicator for being in a charter school in 8th grade. This implies thatδ2can be interpreted as if we had restricted the sample to students in a charter school in 8th grade, and can
be compared to charter school impacts from prior studies that utilize this restriction (Booker et al. 2011; Sass et al. 2016).
2.3.2 Robustness Checks
The primary threat to identification is that unobservable student characteristics are correlated with a student’s decision to enroll in a charter high school and are correlated with high school outcomes. Fortunately, there are several potential robustness checks available to assess the extent of this potential source of bias.
Restricted Matching Estimators
The majority of charter high school students were also in a charter school in 8th grade so we are particularly concerned that students who choose to leave their charter school between 8th and 9th grade when they could have continued (leavers) are systematically different from those that choose to stay (stayers). As a check, we restrict the potential match comparison group for students in charter schools in 9th grade to students in traditional public schools in 9th grade that did not choose to exit a charter school when they could have continued in that charter school. In terms of Table 2.3, the excluded students comprise row six, and are charter leavers. For example, students in a charter middle school that does not serve high school grades who move to a traditional public school for 9th grade are potential matches. Students in combination charter schools serving middle and high school grades who left their charter school in 9th grade are not available to match. If students that choose to exit the charter sector are systematically different from those that stay, we expect the restricted matching estimates to differ from the baseline matching estimates. Our restricted matching estimator is similar to the strategy in Tuttle et al. (2015). They compare KIPP high school students who were in a KIPP middle school to other KIPP middle school students who did not have the option to attend a KIPP high school.
Local Matching Estimators
than the treatment group, we expect the local-matching estimates to differ from baseline. However, local match-ing may increase the likelihood that charter stayers are matched to charter leavers which is precisely what the restricted matching estimator in the previous section tries to avoid. Because of this, it is not clear whether diver-gent results from local matching are due to unobservable local characteristics or bias from matching to leavers who are systematically different from stayers.
Non-Local Matching Estimators
We also conduct non-local matching such that charter students in 9th grade can only be matched to students in traditional public schools that are not one of the five closest schools to the charter school or that are not within 15 miles of a charter school. Students in traditional public schools farther from charter schools may not have the option to attend, but still possess unobservable characteristics driving selection into charter schools and so be superior matches than local students that choose not to enter a charter high school or choose to exit their charter school. If students in local areas with charter schools that choose not to attend a charter high school are different in unobserved ways, we expect non-local matching estimates to differ from the baseline matching estimates. This is slightly different from the restricted matching estimator because the restricted estimator only restricts the potential matches for stayers (they can not be matched to leavers), while the non-local matching estimator also restricts the potential matches for entrants.
2.3.3 Heterogeneity by Student Characteristics
Often charter schools target certain student populations or specialize so it is possible that charter school effects vary by student characteristics. We explore heterogeneity based on student ethnicity, sex, limited English proficiency status, and disability status.
2.3.4 Heterogeneity by School Characteristics
We explore how treatment effects vary based on school characteristics along several dimensions. First, charter schools are more likely than traditional public schools to serve both middle and high school grade levels. About 87% of 9th grade charter school students are in combination schools compared to only 3% of traditional public school students. It is possible that these combination high schools are better for student outcomes because of the school structure. In order to explore this possibility, treatment is interacted with a dummy variable for whether a school is a combination high school or not, and the indicator is also included as a main effect. By including the combination indicator and the interaction, we are comparing charter school students in combination schools to traditional public school students in combination schools.
in the regressions. On average charter schools in North Carolina are younger than traditional public schools, so it is important to rule out the possibility that charter school effects are biased by the age of the school. In our sample, about 9% of 9th grade charter students are in schools strictly less than 8 years old, and about 7% of 9th grade traditional public school students are in school less than 8 years old. Finally, an indicator is constructed for whether a school has a higher proportion of white students than average which serves as a proxy for socio-economic status. This indicator variable and its interaction with treatment are included in regressions to assess whether charter school effects vary based on the demographic make-up of the school.
2.4 Results
2.4.1 Balance
Table 2.2 shows descriptive statistics for demographics, pre-treatment achievement, and lagged local charac-teristics for students who attended 9th grade at a charter school and those who attended 9th grade at a traditional public school. The left panel shows the means and balance test for the entire sample before matching. The balance test is the normalized difference
∆tc= 100× ¯
Xt−X¯c
q
s2
t+s2c 2
. (2.6)
The difference in treatment and comparison means (X¯t−X¯c) is standardized by the square-root of the average of
the sample variances in the treatment and comparison groups.6 Before matching, nearly all of the demographics and all of the pre-treatment achievement variables have a percent bias that is above the rule of thumb threshold of 10, indicating that the two groups are unbalanced. In particular, students who attend charter schools in 9th grade have higher 8th grade performance and are much more likely to have attended a charter school in 8th grade (72 percent of treatment students compared to just 1 percent of comparison students). The right panel of Table 2.2 shows the same means and balance test for the matched sample of students. An examination of this data reveals that all variables are well below the 10 percent bias threshold indicating that balance is achieved on all variables.
2.4.2 Main Results
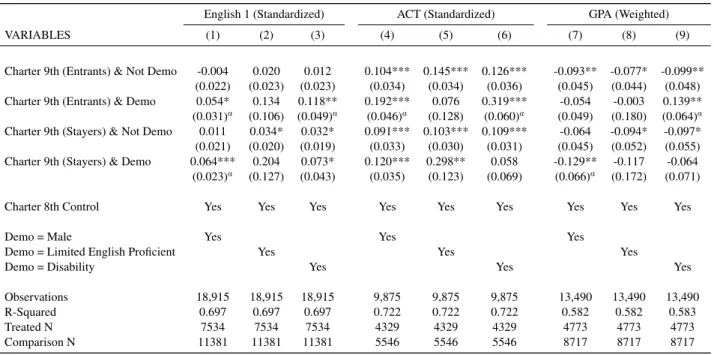
Throughout the results section, tables are divided into achievement outcomes (test scores and GPA) and attainment outcomes (retention and graduation). Table 2.4 displays the results of the propensity score matching
6
analysis on the English 1 End of Course test score, the ACT composite score, and weighted final GPA. The first model for each outcome shows the coefficient on the 9th grade charter indicator with no control for whether the student attended a charter school in 8th grade. The second column shows the same 9th grade charter effect with an 8th grade charter attendance control included in the set of covariates. The third column for each outcome separates the treatment variable between 9th grade charter attendees who also attended a charter in 8th grade -stayers - and 9th grade charter attendees who did not attend a charter in 8th grade - entrants. The coefficient for stayers compares charter sector stayers to students who attended a charter in 8th and then a traditional public school in 9th. The coefficient for entrants compares charter student entrants to students who attended a traditional public school in both 8th and 9th grade.
The left most outcome panel displays the effect of charter attendance in 9th grade on English 1 test scores. The first column shows a moderate positive impact of charter attendance of 0.11 standard deviations. Including the 8th grade charter control in the second model reduces the size of the effect by about two thirds, but the effect remains positive and statistically significant. When the effect is considered separately for charter entrants and charter stayers, the coefficients are both positive, but only the coefficient for stayers is statistically significant. Significant differences between stayers and entrants are marked with the letterain the tables. The effect for entrants and the effect for stayers are not statistically different from one another. In the middle outcome panel, which shows the impact of 9th grade charter enrollment on ACT scores, coefficients are large and positive in all three models, although they are largest in the model that does not include a control for 8th grade charter attendance. There is no statistically significant difference between entrants and stayers for ACT scores. Turning to GPA in the third outcome panel, there is no effect in the first model, but once the control for 8th grade charter attendance is added in the second model, there is a statistically significant negative effect on GPA. When the treatment group is split between entrants and stayers, there is no statistically significant difference in the impact between treatment groups, and across all models the effect is quite small - less than a tenth of a quality point.