Remediation of Dense Nonaqueous Phase Liquids
from Contaminated Subsurface Systems Using a
Class of Brine-Based Remediation Technologies
Deona Johnson Wright
A dissertation submitted to the faculty of the University of North Carolina at Chapel Hill in partial fulfillment of the requirements for the degree of Doctor of Philosophy in the Department of Environmental Sciences and Engineering.
Chapel Hill 2010
Approved by:
Cass T. Miller, Advisor
Gaylen Brubaker, Reader
Francis DiGiano, Reader
William G. Gray, Reader
Richard McLaughlin, Reader
c
2010
ABSTRACT
DEONA JOHNSON WRIGHT: Remediation of Dense Nonaqueous Phase Liquids from Contaminated Subsurface Systems Using a Class of
Brine-Based Remediation Technologies. (Under the direction of Cass T. Miller)
Concerted efforts to remediate subsurface systems contaminated with dense non-aqueous phase liquids (DNAPLs) have achieved limited success when measured by com-paring solute concentrations to drinking water quality standards. A novel treatment technology using a class of brine barrier remediation technologies (BBRTs) based on surfactant- and gravity-induced mobilization, dense brine containment and collection, and a vapor-phase extraction polishing step is utilized to remediate such systems. A series of investigations were conducted using one- and three-dimensional laboratory ex-periments, a field-scale experiment, and modeling to investigate the impact of BBRTs, the effectiveness of source-zone remediation, and to investigate the establishment, per-sistence, and rate of removal of a brine layer in a controlled system.
Laboratory and field-scale experiments are performed using the suggested method-ology. It is shown that under certain conditions, less than 1% of the original DNAPL mass remained in the laboratory system. DNAPL mobilization and recovery in the field-scale experiment was relatively ineffective due in part to the low saturation levels of the DNAPL. The results show that essentially complete removal of a DNAPL is required to reach typical cleanup standards and that details of the morphology and topology of a DNAPL distribution, in addition to the saturation, play an important role in determining the rate of mass transfer.
ACKNOWLEDGEMENTS
First, I would like to acknowledge the unrelenting efforts put forth by my advi-sor, Cass T. Miller, from the start of my graduate career. In additional, I gratefully acknowledge my committee members, Gaylen Brubaker, Francis DiGiano, William G. Gray, Richard McLaughlin, and Philip Singer, who have dedicated their time and effort. This work was supported by National Institute of Environmental Health Sciences Grant P42 ES05948, National Science Foundation Grant EAR-0440211, AECOM, and the Dead Sea Bromine Group. The Dover National Environmental Technology Test Site is established and managed by the Strategic Environmental Research and Devel-opment Program. The demonstration complied with prescribed NETTS protocols and guidelines for quality assurance, health and safety, technical completeness, and regula-tory compliance. The support of the NETTS facilities and test location manager and staff are gratefully acknowledged.
I gratefully acknowledge the contributions of Joseph Pedit, Matthew Farthing, Huina Li, Pamela Birak, Sarah Gasda, Laura Murphy, Louis Ball, Randall Good-man, William G. Gray, Chad Roper, and Patrick Sanderson from the University of North Carolina at Chapel Hill; Timothy McHale, Lee Mitchell, Dale Williams, and Rob Young from the Dover National Test Site (DNTS); Gaylen Brubaker, Jim Hicks, Randy Kabrick, Stephanie Knight, Dottie Schmitt, Teresa Watson, and Jon Williams from The RETEC Group; Mira Freiberg and Shmuel Ukeles from the Dead Sea Bromine Group; and Bill Taff from Synergy Fluids.
Last but most certainly not least I gratefully thank my family who have pushed and supported me throughout this process including my loving husband, parents, grand-parents and numerous aunts and uncles.
TABLE OF CONTENTS
LIST OF TABLES . . . ix
LIST OF FIGURES . . . x
LIST OF ABBREVIATIONS AND SYMBOLS . . . xii
1 Introduction . . . 1
1.1 Remedial Efforts . . . 2
1.2 Research Objectives . . . 4
1.3 Organization . . . 4
2 Efficient, Near-Complete Removal of DNAPL from Three-Dimensional, Heterogeneous Porous Media Using a Novel Combination of Treat-ment Strategies . . . 6
2.1 Introduction . . . 6
2.2 Approach . . . 8
2.2.1 Conceptual Model . . . 8
2.2.2 Materials . . . 9
2.2.3 Three-Dimensional Experiments . . . 11
2.2.4 Analytical Methods . . . 14
2.2.5 Visualization Methods . . . 15
2.3 Results . . . 15
2.4 Discussion . . . 19
2.5 Supporting Information Available . . . 22
3 Effectiveness of Source-Zone Remediation of DNAPL-Contaminated Subsurface Systems . . . 23
3.1 Introduction . . . 23
3.3 Approach . . . 30
3.3.1 Methods . . . 30
3.4 Results . . . 37
3.4.1 One-Dimensional Column Experiment . . . 37
3.4.2 Pilot-Scale Experiment . . . 38
3.4.3 Three-Dimensional Laboratory Experiment . . . 41
3.5 Discussion . . . 43
3.6 Conclusions . . . 48
4 Dense, Viscous Brine Behavior in Heterogeneous Porous Medium Sys-tems . . . 50
4.1 Introduction . . . 50
4.2 Background . . . 52
4.2.1 Overview . . . 52
4.2.2 Equations of State . . . 52
4.2.3 Density Effects . . . 53
4.2.4 Viscous Effects . . . 54
4.2.5 Porous Medium Property Effects . . . 55
4.2.6 Model Formulation . . . 55
4.2.7 Simulators . . . 56
4.3 Approach . . . 58
4.3.1 Overview . . . 58
4.3.2 CaBr2 Equations of State . . . 58
4.3.3 Laboratory Cell Experiments . . . 59
4.3.4 Field Experiment . . . 61
4.3.5 Modeling Approach . . . 66
4.4 Results . . . 69
4.4.1 Equations of State . . . 69
4.4.3 Field Study . . . 75
4.5 Discussion . . . 81
4.6 Conclusions . . . 84
5 Conclusions . . . 86
LIST OF TABLES
2.1 Porous media properties for TCE laboratory cells. . . 11
2.2 Physical properties of the fluids for TCE laboratory cells. . . 11
2.3 Summary of Experimental Results for TCE Recovery. . . 13
3.1 Porous media properties for flux experiments. . . 35
4.1 Porous medium properties of laboratory cell for brine analysis. . . 59
4.2 Summary of laboratory experiments during brine barrier establishment and maintenance. . . 62
4.3 Summary of DNTS study during implementation of a BBRTs. . . 65
4.4 SUTRA model parameters for brine simulations of laboratory and field experiments. . . 67
4.5 Dispersivity coefficients for laboratory experiment simulations. . . 68
LIST OF FIGURES
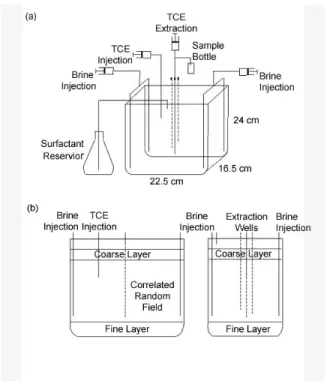
2.1 Three-dimensional experimental apparatus; (a) Cell schematic for surfac-tant flushing and TCE extraction and (b) layout of front and side of glass cell. . . 10
2.2 Photos depicting Experiment #2: (a) the initial saturated conditions, (b) completion of TCE injection, (c) establishment of a brine barrier at the bottom of the cell, (d) midway through the surfactant flush, (e) the cell prior to dewatering, and (f) the dewatered cell. . . 16
2.3 Cumulative TCE recovery from extraction well(s) . . . 17
2.4 Approximate TCE profile at the end of experiments based on porous me-dia extractions. . . 19
3.1 Dover Test Cell 3 layout. . . 33
3.2 Three dimensional laboratory tank for source-zone mass flux analysis. . . 36
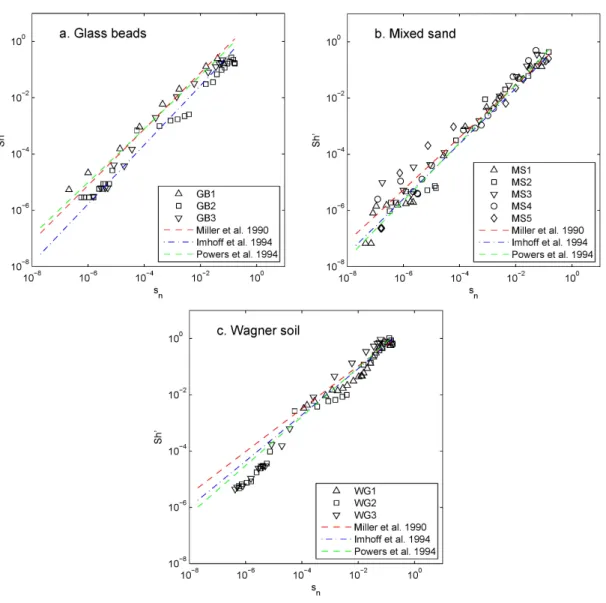
3.3 Comparison of experimental Sh0 and predicted Sh0 versus sn for
one-dimensional column experiments. . . 39
3.4 DNALP concentration as a function of length and sn using a Darcy
ve-locity of 1 m/s. . . 40
3.5 PCE concentration as a function of depth bgs in the DNTS test cell. The average relative concentration was 18 at 39.5 feet for the 3-month post-flush measurements. This high value occurred because DNAPL was present in one or more of the samples that made up the average. . . 41
3.6 Model fit for three-dimensional mass flux tank experiment. . . 43
3.7 Concentration as a function of DNAPLsnfor three-dimensional mass flux
tank experiment. . . 44
4.1 Top and side view layout of brine injection and extraction ports for the three-dimensional laboratory cell. . . 61
4.2 Dover Test Cell 3 layout during brine injections. . . 63
4.3 Geometry of the confining clay layer beneath Test Cell 3 and line sources for brine injection, where red locations represent Phase 1 and yellow lo-cations Phase 2 injections. . . 64
4.4 Density (left) and viscosity (right) of CaBr2 as a function of mass fraction. 70
4.5 Density as a function of elevation during the establishment of the brine barrier for the QS laboratory experiment. . . 71
4.7 Density as a function of elevation during the recovery of the brine barrier for the QS laboratory experiment. . . 73
4.8 Effluent TDS concentration during CaBr2 removal from the laboratory
experiments, where ◦represents the QS medium and represents the DS medium. . . 74
4.9 Experimental and simulated fraction of CaBr2remaining in the laboratory
experiment with quartz sand medium. . . 75
4.10 In situ densities after Phase 1 and Phase 2 brine additions for the pilot-scale study. The depth of extraction is indicated on the plot as a solid horizontal line. The densities of PCE and TCE are provided as a point of reference. . . 76
4.11 Average density as a function of depth during implementation of the BBRTs remediation strategy in the pilot-scale study. The solid horizontal line represents the BBI. . . 77
4.12 Density as a function of depth at the end of the primary pilot-scale study and three months post-study. . . 78
4.13 Effluent density in the pilot-scale study as a function of effluent volume during (1) brine injection, (2) flushing solution addition, (3) dewatering, (4) bulk brine removal, and (5) brine barrier flushing. . . 79
4.14 The volume of effluent from the pilot-scale study exceeding a minimum mass fraction (ωmin). . . 80
LIST OF ABBREVIATIONS AND SYMBOLS
◦C degrees Celsius
α fitting parameter
αl longitudinal dispersivity
αt transverse dispersivity
αV G van Genuchten model parameter
β fitting parameter
γ density fitting parameter
γx horizontal correlation length scale
γy vertical correlation length scale
θ volumetric fraction of the aqueous phase
µ viscosity
φ porosity
ρ density
ρ0 reference density
ω mass fraction
ωmin minimum mass fraction
A viscosity fitting parameter
Aerosol AY sodium diamyl sulfosuccinate
Aerosol OT sodium dioctyl sulfosuccinate
A.F.S American Foundry Society ana specific interfacial area
B viscosity fitting parameter
B1-B6 brine ports
BBI brine barrier interface
BBRTs brine-based remediation technologies
Caq aqueous phase concentration
CaBr2 calcium bromide
cm centimeters
cm3 cubic centimeters
CO2 carbon dioxide
cP centipoise
Cs aqueous phase solubility
d50 mean grain diameter
d60/d10 uniformity coefficient
DDI distilled, deionized
Dh hydrodynamic dispersion coefficient
Dm effective molecular diffusion coefficient
DNAPL dense nonaqueous phase liquid
DNTS Dover National Test Site
DS Dover sand
E1-E4 extraction ports
EPA Environmental Protection Agency Ev volumetric extraction rate
Em mass extraction rate
F1-F3 permeability simulations
g grams
GB glass beads
H2O water
HPLC high performance liquid chromatography
K0 fitting parameter
kg kilograms
kl mass transfer rate coefficient
Kl mass transfer coefficient
L liters
L1-L4 lower brine ports
ln natural log
m meters
M DNAPL mass
m2 square meters
M0 initial DNAPL mass
MCLs maximum contaminant levels
min minute
ml milliliter
MLS multi-level samplers
mm millimeters
mPa millipascals
MS mixed sand
N Newtons
nV G van Genuchten model parameter
NAPL nonaqueous phase liquid
ORO Oil-Red-O
PCE tetrachloroethylene
PV pore volume
q Darcy velocity
QS quartz sand
s seconds
SGSIM sequential Gaussian simulation
Sh Sherwood number
Sh0 modified Sherwood number
sn NAPL saturation
SRF spatial random field
t time
T1-T3 dispersivity simulations
TCE trichloroethylene
TDS total dissolved solids
U.S. United States
Chapter 1
Introduction
Groundwater is a vital water resource supplying 51% of the United States pop-ulation’s and 99% of the rural poppop-ulation’s potable water supply. It serves 30% of industrial water needs and half of agricultural irrigation water needs (USEPA, 1990). However, the widespread production, transportation, utilization, and disposal of haz-ardous chemicals have created numerous sites of subsurface contamination jeopardizing groundwater supplies (Cohen and Mercer, 1993). Overuse and application of pesticides and fertilizers has led to penetration of these substances into the subsurface and con-taminant infiltration of groundwater supplies (USEPA, 1993a, 1999). Spills and im-proper disposal of chemicals have resulted in leaks and seepage of hazardous chemicals into the subsurface at industrial sites (USEPA, 1999). Poor construction of landfills and sewer systems have further attributed to chemical and biological contamination of groundwater (USEPA, 1999).
Over 70,000 hazardous waste sites have been discovered in the United States. Of these sites, more than 1,500 have been identified and placed on the National Priority List, which consists of the nation’s most serious sites of subsurface contamination (Ka-vanaugh et al., 2003; USEPA, 2004) and are referred to as Superfund sites. The most prevalent class of contaminants at these sites involves dense nonaqueous phase liquids (DNAPLs), such as chlorinated solvents (Cohen and Mercer, 1993; Fountain, 1998; NRC, 1994; Palmer and Fish, 1992; USEPA, 1993a). These DNAPLs penetrate the unsaturated zone and continue to migrate downward due to gravitational forces. They infiltrate the saturated zone by overcoming buoyancy forces and continue to migrate downward until an impermeable layer is reached, or the contaminant mass is distributed throughout the system due to trapping by capillary forces (Mercer and Cohen, 1990).
and it is estimated that a similar amount more will be spent in the future (NRC, 1994, 1999). The remediation of sites contaminated with DNAPLs has proven to be an es-pecially difficult problem due to the multiphase nature of these systems (Mercer and Cohen, 1990; Pankow and Cherry, 1996; Villaume, 1985), the heterogeneity of sub-surface environments (Brusseau et al., 2000; Dekker and Abriola, 2000; Illangasekare et al., 1995a,b; Imhoff et al., 1995; Mayer and Miller, 1992a; Mercer and Cohen, 1990; Pankow and Cherry, 1996; Saenton et al., 2002; Schnarr et al., 1998; Waduge et al., 2004), the sensitivity of flow patterns to medium properties (Fu and Imhoff, 2002; Held and Illangasekare, 1995; Illangasekare et al., 1995a,b; Imhoff et al., 2003, 1995; Imhoff and Miller, 1996; Imhoff et al., 1996; Kueper and Frind, 1988; Kueper and Gerhard, 1995; Morrow and Songkran, 1981; Saenton et al., 2002; Zhang and Smith, 2001), the relatively slow rate of mass transfer of contaminants from entrapped DNAPLs to the gas and aqueous phases that naturally occur in subsurface environments (Geller and Hunt, 1993; Hunt et al., 1988a,b; Imhoff and Miller, 1999; Mayer and Miller, 1996; Miller et al., 1990; Pankow and Cherry, 1996; Powers et al., 1992; Roy et al., 1995), un-controlled mobilization of DNAPLs that can contaminate previously uncontaminated areas (Kaslusky and Udell, 2002; Pennell et al., 1996; She and Sleep, 1999; Tiehm et al., 1997), and the high cost of implementing remediation technologies (NRC, 1994, 1999; USEPA, 2001).
1.1
Remedial Efforts
(Ae-lion and Kirtland, 2000; Cho et al., 1997; Corbin et al., 1994; Heron et al., 1998; Ji et al., 1993; Johnson et al., 2004; Kyte and Berry, 1975; Martin et al., 1991; Waduge et al., 2004), in situ biodegradation (Tiehm et al., 1997; Vayenas et al., 2002; Yang and McCarty, 2000), cosolvent flushing (Kibbey et al., 2002; Lunn and Kueper, 1999b; Pennell et al., 1996; Ramsburg and Pennell, 2002), and surfactant-enhanced dissolution (Dwarakanath et al., 1999; Dwarakanath and Pope, 2000; Pennell et al., 1994; Tiehm et al., 1997). Remediation of subsurface systems contaminated with DNAPLs contin-ues to pose one of the biggest environmental challenges (NRC, 1994, 1999; Pankow and Cherry, 1996).
Active contaminant source-zone remediation can remove significant fractions of non-aqueous phase liquid (NAPL) mass from the subsurface (Hill et al., 2001; Johnson et al., 2004; Miller et al., 2000; Schnarr et al., 1998). However, the endpoint of concern often is the effect of remediation efforts on contaminant concentration distributions in space and time (Kavanaugh et al., 2003; Stroo et al., 2000; USEPA, 2000). Clearly in the long-time limit, source-zone removal will be universally effective. However, the short-time limit, i.e., immediately after source-zone remediation is completed, is a much more stringent condition to control, but is usually the limit of greatest concern to stakehold-ers (Kavanaugh et al., 2003). Substantial reductions, often ordstakehold-ers of magnitude, in contaminant concentrations and contaminant mass fluxes are necessary in the short-time limit in order for a technology to be deemed effective (Sale and McWhorter, 2001). Such extreme reductions in concentrations and mass fluxes of contaminants and their daughter products are especially difficult to achieve in heterogeneous porous medium systems (Mravik et al., 2003; Saenton et al., 2002). Many technologies that have re-moved large quantities of mass still fail to achieve drinking water standards (Brown et al., 1999; Fountain, 1998; Hirasaki et al., 1997; Jawitz et al., 2000; Londergan et al., 2001; USEPA, 2004). Therefore, it is important to assess the reduction in mass flux post- remediation to assess the benefits of remediation.
1.2
Research Objectives
Although laboratory results conducted by Miller and co-workers (Hill et al., 2001; Miller et al., 2000) are very promising, there are a number of issues that still need to be addressed in order to advance application of this technology: (1) enhancing brine-based remediation technologies (BBRTs) to approach near complete removal by increasing surfactant volumes or by adding an additional remediation step such as vapor extrac-tion, (2) assessing removal as a function of increasing heterogeneity of the system and scale of the system, (3) analysis of changes in downgradient contaminant concentrations and flux after reductions in source zone mass, (4) developing approaches to optimize the choice and usage of surfactant and brine technologies, and (5) investigating the ability to inject and recover dense, viscous brine from subsurface environments.
The open issues are broad and there are years of research that remains to be done before a mature state of knowledge is achieved. Consequently, for this work the scope has been narrowed to the following specific aims:
1. to investigate the performance of a three-fluid-phase brine barrier technology on removal of chlorinated solvents in heterogeneous porous media systems;
2. to evaluate the extent and impact of source-zone removal of chlorinated solvents on contaminant concentration and flux; and,
3. to investigate dense, viscous brine behavior in heterogeneous porous medium systems.
1.3
Organization
chapters and a discussion of open issues that require of further research. A bibliography of the manuscripts associated with Chapter 2 through Chapter 4 is listed as follows:
Chapter 2: Johnson, D.N., Pedit, J.A., and Miller, C.T. Efficient, Near-Complete
Removal of DNAPL from Three-Dimensional, Heterogeneous Porous Media Us-ing a Novel Combination of Treatment Technologies, Environmental Science & Technology,38(19): 5149–5156.
Chapter 3: Wright, D. Johnson, Birak, P.S., Pedit, J.A., and Miller, C.T.
Effective-ness of Source-Zone Remediation of DNAPL-Contaminated Subsurface Systems, Journal of Environmental Engineering, in print.
Chapter 4: Wright, D. Johnson, Pedit, J.A., Gasda, S.E., Farthing, M.W.,
Chapter 2
Efficient, Near-Complete Removal of DNAPL from
Three-Dimensional, Heterogeneous Porous Media
Using a Novel Combination of Treatment Strategies
Reproduced with permission from Environmental Science & Technol-ogy, Johnson, D.N., Pedit, J.A., and Miller, C.T. Efficient, Near-Complete Removal of DNAPL from Three-Dimensional, Heterogeneous Porous Media Using a Novel Combination of Treatment Technolo-gies, 38(19): 5149–5156. Copyright 2004, American Chemical Society. http://dx.doi.org/10.1021/es0344765
2.1
Introduction
Pankow and Cherry, 1996; Pennell et al., 1996; Powers et al., 1992, 1996; Willson et al., 1999), mass transfer limitations (Hunt et al., 1988a,b; Kaslusky and Udell, 2002; Miller et al., 1990; Powers et al., 1992; Rao et al., 1997; She and Sleep, 1999; Yang and McCarty, 2000; Zhou and Rhue, 2000), and DNAPL dissolution instabilities (Imhoff et al., 1996; Mercer and Cohen, 1990).
Despite this improved understanding, there is not a promising course that can re-alistically be expected to solve this problem in the near future. One reason for this situation is that many technologies rely on mass transfer from the DNAPL to a mo-bile fluid phase. This approach requires long time scales for near-complete DNAPL removal because the mass transfer rates are slow (Hunt et al., 1988a,b; Kaslusky and Udell, 2002; Miller et al., 1990; Powers et al., 1992; Rao et al., 1997; She and Sleep, 1999; Yang and McCarty, 2000; Zhou and Rhue, 2000). Other technologies rely on mobilization of free phase DNAPL (Fu and Imhoff, 2002; Heron et al., 2002; Hill et al., 2001; Hofstee et al., 2003; Hunt et al., 1988a; Imhoff et al., 1995; Kaslusky and Udell, 2002; Kibbey et al., 2002; Lunn and Kueper, 1997, 1999a,b; Miller et al., 2000; Okuda et al., 1996; Oostrom et al., 1999; Pennell et al., 1996; Ramsburg and Pennell, 2002; Ramsburg et al., 2003; She and Sleep, 1999; Tiehm et al., 1997; Van Valkenburg and Annable, 2002; Yan et al., 2003). Unfortunately, the mobilized DNAPL may enter pre-viously uncontaminated portions of the subsurface environment (Brandes and Farley, 1993; Imhoff et al., 1995; Kaslusky and Udell, 2002; Okuda et al., 1996; Pennell et al., 1993, 1994, 1996). Although the goal of density conversion technologies is to combat this problem, experiments with this approach have been limited to predominantly one-and two-dimensional studies in homogeneous systems or systems with lenses (Brone-andes and Farley, 1993; Hofstee et al., 2003; Kibbey et al., 2002; Lunn and Kueper, 1997, 1999a,b; Pennell et al., 1996; Ramsburg and Pennell, 2002; Ramsburg et al., 2003; Yan et al., 2003). Unexpected downward mobilization may still occur at a contami-nated field site with density conversion technologies if surfactants are present (Lunn and Kueper, 1997; Pennell et al., 1996; Rao et al., 1997; Van Valkenburg and Annable, 2002).
consuming to perform, they are needed to aid the rate of advancement of more effective DNAPL removal technologies.
Relatively large fractions of DNAPL must be removed from most contaminated systems to reach health-based standards (Mercer and Cohen, 1990; Pankow and Cherry, 1996). However, no laboratory study is known of that has demonstrated a high fraction of DNAPL removal in a realistic heterogeneous three-dimensional system using any technology. Considerable effort along these lines seems both highly challenging and necessary for resolution of this important problem.
Previously, several related technologies based upon the use of dense brines and sur-factants to effect DNAPL mobilization and recovery in one-, two-, and three-dimensional systems were investigated (Hill et al., 2001; Miller et al., 2000). While the results have been promising, it has also noted that many open issues remain for this class of problem. Three-dimensional experiments of this sort, while unique in the research community, have been preliminary in nature and no technology capable of efficiently achieving anything approaching near-complete removal of DNAPL from heterogeneous, three-dimensional systems has been found.
The overall goal of this work is to develop and demonstrate a technology that is capable of efficient, near-complete removal of DNAPL from three-dimensional hetero-geneous porous medium systems. The specific objectives of this work are: (1) to inves-tigate DNAPL entrapment and removal in heterogeneous, three-dimensional systems; (2) to evolve a technology that is capable of near complete removal of DNAPL; (3) to demonstrate that near complete removal of DNAPL from a realistic porous medium system is possible; and (4) to assess open issues that must be resolved before a mature DNAPL remediation technology is available.
2.2
Approach
2.2.1
Conceptual Model
and the observation that the residual DNAPL remaining after such treatment has a relatively high specific DNAPL-gas phase interfacial area, which should lead to efficient vapor-phase extraction.
Because of the dominant importance of dimensionality and heterogeneity on reme-diation of natural systems and the scarcity of such controlled laboratory investigations, the studies are restricted to a heterogeneous, three-dimensional system. Because such studies are difficult to perform, the investigations are restricted to a single realization of a random field. A brief overview of the experimental methods follows, with details given in subsequent sections.
Each experiment was conducted in a three-dimensional cell that was packed with uncontaminated sands. DNAPL was injected into the initially water-saturated system. A dense brine barrier was established beneath the contaminated zone by injecting brine into the bottom corners of the cell. A downward surfactant flush was then performed to reduce the interfacial tension between the nonwetting and wetting phases. Reducing the interfacial tension promoted downward mobilization of the DNAPL. Further mo-bilization was achieved by draining the system to reduce buoyancy forces (Hill et al., 2001; Miller et al., 2000). In some experiments, an attempt was made to remove residual DNAPL by vapor-phase extraction.
2.2.2
Materials
The three-dimensional cell used in these experiments, as depicted in Figure 2.1, was a glass container fitted with an aluminum lid. The glass container was 22.5-cm long, 16.5-cm wide, and 24-cm high. Glass tubing was used to inject brine into the four bottom corners of the cell. Glass coated needles were used to inject DNAPL and to extract effluent.
The porous media in this work consisted of six quartz sands: Accusands A12/20, A20/30, A30/40, and A40/50; American Foundry Society (AFS) Silica 50/70; and United States (U.S.) Silica F-125. The relevant physical properties of these sands are listed in Table 2.1.
The fluids used in these experiments were distilled, deionized (DDI) water, trichloroethy-lene (TCE) as the DNAPL, a surfactant flushing solution, and a dense brine made of a calcium bromide (CaBr2) solution. The properties of these solutions are listed in
Figure 2.1: Three-dimensional experimental apparatus; (a) Cell schematic for surfac-tant flushing and TCE extraction and (b) layout of front and side of glass cell.
g/cm3) greater than the density of TCE (1.4639±0.0002 g/cm3), which is necessary
for the brine to form an effective barrier against downward migration of TCE. The brine’s viscosity was 6.652 ±0.033 mPa-s, as measured by a Haake falling ball vis-cometer (www.haake.com). The brine’s viscosity relative to water’s viscosity indicates that the brine will spread slowly in the subsurface and allow for the recovery of a large percentage of brine solution through hydraulic control (Bond, 2000).
The TCE solution was prepared using high pressure liquid chromatography (HPLC)-grade TCE, 14C–labeled TCE, and 0.01% by weight Oil-Red-O (ORO), a certified
biological stain (www.sigma-aldrich.com). The red stain made it possible to observe the TCE during the experiments. The density of the TCE solution was previously determined to be 1.4639±0.0002 g/cm3 at 20◦C (Hill et al., 2001; Miller et al., 2000).
The viscosity of the TCE was 0.577±0.004 mPa-s (Lide, 1997).
Table 2.1: Porous media properties for TCE laboratory cells.
Accusand Accusand Accusand Accusand AFS U.S.
Property A12/20 A20/30 A30/40 A40/50 Silica Silica
(Schroth (Schroth (Schroth (Schroth 50/70 F-125 et al., 1996) et al., 1996) et al., 1996) et al., 1996)
d50 1.105 0.713 0.532 0.359 0.256 0.108
(mm) ±0.014 ±0.023 ±0.003 ±0.010
Uniformity 1.231 1.190 1.207 1.200 1.207 1.753 Coefficient ±0.043 ±0.028 ±0.008 ±0.018
(d60/d10)
Particle 2.665 2.664 2.665 2.663 2.664 2.653
Density (g/cc)
Hydraulic 0.503 0.250 0.149 0.0722 0.00966 0.00210 Conductivity ±0.017 ±0.0052 ±0.0052 ±0.0018
(cm/s)
Air Entry 5.42 8.66 13.03 19.37 35.00 80.2
Pressure (cm H2O)
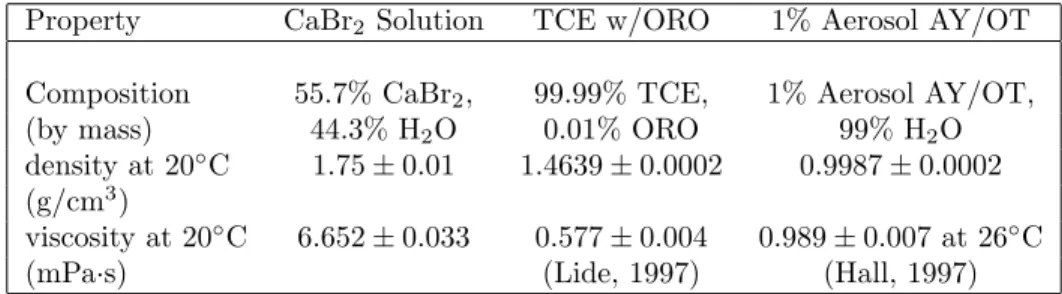
Table 2.2: Physical properties of the fluids for TCE laboratory cells.
Property CaBr2 Solution TCE w/ORO 1% Aerosol AY/OT
Composition 55.7% CaBr2, 99.99% TCE, 1% Aerosol AY/OT,
(by mass) 44.3% H2O 0.01% ORO 99% H2O
density at 20◦C 1.75±0.01 1.4639±0.0002 0.9987±0.0002 (g/cm3)
viscosity at 20◦C 6.652±0.033 0.577±0.004 0.989±0.007 at 26◦C
(mPa·s) (Lide, 1997) (Hall, 1997)
was previously determined to be 1.40×10⁻³±0.03×10⁻³ N/m, and the critical micelle concentration of the surfactant was determined to be 0.233% by weight (Hill et al., 2001). The density of the surfactant was 0.9987±0.0002 g/cm3 (Hill et al., 2001).
2.2.3
Three-Dimensional Experiments
layer. The 14 layers above the fine sand layer were packed heterogeneously based on an indicator random field model assuming anisotropic exponential covariance conditions and a log normal particle size distribution (Christakos, 1992b; Deutsch and Journel, 1992). Each layer was 1-cm thick and comprised of cubes of homogeneous sands and of lengths and widths of 1.5 cm. Correlation lengths of 7.5 and 2.5 cm for the horizontal and vertical planes, respectively, were used to match the scale of the experiments. The mean and standard deviation were -0.698 ln(mm) and 0.4, respectively. The relatively narrow distribution was used so that the vast majority (98.5%) of the model-generated particle diameters fell within the range of sands used in the experiments. The final layer above the random field consisted of coarse sand (Accusand A12/20). The packing was consistent for all experiments.
Needles and glass tubing were inserted into the packed cell, and the system was sealed with a gasket-lined aluminum lid. The cell was then vibrated to consolidate the media, confirmed to be air-tight, flushed with carbon dioxide (CO2) gas, and lastly
saturated and flushed with deaired DDI water in an upwards-flow manner. Following complete saturation, the injection of water was halted and a syringe pump was used to inject approximately 104 ml of TCE into the center of the tenth layer from the bottom of the random field at a rate of 0.15 ml/min. This volume of TCE was sufficient to result in a TCE pool on top of the low permeability layer at the bottom of the cell. Once injection was complete, the system was undisturbed for 12 hours to allow the fluids to redistribute to a quasi-static distribution.
Syringe pumps were then used to inject brine into the cell through the four bottom corner ports at a combined rate of 2 ml/min. The addition of brine caused the water level to rise above the sand’s surface. The water above the sand’s surface was extracted from the cell and its dissolved TCE content quantified. The brine flow rate was reduced to 0.25 ml/min once a brine barrier was established above the bottom fine sand layer. The reduced brine flow rate helped maintain the brine layer during the surfactant flush and dewatering of the system.
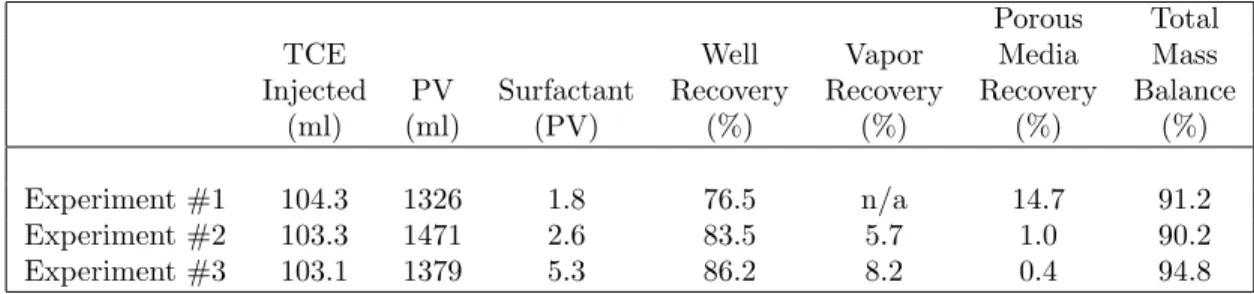
Table 2.3: Summary of Experimental Results for TCE Recovery.
Porous Total
TCE Well Vapor Media Mass
Injected PV Surfactant Recovery Recovery Recovery Balance
(ml) (ml) (PV) (%) (%) (%) (%)
Experiment #1 104.3 1326 1.8 76.5 n/a 14.7 91.2
Experiment #2 103.3 1471 2.6 83.5 5.7 1.0 90.2
Experiment #3 103.1 1379 5.3 86.2 8.2 0.4 94.8
injected into the tenth layer from the bottom of the random field, and it pooled on top of the bottom fine sand layer, so a PV was taken to be the pore space volume of the bottom 10 layers of the random field.
For the first and second experiments, a syringe pump was used to extract the re-mediation stream through a single needle in the bottom layer of the random field. The extraction setup was modified for the third experiment. The remediation stream was extracted from needles in each of the bottom three layers of the random field using a stepped approach. Extraction began in the third layer from the bottom of the random field and continued until approximately 1.5 PVs had been extracted from the system. Extraction was then switched to the second layer from the bottom of the random field until an additional PV had been removed. Extraction was then switched to the bottom layer of the random field for the remainder of the experiment. The motivation for this approach was to determine if DNAPL recovery could be improved by minimizing the amount of mobilized DNAPL that reached the bottom layer of the random field.
The remediation stream from all experiments was extracted from the cell at a rate of 2 ml/min into a 50-ml air-tight glass syringe. The contents of the syringe was periodically emptied into glass sample jars. Extraction continued until the syringe pump withdrew more gas than liquid from the system. At this point, the system was partially saturated and in a state conducive to vapor-phase extraction of residual DNAPL.
brine ports were removed and two-way valves were attached to the tubing from each brine port. The two-way valves were used to control the influent and effluent locations of the nitrogen gas. A flow meter was used to inject nitrogen gas at 50 ml/min into the porous medium through one port. The effluent from the vapor-phase extraction process was collected from an adjacent or opposing port. The location of the influent and effluent ports was varied such that all possible combinations were used. Effluent from the cell flowed through a two-stage condenser in an attempt to collect and quantify the DNAPL leaving the system. The first stage of the condenser contained ice water, and its temperature was maintained between 0◦C and 1◦C by periodic additions of ice. The second stage contained methanol, and its temperature was maintained at approximately -40◦C by periodic additions of liquid nitrogen. The vapor-phase extraction stage was stopped when DNAPL was no longer being condensed out of the effluent stream.
The amount of DNAPL remaining in the system was determined by extracting the DNAPL from the porous medium at the end of each experiment (Hill et al., 2001). To provide some vertical resolution of the DNAPL’s distribution, the porous medium was collected from the cell one or two layers at a time with an aluminum scoop and placed in glass sample jars.
2.2.4
Analytical Methods
The analytical method for quantifying TCE was similar to the scintillation method of Hill et al. (2001). The liquid samples from the experiments contained aqueous and nonaqueous phases. The porous medium samples also contained sand. The aqueous phase of the samples contained dissolved TCE, CaBr2, and surfactant. The nonaqueous
phase was predominantly TCE. A known amount of hexane was added to each sample to extract TCE from the aqueous phase into the hexane-TCE organic phase. Three milliliters of the organic phase of each extracted sample was combined with 10 ml of ScintiSafe (www.fishersci.com) scintillation cocktail and the resultant samples counted on a Packard Liquid Scintillation Analyzer Model 1900TR (www.packardinst.com).
2.2.5
Visualization Methods
Images of one face of the three-dimensional cell were captured every 20 minutes during the experiments. The ORO dye added to the TCE made it possible to see the TCE on the face of the cell. However, the dye is not dissolved or volatilized in the same manner as the TCE so the amount or intensity of the dye is not an indicator of the amount of TCE remaining.
2.3
Results
The experimental conditions and results of the three experiments are summarized in Table 2.3. Table 2.3 lists the volume of TCE injected, PV of the contaminated zone, volume of the surfactant flush, percent of the injected TCE recovered during the well and vapor-phase extraction phases, percent of the injected TCE recovered from the porous medium at the end of each experiment, and the overall TCE mass balance. Experiment #1 used only a surfactant flush to recover TCE. Experiment #2 used a surfactant flush followed by vapor-phase extraction. Experiment #3 used a stepped approach during the surfactant flush followed by vapor-phase extraction.
Images representative of each phase of Experiment #2 are shown in Figure 2.2. The images in Figure 2.2 are from one face of the cell and show (a) initial water-saturated conditions, (b) completion of TCE injection with pooling evident in the bottom layers of the random field, (c) establishment of a brine barrier at the bottom of the cell, (d) surfactant breakthrough with downward TCE mobilization evident midway through the surfactant flush, (e) system prior to dewatering, and (f) system partially saturated prior to vapor-phase extraction. Figure 2.2(b) shows how TCE pooled in the two coarsest sands (Accusands A12/20 and A20/30) due to their low entry pressures. Figure 2.2(d) and other images acquired during the surfactant flush show that TCE preferentially migrated downward through the coarser sands after interfacial tension was reduced. Figure 2.2(e) shows evidence that lateral spreading of TCE into finer sands occurred towards the end of the surfactant flush. Inspection of the images recorded after the dewatering step showed that the TCE remaining in the system was in the form of residual and discontinuous thin layers at the level of the extraction well. Images from the other experiments are similar to those in Figure 2.2 and video files from all three experiments are available through the Supporting Information.
Figure 2.2: Photos depicting Experiment #2: (a) the initial saturated conditions, (b) completion of TCE injection, (c) establishment of a brine barrier at the bottom of the cell, (d) midway through the surfactant flush, (e) the cell prior to dewatering, and (f) the dewatered cell.
Figure 2.3: Cumulative TCE recovery from extraction well(s)
account for the difference in PVs of surfactant indicated in Table 2.3 and total PVs extracted from the system shown in Figure 2.3.
Figure 2.3 shows that a large fraction (32% to 48%) of the injected TCE was easily recovered at the beginning of the well extraction phase of each experiment. This rapid recovery occurred because the extraction point was located in the large TCE pool in the lower layers of the random field. The variation in initial recovery demonstrates how small variations in the sand packing changed the connectivity of the initial TCE pool. The TCE recovery rate slowed after the initial rapid recovery until the downward surfactant flush reached residual TCE in the middle layers of the random field at about 0.6 to 0.8 PVs. At this point the TCE recovery rate increased as surfactant break-through lowered interfacial tension and promoted downward mobilization of residual TCE. DNAPL was evident in the effluent stream until about 2 PVs in Experiments #1 and #2, and about 4 PVs in Experiment #3. TCE recovery after this point and before final dewatering was primarily through dissolution. DNAPL was also evident in the effluent stream in the samples collected at the end of the dewatering stage, and this final DNAPL mobilization can be attributed to a reduction in buoyancy.
volume of the amount of surfactant flush increased TCE recovery in Experiment #1 compared to previous work (Hill et al., 2001) as well as in subsequent experiments in this work. Increasing the volume of the surfactant flush increased the amount of desaturation during the dewatering stage. Increased desaturation is beneficial because buoyancy forces are reduced and additional DNAPL mobilization may occur. Well extraction was followed by vapor-phase extraction in Experiments #2 and #3, and the effectiveness of vapor-phase extraction is increased under less saturated conditions (Domenico and Schwartz, 1998; USEPA, 1996). Hence, the additional surfactant used to increase dissolution also assisted in further desaturation of the medium and possibly led to increased efficiency of the vapor-phase extraction stage.
Surfactant precipitated out of solution near the level of the extraction well. This occurred because the solubility of the surfactant was reduced by the brine. These particles formed after surfactant breakthrough, and the volume of particles increased with the volume of surfactant. These particles can potentially lead to pore clogging as well as decreases in hydraulic conductivity.
Experiment #3 had three extraction wells instead of one, each in a different layer of the random field. By introducing surfactant and removing the pool formed at the third and second layers above the bottom fine sand layer, the mass of TCE left to migrate further downward was minimized. However, this does not suggest that the mass of residual remaining using the multilevel extraction approach was less than the mass of residual remaining using one well. Some residual was entrapped in the fine regions in the second and third layers as well as in the first layer. This entrapment is less favorable and may have led to more residual remaining in the system.
The addition of vapor-phase extraction to the remediation scheme in Experiments #2 and #3 increased the recovery of TCE by about 5–8% (Table 2.3). However, tests of the condenser system showed that its efficiency was approximately 85% when no water was present. Therefore, approximately 6–9% was recovered during vapor-phase extraction. A gas leak was detected during vapor-phase extraction in Experiment #2. This leak may explain why TCE recovery during vapor-phase extraction for Experiment #2 was lower than for Experiment #3, and why Experiment #2 had the lowest total TCE recovery.
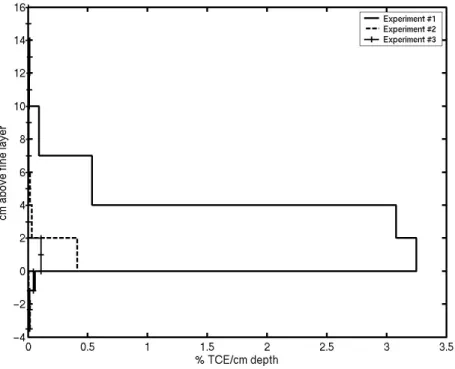
Figure 2.4: Approximate TCE profile at the end of experiments based on porous media extractions.
Therefore, this figure serves primarily to demonstrate how the TCE remaining in the system after well and vapor-phase extraction was approximately distributed as well as how the remaining TCE changed with the addition of vapor-phase extraction to the remediation scheme.
The amount of TCE in the system at the end of each experiment was 14.7% in the absence of vapor-phase extraction and 0.4–1% in the presence of vapor-phase extraction (Table 2.3). Figure 2.4 shows that most of the TCE was distributed over the bottom 4 cm or four layers of the random field in the absence of vapor-phase extraction and over the bottom two layers in the presence of phase extraction. The impact of vapor-phase extraction on residual recovery is also evident from this figure. Not only was the distribution of mass decreased but also the amount of mass in the overall system.
2.4
Discussion
scarce attention in the literature. This is for good reason, since such experiments are difficult and time consuming to perform. It is essential to conduct such experiments and to continue to work toward systems that mimic a wide range of field conditions.
Images from the experiments show that DNAPL movement and entrapment were strongly affected by heterogeneity in the porous media. This is consistent with previ-ous detailed experiments conducted in the field (Poulsen and Kueper, 1992), and with simulations performed for such systems. Based upon these observations and previous observations, it is expected that the complexity of the DNAPL flow and entrapment will increase as the heterogeneity of the media increases. Evidence of this can be noted from experiments by examining the irregular DNAPL distribution patterns on each of the four exposed faces of the three-dimensional cells. Given this complexity and the resultant complexity of the flow patterns for any flushing technology through such a system, much is to be learned about the relationship between media heterogeneity, entrapment, and remediation. Roughly 85% removal is obtainable at the level of het-erogeneity investigated using a combination of a brine-barrier and surfactant/gravity mobilization strategy. However, there is a point at which mass transfer limitations led to a rapid decrease in the rate at which DNAPL was removed from the system by surfactant flushing.
The second objective of this work was to develop a technology capable of near complete removal of DNAPL. To meet this objective, a vapor-phase extraction step was added to the remediation approach taken in previous work (Hill et al., 2001; Miller et al., 2000). This notion was based upon the observation that the surfactant flushing and gravity drainage step of the brine-containment remediation method results in an increased relative interfacial area between the DNAPL and the vapor phase. It is hypothesized that the combined result of mobilization via control of the capillary and gravity forces, containment by the brine barrier, and polishing via DNAPL-vapor phase extraction might accomplish the objective of efficient near-complete removal.
The fourth objective was to assess open issues remaining before a mature DNAPL remediation technology is available. There are many such relevant issues and that considerable work remains before a mature technology can exist. The following consid-erations in this list as related to the class of technologies investigated in this work are included, but some of these concerns are also more broadly applicable to the general field of research:
1. Effects of increased heterogeneity. Real natural systems can be significantly more heterogeneous than the systems investigated in this work. Clearly, removal of high fractions of DNAPL in such systems might be much less efficient than the results obtained in this work. Such experiments are very time consuming and difficult, but they are important to do in order to make realistic assessments of the performance of any technology under such conditions in the field.
2. Effect of remediation. The chief end point for most DNAPL sites is the resulting aqueous phase concentration after remediation, which is an area of significant recent investigation. Experiments should be performed to examine the impact of DNAPL remediation strategies on this endpoint for realistic conditions.
3. Brine recovery. The class of strategies used in this work requires the addition of a dense brine to control the movement of DNAPL once it is mobilized. Ide-ally, a large fraction of this brine should be recovered. The complexity of the systems of concern make the assessment of the brine recovery process in hetero-geneous media an open question. Preliminary work has shown this brine can be recovered efficiently (Bond, 2000), but the final word is not yet written since all aspects of these systems were not resolved with a high resolution simulator and no experiments for these systems have been performed.
Resolution of these open issues for the class of technologies considered in this work will require considerable additional effort. However, such steps should be anticipated for any technology envisioned to remediate DNAPLs. This class of problems has not been resolved for very good reason: they are among the most challenging class of problems facing the environmental sciences community.
2.5
Supporting Information Available
Movies depicting the experiments are available at
Chapter 3
Effectiveness of Source-Zone Remediation of
DNAPL-Contaminated Subsurface Systems
Reproduced ahead of print with permission from ASCE,Journal of En-vironmental Engineering, Wright, D. Johnson, Birak, P.S., Pedit, J.A.,
and Miller, C.T. Effectiveness of Source-Zone Remediation of DNAPL-Contaminated Subsurface Systems, in print. Copyright 2010, ASCE. http://dx.doi.org/10.1061/(ASCE)EE.1943-7870.0000165
3.1
Introduction
For more than 25 years, concerted efforts have been made to remediate contaminated subsurface systems. Despite these efforts, few sites have achieved cleanup to drinking water standards, such as the U.S. EPA’s MCLs (NRC, 2005). Achievement of maximum contaminant levels (MCLs) is difficult for sites in which contamination has been caused by the release of DNAPL (ITRC, 2002; Kavanaugh et al., 2003; McGuire et al., 2006; NRC, 2005). DNAPL contamination is especially problematic because the contaminant species can pose health concerns at relatively low concentrations, yet the contaminants slowly degrade and are long-lived in the environment (USEPA, 1993b).
general trends have led to the classification of contaminated systems into a source-zone region where the DNAPL is present and a plume region where the contaminant has been transported following dissolution into the water phase. The distribution of mass between a DNAPL source zone and plume zone depends upon many factors, including the length scale of the source zone, the velocity of the aqueous phase, the solubility of the DNAPL constituents of concern, and the age of the spill. For some sites, the majority of the DNAPL mass will be contained in source zone, while for older sites having permeable media and a relatively short length-scale source zone, the majority of the mass originally present in the DNAPL source zone may have already been removed from the source zone.
Remediation of contaminated subsurface systems has frequently been aimed at restoring groundwater quality to levels approaching the standards for drinking water quality. There is near universal agreement that pump-and-treat methods are inefficient for DNAPL removal and cannot be expected to reduce contaminant levels to typical cleanup targets in what most people would consider a reasonable length of time (Ka-vanaugh et al., 2003; Keely, 1991; Mackay and Cherry, 1989; Mercer and Cohen, 1990; NRC, 1994, 1997, 2005). At DNAPL contaminated sites, any chance for achieving such groundwater standards in a relatively short period of time, say less than a few years, is typically only possible after using more active source-zone remediation (USEPA, 1993b). Unfortunately, efforts to remediate DNAPL source zones have often failed to produce long-term reductions in groundwater concentrations to levels at or below MCLs (McGuire et al., 2006; NRC, 2005).
Johnson et al., 2004; Miller et al., 2000; Ramsburg et al., 2003). It seems reasonable to conclude that a significant need remains to develop an effective source-zone remediation method, but the path forward is not clear.
At the same time, considerable interest has evolved over the evaluation of the effects of source-zone remediation (Christ et al., 2006; ITRC, 2002, 2004; Kavanaugh et al., 2003; McGuire et al., 2006; NRC, 2005; Soga et al., 2004). The central point of interest is the relationship between mass removal from a source zone and the magnitude of observed changes in concentrations and/or the flux of contaminants downstream of the source zone. Such a relationship is critical because it is typically the basis for evaluating if remediation has successfully met its goal. Interestingly, the relationship between source-zone flux and mass removal has proven elusive, with some even finding that mass removal can lead to increases in down-gradient concentrations or fluxes (McGuire et al., 2006). The lack of a clear understanding of the fundamental processes contributing to this relationship provide an impediment to realistically evaluating the results of active and expensive technologies used for source-zone remediation intended to reduce human and ecological risk (SERDP and ESTCP, 2006).
The overall goal of this work is to advance understanding of the effects of source-zone remediation. The specific objectives of this work are: (1) to evaluate the effect of source-zone remediation on down-gradient concentrations and mass flux, (2) to assess factors that contribute to observed results, (3) to provide guidance on when source-zone remediation should be considered, and (4) to discuss issues that must be resolved before a reliable model of such systems can be advanced.
3.2
Background
Rhue, 2000; Zhu and Feng, 2003). In the saturated zone, air sparging has been used to increase volatilization (Aelion and Kirtland, 2000; Heron et al., 2002; Ji et al., 1993; Johnson et al., 1999, 1997; Johnston et al., 2002; Kim et al., 2004; Rogers and Ong, 2000). Vapor-phase extraction can enhance the mass flux of volatile DNAPLs in the unsaturated zone or dewatered source zones as a result of the large volumetric flow rates of a gas phase that can be achieved at a relatively low cost compared to liquid phases (Aelion and Kirtland, 2000; Corbin et al., 1994; Johnson et al., 2004; Kirtland and Aelion, 2000). Although these technologies may enhance the rate of mass transfer, they can still require long time frames, albeit shorter than conventional pump-and-treat methods, for complete source-zone removal and attainment of health-based standards. Separate phase NAPL mobilization and recovery is another class of technologies that has been developed to actively remediate DNAPL source zones. Mobilization of DNAPLs can be achieved by reducing the interfacial tension of residual NAPL using cosolvents (Brandes and Farley, 1993; Fu and Imhoff, 2002; Gauthier and Kueper, 2006; Imhoff et al., 1995; Ramsburg et al., 2005) or surfactants (Dong et al., 2004; Gupta and Mohanty, 2001; Hill et al., 2001; Johnson et al., 2004; Miller et al., 2000; Pennell et al., 1996; Ramsburg et al., 2005; Willson et al., 1999). These methods have the advantages of requiring small volumes of flushing solution to achieve large fractional mass removals and of being relatively fast compared to enhanced dissolution, however, they also have a possible drawback of mobilizing DNAPLs downward into subsurface zones that were previously uncontaminated. In response to this concern, BBRTs have been developed to control downward migration (Hill et al., 2001; Johnson et al., 2004).
increas-ingly greater, and it becomes less likely that sufficient DNAPL can be mobilized to result in a continuous non-wetting phase. Thus, it appears unrealistic to expect high fractions of DNAPL removal via mobilization alone in field settings with low initial saturations. Though fractional mass removal has traditionally been the metric used to judge success in experimental work, it is not the metric used to judge success in the field. Ultimately the concentration down gradient from a source zone is compared to groundwater standards, such as MCLs, which can be several orders of magnitude lower than the solubility limit of a DNAPL species. However, little relationship has been found between mass removal and the resultant dissolved-phase concentrations (McGuire et al., 2006; Soga et al., 2004). Thus, there has been increased interest over the last several years to understand the effect of source-zone remediation on changes in down-gradient solute concentrations. Overall mass transfer of DNAPL in a source zone to the aqueous phase is the dominant process of interest in understanding the effect of source-zone remediation.
mod-ified Sherwood number (Sh0 = Kld250/Dm), where d50 is a mean grain diameter of the
porous medium, andDm is the molecular diffusion coefficient. Experimental data have
provided a basis for non-dimensional empirical correlations that relate the Sherwood number to other parameters including the Reynolds number, Schmidt number, and the residual saturation (Miller et al., 1990). Though these correlations may be suc-cessful for certain experimental conditions, the coefficients in these expressions cannot be universally applied and may require fitting when applied to new systems (Imhoff et al., 1998). This is so because of the incomplete characterization of the underlying physicochemical mechanisms leading to mass transfer that can be characterized by the small set of macroscale variables typically examined. Put another way, mass transfer coefficient correlations, even at the laboratory scale, are rough approximations based upon incomplete characterizations of the underlying mechanisms.
In the last 10 years, research has been conducted to develop upscaled models that attempt to account for increased dimensionality and complexity of field-scale condi-tions (Fure et al., 2006; Park and Parker, 2005; Parker and Falta, 2008; Saba and Illangasekare, 2000; Saenton et al., 2002). For example, an expression has been de-veloped to approximate Sh0 considering the length scale for a given system (Saba and Illangasekare, 2000; Saenton et al., 2002). Similar to the correlations developed from one-dimensional data, this correlation still requires experimental data to determine the coefficients for a given system. Mass transfer correlations have also been posited at the field scale (Park and Parker, 2005; Parker and Falta, 2008). These approaches have shown promise at being able to describe dissolution fluxes at the field scale but require parameterization based on field-scale observations.
A somewhat more pleasing approach is to represent the mass transfer coefficient as the product of a mass transfer rate coefficient and the specific interfacial area (klana =
Kl). This approach has appeal because of the leading order importance of interfacial
area in the process. However, this approach is only of practical use for cases in which the interfacial area is known. In recent experimental studies, MRI imaging has been used to determine interfacial area and has shown that mass transfer models using the interfacial area provide the best agreement to measured mass transfer rates (Zhang et al., 2008). Recent work has also evolved a computational approach to model dissolution from first principles at the pore scale (Pan et al., 2007). This pore scale modeling has shown good agreement with laboratory experiments and confirmed that the Sherwood number (Sh = kld50/Dm) is insensitive to changes in residual saturation (Pan et al.,
(Grant and Gerhard, 2007a), which requires the capillary pressure-saturation function and has been used to simulate effluent concentrations from two-dimensional laboratory dissolution experiments (Grant and Gerhard, 2007b).
The current understanding is that mass transfer is fundamentally driven by the distribution of DNAPL in the source zone, which is controlled by heterogeneity and plays a central role in the dissolution process across all scales (Page et al., 2007; Park and Parker, 2005; Parker and Park, 2004; Sale and McWhorter, 2001; Soga et al., 2004). The DNAPL distribution in a porous medium has been termed the source-zone architecture, but it can more precisely be referred to as the morphology and topology of the DNAPL distribution (Pan et al., 2007).
Not surprisingly, recent work on mass transfer has focused on factors that play a key role in affecting DNAPL morphology and topology. For example, heterogeneity has been shown to greatly influence the rate of dissolution (Mayer and Miller, 1996; Page et al., 2007; Parker and Park, 2004; Powers et al., 1994; Soerens et al., 1998). A primary reason for the importance of heterogeneity is its effect on the distribution of DNAPL, which forms both regions of small length scale residual saturation and longer length scale pools. Recent attention has been paid to the differentiation of residual DNAPL and pooled DNAPL via the ganglia-to-pool ratio (Christ et al., 2006; Lemke and Abriola, 2006; Lemke et al., 2004). However, this ratio is an imprecise statement of the importance of the fluid morphology and topology, as embodied in such measures as the specific interfacial area. Other recent work, using partitioning tracers to parameterize a stream-tube-based dissolution model, has demonstrated some of the limitations of the ganglia-to-pool ratio (Basu et al., 2008).
con-taminated DNAPL systems is elusive. To close this gap, more realistic experiments across a range of saturations, scales, and media complexity, as well as more realistic models are needed.
Developing a fundamental understanding of the effect of DNAPL remediation on mass transfer at the field scale is of even greater complexity. This requires understand-ing the effect of the remedial strategy on the DNAPL morphology and topology and assessment of the system evolution during remediation. Achieving this final goal will require a substantial amount of additional work, but clearly understanding the issues involved can serve to redirect experimental, theoretical, and computational efforts.
3.3
Approach
3.3.1
Methods
The results from a series of experiments were examined, including (1) one-dimensional column experiments measuring the mass flux of TCE by flushing water to the point of near-complete dissolution (Imhoff et al., 1998), (2) a pilot-scale study of tetra-chloroethylene (PCE) remediation conducted at the Dover National Test Site (DNTS), and (3) a three-dimensional tank experiment conducted to mimic conditions in the pilot study. Both the pilot study and the tank experiment used a class of BBRTs (Hill et al., 2001; Johnson et al., 2004; Miller et al., 2000) to control the mobilization of DNAPL caused by surfactant flushing. The portions of the pilot-scale study of focus in this work are restricted to the PCE aspects of the study. Other aspects of this study, such as the brine portion of the study, are not of central importance to this work and will be reported elsewhere.
One-Dimensional Dissolution Experiments
Data collected from one-dimensional dissolution experiments described in detail by Imhoff et al. (1998) were used to determine mass transfer rates of TCE as a function of residual saturation. The media used in the one-dimensional column experiments in-cluded glass beads (GB), a mixed sand (MS), and a treated Wagner soil (WG). DNAPL saturations were computed by a mass balance approach based upon an integration of effluent data and neglecting sorption.
The experimental data from the column experiments were used to estimate the overall mass transfer rate, Kl, by assuming quasi-static conditions in the column and
solving the following standard one-dimensional advective-dispersive transport equation,
0 = Dh
2C aq x2 − q θa Caq x
+Kl θa
(Cs−Caq) (3.1)
whereCaq is the aqueous phase concentration,Cs is the aqueous phase solubility,Dh =
Dm +αlq/θa is the hydrodynamic dispersion coefficient, Dm is the effective molecular
diffusion coefficient, αl is the longitudinal dispersivity, q is the Darcy velocity, θa =
φ(1−sn) is the volumetric fraction of the aqueous phase, φ is the porosity, and sn
is the residual DNAPL saturation. Previous work for similar advective-dominated systems has shown that the inverse solution of Equation 3.1 forKl is insensitive to the
value of αl (Miller et al., 1990; Pan et al., 2007). In this analysis, αl was set to zero
and solved for Kl by rearranging the semi-infinite analytical solution to Equation 3.1
(van Genuchten and Alves, 1982).
Pilot-scale Study
Key differences between the pilot scale demonstration and previous BBRTs studies include: (1) contaminating the system with PCE instead of TCE and at much lower starting residual saturation, (2) using a new surfactant flushing solution, which was designed for PCE removal, and (3) applying the technology in a naturally heterogeneous porous medium. Because PCE was the selected DNAPL (ρ= 1.623 g/cm3), the density
contrast with CaBr2 brine (ρ = 1.70 g/cm3) was much lower than in previous work
using TCE (ρ= 1.46 g/cm3). Due to the change in DNAPL, a new surfactant mixture
was formulated that exhibited favorable phase behavior with PCE and with a higher tolerance for high concentration brine. The surfactant solution consisted of 1.425 wt % Aerosol MA-80, 1.575 wt % Triton X-100, 3.0 wt % isopropanol, and 1.55 wt % calcium chloride dihydrate. The purpose of the isopropanol was to promote destablization of macroemulsions that may lead to pore clogging, the salt lowered interfacial tension with PCE.
The pilot scale study was conducted at the DNTS in Dover, DE. The DNTS consists of a water table aquifer, the Columbia Formation, overlying an extensive clay formation, the Calvert Formation. The Columbia Formation forms a water table aquifer under the site that varies in depth beneath the ground surface from 11 to 14 m over the facility. It is comprised of fine to medium sands with occasional discontinuous clay and silt lenses. The vertically averaged hydraulic conductivity of the Columbia formation is 3 x 10⁻³
cm/s. The Calvert Formation consists of gray, firm, dense marine clays. This confining layer is approximately 6 m thick and has a hydraulic conductivity between 2 x 10⁻⁸
and 3 x 10⁻⁷ cm/s (ARA, 1996).
DNTS had designated areas, or test cells, in which permitted and contained DNAPL releases were conducted. Contaminant releases were contained by several mechanisms: double-walled sheet piles, maintenance of an inward hydraulic gradient between inner and outer barriers, and monitoring wells that were used to extract contaminants in the unlikely event of containment failure. The test cells were enclosed using double-walled sheet piles driven into the subsurface and keyed into a confining aquitard approximately 14 m below the surface (ARA, 1996). The confining aquitard and the sheet piles allowed controlled emplacement of brine similar to the laboratory-scale experiment.
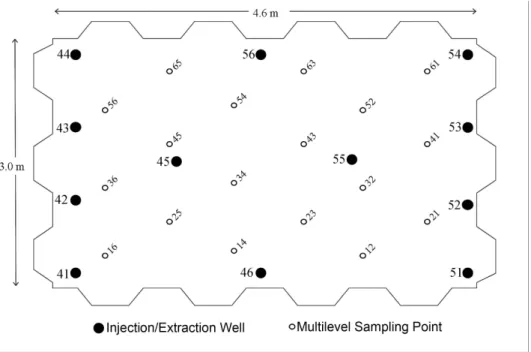
Figure 3.1: Dover Test Cell 3 layout.
of approximately 3.8 m at its maximum height with the water table at approximately 8.5 m below ground surface (bgs).
The DNTS cell was permitted to contain a maximum of 100 L. Site data from previous studies indicated that as much as 36 L of PCE might already be in the cell. However, the actual amount of PCE initially present is believed to be less due to losses through degradation and volatilization. Prior to the BBRTs study, the aqueous phase concentrations were measured for PCE and its degradation products as well as aqueous species introduced in flushing solutions from previous demonstrations, including sur-factants, cosolvents, and cyclodextrin. All of these species can serve as food sources for indigenous bacteria leading to degradation of PCE. Losses due to volatilization are also possible because the covered test cell was not airtight.
of 0.32. A pre-remediation sampling round from the cell’s multi-level samplers was conducted after PCE injection to establish the starting conditions. All samples were collected in 40 ml Environmental Protection Agency (EPA) volatile organic analysis vials with zero headspace and stored at 40◦C. Prior to analysis, samples were diluted at a 1:1 ratio with isopropyl alcohol to dissolve any DNAPL present and minimize volatilization losses. PCE and its daughter products were analyzed using HPLC with a method based on Field and Sawyer (2000).
Brine was injected just above the clay layer to achieve an in-place density of the aqueous phase that was greater than that of the PCE with an approximate thickness of 0.3 m. This equated to about a 0.15-m depth at the shallowest part of the clay-confining unit and approximately 1-m depth at the deepest part of the clay-confining unit. To mobilize PCE downward toward the brine barrier, approximately 0.54 PVs of surfactant were added to the cell near the top of the water table. Following the surfactant flush, the test cell was partially dewatered to the brine barrier at approximately 12 m bgs. The brine was removed by further dewatering and flushing with freshwater.
Vapor extraction began during brine removal to recover trapped DNAPL in the un-saturated zone and continued throughout the dewatering phase. After vapor extraction and brine barrier flushing, the water table was raised to 11 m bgs and post-remediation characterization was performed corresponding to the analyses conducted prior to re-mediation. A final sampling event from the cells multi-level samplers was conducted three months later and analyzed. It is important to note that during these sampling events no flow was induced through the cell. Therefore, the pilot-scale demonstration addresses changes in concentrations collected from multi-level samplers instead of mass flux.
Three-dimensional Tank Experiment
The three-dimensional tank experiment was designed to mimic the conditions in the pilot study. Specifically, key variables in the pilot-scale study were scaled down in accordance with the size of the laboratory experiment. The laboratory experiment differed from the pilot study in that radiolabeled PCE was used as the DNAPL. Further details of the tank experiment are provided below.
Table 3.1: Porous media properties for flux experiments.
Material d10 (mm) d50(mm) d60/d10 (-) Porosity (-)
Glass beads (GB) (Imhoff et al., 1998) 0.237 0.277 1.2 0.36 Mixed sand (MS) (Imhoff et al., 1998) 0.170 0.400 2.8 0.35 Wagner soil (WG) (Imhoff et al., 1998) 0.250 0.710 4.0 0.36
Dover sand (DS) 0.200 0.460 2.7 0.44
no diameter greater than 2 mm. Next, it was packed into the laboratory cell using a 21-layer heterogeneous packing based on a correlated random field model assuming anisotropic exponential covariance conditions and a log normal particle size distribu-tion (Christakos, 1992a; Deutsch and Journel, 1992). Each layer consisted of cubes of homogeneous sands obtained from the sieved fractions of 1.5-cm length and width and 1-cm height. Correlation lengths of 7.5 and 5.0 cm for the horizontal and vertical planes, respectively, were used to match the scale of the experiment. The mean and standard deviation of the sieved fractions were -0.7890 ln(mm) and 0.6326, respectively. Once the cell was packed, all ports were inserted, and the cell was sealed using a gasket-lined aluminum lid. Stainless steel tubing lined with heat shrunk Teflon tubing was used for all injection and extraction ports. The layout of the ports is shown in Figure 3.2, such that the injection ports have the prefix ”PCE” and the extraction ports have the prefix ”E”. The cell was vibrated to consolidate the media, checked for air-tightness and flushed with carbon dioxide. The cell was then saturated using the deepest ports by injecting de-aired deionized (DDI) water. Once air bubbles were removed from the medium, approximately 9.6 ml of 14C-labeled PCE (American Radiolabeled
Chemicals, St. Louis, MO) was injected into various ports located in the ninth layer from the bottom of the cell.
Prior to injection, the water table was dropped to just above the injection ports. Injection ports PCE-1, PCE-5, and PCE-6 each received approximately 1.3 ml of PCE. Ports labeled PCE-2, PCE-3, and PCE-4 received approximately 1.8 ml, 2 ml, and 1.85 ml, respectively, of PCE injected at a rate of 0.5 ml/min followed by approximately 2 ml of water to make sure PCE had cleared the tubing and entered the media.
Figure 3.2: Three dimensional laboratory tank for source-zone mass flux analysis.
of 4 ml/min. The resaturated cell was allowed to rest for 12 h to reach a quasi-static state.
Prior to remediating the system, the pre-remediation mass flux was determined. Specifically, DDI water was flushed across the cell using the four ports on the left side of the cell (B1-A, B1-B, B3-A, and B4-A) and collecting the effluent stream from the two corner ports on the right side of the cell (B2-A and B2-B). Effluent samples were collected until the mass flux approached steady state.