Yukun Yang. Friends or Foes: Understanding Communication and Interaction Patterns of Homogeneous and Cross-Cutting Spaces in Online Activism. A Master’s Paper for the M.S. in I.S degree. April, 2020. 119 pages. Advisor: Jaime Arguello
The understanding of people’s communication structure is crucial to answering the ongoing debates about whether social media is a “filter bubble”. Focusing on this topic, our work investigated people’s preference for homogeneous or cross-cutting
communications in an online activism setting, also the difference in language use and hyperlink use in different communications types. We used the tweets with #Silent Sam to classify communication types of user interactions. After the metric generation,
significance tests, and subgraph mining, we found that people are 15 times more likely to communicate with like-minded people. However, cross-cutting communications increase simultaneously with homogeneous ones when the activity level rises. Also, homogeneous communications significantly use more words related to perception, while cross-cutting ones have more words about cognition. We also unveiled the dark side of the cross-cutting communications as they are generally more toxic and aggressive. The use of outside links in the tweets is rare for both cross-cutting and homogeneous
communications. Nonetheless, the cross-cutting tweets embed more URLs while they direct to less diverse domains than the homogeneous ones. Left-leaning media sources with mixed to high factuality are linked as the outside source for mostly homogeneous interactions. Our work made contributions in the ways of providing the new methodology of subgraph mining to research about partisan sharing and rendering new insights to the research in online activism.
Headings:
Social Media
FRIENDS OR FOES: UNDERSTANDING COMMUNICATION AND INTERACTION PATTERNS OF HOMOGENEOUS AND CROSS-CUTTING SPACES IN ONLINE
ACTIVISM
by Yukun Yang
A Master’s paper submitted to the faculty of the School of Information and Library Science of the University of North Carolina at Chapel Hill
in partial fulfillment of the requirements for the degree of Master of Science in
Information Science.
Chapel Hill, North Carolina April 2020
Approved by
Table of Contents
Introduction ... 3
Literature Review ... 8
Social Media, Online Political Discussion and Cyberactivism ... 9
Cross-Cutting and Homogeneous Communication Spaces ... 16
Digital Traces for Social Media Research ... 19
Data & Method ...25
Background & Data Source ... 25
Data Collection, Sampling, & Annotation ... 28
Methods of Data Analysis ... 29
Machine Learning... 30
Metrics Generation ... 31
Significance Tests... 33
Social Network Analysis & Subgraph Mining ... 34
Data Analysis ...37
Standpoint Classification ... 37
N-gram Features ... 39
Document Embeddings ... 42
Word Embeddings ... 44
Final Tweets Classification Results & User Standpoint Assignment ... 46
Interaction Type Identification ... 49
Significance Tests... 52
Social Network Analysis ... 57
Linguistic & Argumentative Style Analysis ... 67
Linguistic Style Analysis ... 67
Argumentative Style Analysis ... 70
Hyperlinks Analysis ... 73
Discussion ...77
“Birds of A Feather Flock Together” Revisited: Homogeneous Interactions Dominate While Cross-Cutting Interactions Co-Exist ... 77
“Playing A Double Game”: Two-Faced and Inconsistent Language Use in Different Communication Types ... 86
“You Are What You Linked”: Left-Leaning and Credible News as the Primary Source for Evidence in Argumentation ... 94
Conclusion & Future Work ...96
Notes ...99
Bibliography ...100
Appendix ...110
Pseudo Code for Subgraph Counting ... 110
Introduction
people’s awareness of “legitimate rationales for opposing viewpoints and political
tolerance” (Lee, Kwak, and Campbell 2015; Price, Cappella, and Nir 2002). Dissents of
this idea, however, never subside. Scholars also point out the flip sides of cross-cutting communication spaces, as too many arguments would cause frustration and, thus dispirit people’s motivation for political engagement (Mutz 2006). On the other side, homogeneous
communication spaces are thought to be hazardous for democracy. The controversy is that stronger ties are more frequent in homogeneous networks. Strong ties could be a double-edged sword: Like-mindedness could give rise to stronger conviction because it could consolidate people’s political beliefs (Mutz 2006; Price et al. 2002), which is healthy for
community building and development, but at the same time it could serve as a tool for excessive reinforcement of a certain belief and cultivate political extremists (Sunstein 2001).
are mixed and layered: Both communication spaces are thriving in social media (An et al. 2019).
Research about online activism and the two types of communication patterns are not communicated well by scholars. On one side, although the research on online activism, cyberactivism, and OPP profuse, the microscopical study of online activists’
communication patterns and structures are under further investigation. On the other side, from the perspective of selective exposure or partisan sharing, research in this realm suffers from the same lack of formal research. Most studies in this topic are big-picture and macroscopic—few of them focus on specific forms of online political participation, for example, cyberactivism. Also, the study of cross-cutting and homogeneous communication spaces is talking about the effects and reasons in general. The study meticulously examines how people interact in different communication spaces is still in default. As a result, relevant studies about virtual communications, have been focusing on the “what” and “why” questions: What are homogeneous and cross-cutting communication spaces and the
reasons behind their existence? However, the “how” questions, how people behave in heterogeneous and homogeneous environments, need more nuanced study.
Because the focus of this research is apropos to social media, user-generated content (UGC) and digital traces are utilized as they are the first-hand material to observe people’s communication and interaction patterns. While the user-generated content, the
text of tweets, is indispensable for understanding the argument the online, digital traces, “the evidence of human and human-like activity” (Howison, Wiggins, and Crowston 2011), the metadata of the human activity, could yield insights about how people participate online and how they interact with each other. In this research, the UGC is an ideal analyzing material for people’s linguistic patterns and language use. Those patterns include their utterance in different language levels, namely the vocabulary level, sentence level, and the semantic level. By the same token, digital traces are be used for participation types analysis considering this research’s focus - communication and interaction are at the
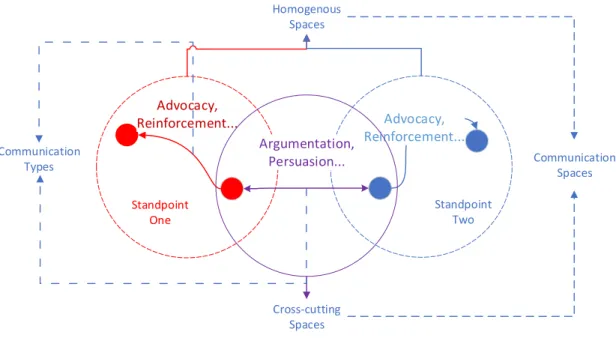
heart of participation. Specifically, we follow the previous analysis of participation types, computing whether friends interact more or foes argue more. In addition, in the online conversation of activism, people will use evidence to support or rebuke ideas. In this research, we assume the outside links, such as news, videos, and pictures are the evidence for an argument. Therefore, with the availability of UGC and digital traces, it will try to answer these questions based on the abstract communication spaces shown in Figure 1. 1. Is there a significant difference between people’s preference to have homogeneous
communications or cross-cutting communications? Are people more inclined to advocate their “friends” or to argue with their “foes”?
argumentation patterns show a significant difference when people talk to their “friends” and communicate with their “foes”?
3. Is there a significant difference in the use of outside links as evidence when people have homogeneous communications and cross-cutting communications? Do people in homogeneous spaces use outside links more often to advocate their “friends” or people in cross-cutting spaces use them more to argue with their “foes”? Are the outside links they use toward “friends” different from the ones used towards “foes”?
This paper would develop in the following chapters. First, a literature review would be presented to identify the current research progress of relevant topics addressed in this paper. Methodology, data collection, and pre-processing would address the specific methods that would be used in this research also the dataset concerning the actual online activism event being examined and investigated.
Advocacy, Reinforcement...
Argumentation, Persuasion...
Advocacy, Reinforcement...
Standpoint Two Standpoint
One
Homogenous Spaces
Cross-cutting Spaces
Communication Spaces Communication
Types
Literature Review
The literature review chapter focuses on three key component topics apropos to this research. First of all, the context of this research falls into the realm of online political discussion and participation on social media, such as online activism and cyberactivism. On top of that, we also want to review the literature about the cross-cutting communications and the homogeneous communications, which are decided based on the contradiction or the confirmation of people’s viewpoints. In the end, we would cast our sight on the digital traces, user-generated content specifically for social media research, since they are the two available kinds of data on social media platforms and will be useful for this research. In the end, we summarize these current research progress and try to identify the gaps in these three realms of research, serving as for the originality for this research.
Relevant research articles were retrieved by using academic databases, such as EBSCO, Springer, and Sage. Keywords used for searching are “cross-cutting”, “homogeneous”, “social media”, “online activism”, “digital activism”, “cyberactivism”,
“political participation”, “digital traces” and others. Boolean operators were adopted for
Social Media, Online Political Discussion and Cyberactivism
Definitions for social media has been uttered by multiple scholars and one of the earliest and classic ones is from Kaplan and Haenlein: “Social Media is a group of
Internet-based applications that build on the ideological and technological foundations of Web 2.0, and that allow the creation and exchange of User Generated Content” (Kaplan and Haenlein 2010). This definition points out that social media is not a completely new concept popping out to the public’s eyesight from nowhere – it has its foundation, Web 2.0. In more recent
research, the detailed breakdown of the conception of social media has been proposed. “Social media are Internet-based channels that allow users to opportunistically interact and
selectively self-present, either in real-time or asynchronously, with both broad and narrow audiences who derive value from user-generated content and the perception of interaction with others” (Carr and Hayes 2015). In this definition, the activities have been more clearly
web-services that not only focus on personal interaction but also put emphasis on community formation and building, which echoes with our research focuses on the group division and interaction on social media in the online activism context. Adopting this idea, we are more interested in the community or group dynamics within the web-service that people could create, co-create, modify, share and engage with other people in the different or same community, as the political discussion on social media often are community-based and partisan orientated.
The idea of online political participation stems from the idea of traditional political participation. One classical definition of political participation refers to “the activity by
ordinary citizens that has the intent or effect of influencing political outcomes such as policies and government action” (Verba et al., 1995). In their literature, several types of political participation have also been identified, such as voting, campaign activities, and other organizational or collective activities (Verba et al., 1995). Basically, this concept mainly focuses on the interaction of citizens and government. Nonetheless, the connotation of political participation has been extended to other aspects of life by other scholars followingly. For example, local community engagement and local democratic processes (McLeod, Scheufele, and Moy 1999) have also been included in the discussion of political engagement. They can not only direct towards to government but also other institutions or organizations that are more informal and comprehensive. In summary, the political participation we refer to in this research talks about “activity by ordinary citizens that has
the intent or effect of influencing government action or some political outcomes”
While the traditional definition of political participation primarily discusses people’s political engagement, the virtual platforms for political engagement have emerged
that acquaintances or a stranger online could have a huge impact on interpersonal interactions (Granovetter 1973). They prove that the larger online networks and weak-tie discussion existing on the internet promotes people for online political engagement.
Research about participation in online political discussions has been approached from different perspectives. Some have examined the role of social media’s relationship
between political opinion expression, especially expressive political participation, “a form of political participation that entails the public expression of political orientations” and civic engagement (Rojas and Puig‐i‐Abril 2009). Not only the public using social media to connect with the government, but government officials also participate in politics by using social media. For example, some scholars used the Liberal Democracy model to examine the twitter use of Parliament Representatives and find that the main purpose is to “disseminate information to electors and provide information on ongoing activities to the
audience”(ebø 2011). Others also find that people using social media could be an indirect way, a leveler, for political engagement (Holt et al. 2013).
function for inspiration. While the opinions of the definition of cyberactivism divided from one scholar to another but they all converge to one shared space: the usage of Internet communication technologies for different forms of activism. In this research, we also want to focus on this character of digital activism and the emphasis Langman has put forward. We want to look at the online activism in the general sense—the activism that involves using ICT as a channel—but also we want to specifically narrow down the activism that is more active, given the situation that much online activism is only slacktivism (Rotman et al. 2011) since some people only contribute click effort in the event.
a key factor in political behaviors (Dalton, Sickle, and Weldon 2010). Social media use also greatly increases the odds that a respondent actually attended the offline protests, which echoes with the research about social media lowering the cost of online political participation (Tufekci and Wilson 2012). Social media is considered to play a significant role in facilitating the mobilization and coordination of direct actions offline, as social media’s nature of rapid and abound information dissemination (Gillan 2009). It is also argued that online networks “entail greater exposure to weak ties than offline networks”;
thus, the opportunities to exchange opinions with other people online are increased (Gil de Zúñiga and Valenzuela 2011). This feature also considered a bonus for the thrives of online activism.
Despite considering social media as a supportive tool for online activism as the research listed above, questioning voices are also sound. The sharing feature of social media, which leads to the transparency and deems to contribute to democracy of root grass people’s activism, is being questioned. Some researchers think social media, instead of
Mallat 2014). Sometimes, online activism would also be influenced by negative information intentionally produced by other parties. The negative information or distorted information is believed to hurt activism organization's public image and further, being hazardous to the activism itself. Barring the sharing features that are considered as a double-edged sword, the low cost of digital activism is also being interrogated. Despite providing equal opportunities for people to participate in activism, the digital divide could counter that benefits. This factor has been confirmed by other research, which points out the observation of wide disparities in online activism among the working class and the upper or middle class (Schradie 2018). Digital activism is costly for working-class for “organizational resources, individual disparities in access, skills, empowerment and time”
(Schradie 2018). It could also apply to other marginalized populations who do not have internet access or internet using habit, for example, people in under-developing areas and elderly people. Other conceptual concerns on how technologies can contribute to social ills include violent escalation of conflicts and the political polarization (Garrett 2006).
bloggers and finds that the discussion oozed deliberate characters which have featured as a disparity of discussion, emphasis on non-substantive issues, and unconstructive engagement between bloggers (Koop and Jansen 2009), which diminishes the real political engagement and democracy.
Cross-Cutting and Homogeneous Communication Spaces
From the last section of the literature review, we understand how social media takes a progressively significant role in promoting political discussions and online activism. It is reasonable to imagine that the information convivence and abundance would further increase the odds that people coming across new ideas and differences of opinion or the ideas of the same kind.
On one hand, people are more likely to be exposed to the content of their own interests, due to the current high-choice climate that provides better compatibility between the exogenous desires of consumers and their media content. Political content is not an exception and thus the idea of political homophily should be brought about. Usually, individuals with common characteristics are more likely to associate with one another than pairs of individuals with disparate characters. This phenomenon comes to be known as homophily, and this applies to many different situations, including racial identity, gender, age, religion, and education (McPherson, Smith-Lovin, and Cook 2001). Political homophily relates to the same kind of tendency of people coming together because of the same political preferences. It has been attested that homophily is crucial for interpersonal relationships, for example, friendship or marriage (Huber and Malhotra 2016).
media can promote people’s access to politically dissonant communications (Lee et al. 2015). Especially, when online networks are compared to the offline congregation and offline activism, online networks are thought to be more politically diverse (Lee et al. 2015). This could be related to the idea of political disagreement.
Many discussions about political homophily and political disagreement have been put forward in terms of the effects on the social environment from the scholarship of political science. It is believed that the cross-cutting environment provides an important chance to maintain a democratic society (Barber and Barber 1984). It is a crucial agent for deliberative democracy since it promotes people’s awareness of “legitimate rationales for
opposing viewpoints and political tolerance” (Lee et al. 2015; Price et al. 2002). However, scholars also point out the side-effects of having cross-cutting communication spaces because they would dispirit people’s motivation for political engagement (Mutz 2006). In Mutz’s ideal political discussion and political engagement environment, the environment
should be homogeneous so everyone is encouraged to speak and participate. On the other side, homogeneous communication spaces are thought to be a threat to democracy. Stronger ties are said to be the culprit, as they are more frequent in homogeneous networks; it could serve as a tool for reinforcement of a certain belief and cultivate political extremists (Sunstein 2001). In the meantime, like-mindedness could give rise to stronger conviction, because it could consolidate people’s political beliefs (Mutz 2006; Price et al. 2002).
place online communities thrive, social media is designed to fostering diverse and wholesome information sharing circles. In this kind of circumstances, researches do observe that the division of groups of people is widened and augmented due to social media’s hallmark as “echo chambers” or “filter bubbles”(Flaxman et al. 2016). Due to the
complexity of the social media, many scholars keep the unfounded view that social media is homogeneous and cross-cutting in space (Boxell, Gentzkow, and Shapiro 2017; Heatherly et al. 2017). It's more likely to think the truth is more subtle and nuanced because both cross-cutting and homogeneous communications on social media are blended and complicated. For example, An et al’s research (2019) thinks that both communication spaces are thriving in social media (2019). Other research also suggests that both the public sphere and the echo chamber situation are potentially co-existing on Facebook (Batorski and Grzywińska 2018).
While some studies focus on the platform level questions, the others focus more on the users’ characters. Although like-minded discussions are positively related to online participation, discussions with people who are not of the same kind correlate negatively with it (Valenzuela, Kim, and Gil de Zúñiga 2012). In general, Democrats exhibit higher levels of political homophily, but Republicans who follow official Republican accounts exhibit higher levels of homophily than Democrats (Colleoni, Rozza, and Arvidsson 2014). Researchers also find that Twitter users are unlikely to be exposed to cross‐ideological content from the clusters of users they followed, as these were usually politically homogeneous (Himelboim et al. 2013).
discussions, the disagreements make them more open to political persuasion, since political disagreement may make people more ambivalent (Zúñiga, Barnidge, and Diehl 2018). Other language patterns and linguistic features are not shown in the relevant research, which gives us opportunities to explore people’s language use differences.
As has been investigated above, we found the discussion of cross-cutting and homogeneous discussions has been put forward for a long time and the topics mainly focus on the rationale and the effects. From the level of research, we find that the platform level and user level research are extant. However, more research is still needed in regard to the activism context. Also, there is a want for discussion-level research: what they are talking about in different kinds of discussions and their traits. These gaps are the inspirations for our research and will be explored in this paper in the following chapters.
Digital Traces for Social Media Research
In this section, we try to ground on the research on the communication patterns in the online activism context. We talked about what social media could provide us for research. Also, other specifications on the computational methods for politics and information science research were reviewed here.
The first notion we want to focus on is the digital traces. Digital traces are the primary resources we will have to conduct the research about social media. The definition of digital traces has been discussed by different scholars since the importance of it being recognized. In general, digital traces are “records of activity undertaken through an online
information system” (Howison et al. 2011) —they document the activities humans
(Freelon 2014). For the definitions mentioned above, the characteristics of digital traces are focused on its function, a record or document, its content, evidence for human activity, and its nature of interaction with systems.
More discussions about the features of digital traces have been put forward as well. Digital trace data are found data, which means it is an activity by-product rather than a designed research tool (Howison et al. 2011). This character of digital traces is also confirmed by other scholar’s definitions since they think digital traces are “largely in the
form of content “left behind” as a result of users’ activities online” (Milan 2018). It is also
event-based, which is the opposite of summary-based (Howison et al. 2011). This feature of digital trace requires researchers to infer the relationships and implications of the data, for example, combing different digital traces to find trends and pheromones that stand out. Also, it is usually longitudinal, since its event background could take over in a period of time (Howison et al. 2011).
longitudinal nature makes it possible to transform the data for temporal and chronological research. Considering that online activism also develops within a certain period of time, using the digital trace data for research fits for the developing, evolving and growing nature of activism.
Distinguishing between different types of digital trace data is essential for understanding digital trace data itself and its potential value. Specifically, digital traces would be divided into different levels of categories. From the micro perspective, digital traces could be “Likes, shares, check-ins, selfies, and other forms of expressivity,
activity (An et al. 2019). We will likely use both kinds of digital traces in our research, the user-generated content will be useful for question 2, and the metadata could be utilized for question 1 and 3.
Using digital traces for social media research about politics has been heated since recent years. Deducing people’s political opinions or their attentions to politics are assisted by digital traces (Jungherr et al. 2017). Some papers even use social media’s digital traces for election prediction, given the assumption that digital traces could yield authentic public opinions (Anstead and O’Loughlin 2015; Jungherr, Schoen, and Jürgens 2016). Not only digital traces have been used to understand public opinions, but some other research also studies how public opinions are manipulated by analyzing digital traces (Badawy, Ferrara, and Lerman 2018). Digital practices are also studied by scholars in regards to questions about how social media activism unfold political participation and political data flows’
importance (Barassi 2016). It is also argued by other scholars that digital practices by using digital traces are used by social activists to structure and modify their interactions (Milan 2018). As previous studies have demonstrated, digital traces can illustratively be used to analyze political engagement and will be used extensively as data points in our research about online activism.
One important digital traces of social media data are hashtags. We, therefore, discuss another concept we want to follow: the “hashtag activism”. Hashtag activism is the
“act of fighting for or supporting a cause with the use of hashtags as the primary channel
conversation within this platform. Therefore, any topic on Twitter could be attached to their hashtags just as a simple topic identifier. Hashtags associated with activism not only have the general usage of the hashtag, but it also has its specialty for political discussion. We will look at how hashtag functions in general ways and for online activism in the following paragraph.
From the technical side, the hashtag is an index system. Some examined its index function in both the “clerical sense” and “semiotic sense” (Bonilla and Rosa 2015). In the
clerical sense, it allows information about a specific topic to be ordered and retrieved quickly, while in the semiotic sense hashtag could foreground the intended meaning of an expression that would otherwise not special (Bonilla and Rosa 2015). Also, it is argued that hashtags have the potential to gather a broad range of tweets no matter the relationship between each tweet users (Bonilla and Rosa 2015). From the rhetoric side, the hashtag could give rise to “narrative agency, the ability to create social media stories through the
use of hashtags in a manner that is collaborative and widely acknowledged (Yang 2016), which can further invoke “context, histories, emotions, or calls to action” (Moscato 2016).
From the information and knowledge management side, the hashtag enables information dissemination categorizing posts across specific topics. Also, activism organizations can use hashtags to locate tweets on the same subject and support others to find tweets, therefore, accumulate the knowledge created by the users (Guo and Saxton 2014). Overall, we deem hashtags very important to online activism so we also focus on tracking the hashtags in online activisms.
while users would participate in discussions about social and political issues on social media by interacting with hashtagged content, such as commenting, liking, and sharing (Yang 2016). Some articles have already tracked the evolution of a political event for its function of organizing information around specific topics or events on Twitter (Small 2011). This demonstrates the possibility of using the hashtag for activism data collection and analysis.
Data & Method
In this section, we describe the data sources and analysis techniques used to conduct this research.
Background & Data Source
concern about social justice or other aspects of society. For example, following revelations of widespread sexual harassment and assault by Hollywood producer Harvey Weinstein, the #MeToo hashtag became popular in 2017 and continued to be used with considerable intensity (Monica et al. 2018). Another influential example would be the “BlackLivesMatter”, which emerged on twitter and became trendy after George
Zimmerman's acquittal in Trayvon Martin's shooting death (Monica et al. 2018). Overall, Twitter has shown its nature as a good platform for observing online activism, no matter from the theoretical side or the practical side; therefore, it was chosen as the social media data platform that we want to investigate.
We used this event as a good example of online activism. First, the hashtag use of Silent Sam has been echoing with the ups and downs of the protest, in reality, for example, the number of tweets exploded right after the statue was taken down in August. This alignment with the offline activism progress could provide us with a decent size of the dataset for analysis. Second, as a known activism event, many of the messages affiliated with this hashtag are available to the public without limitations on anonymity and were easily accessible, which ensures the representativeness of the research.
Data Collection, Sampling, & Annotation
The dataset for analysis was collected mainly from three resources. First of all, there is an existing dataset available for use. The Principal Investigator of Digital Innovation Lab at UNC, Professor Dan Anderson has been collecting the tweets of hashtag Silent Sam since 2016 using an automated Tweet scrapper called TAGS1. TAGS uses the
Twitter API for tweet collection and user information collection. As an all-in-one data scraping tool, it could provide a structured, clean, and ready-to-use data source. For now, we have collected the tweets with the hashtag #SilentSam and the user information from January 2016 to February 2019. Around 50,000 tweets are available for use. We further collected data from two other scrappers: Orgneat2 and GetOldTweets3. The two yielded
similar results and together returned 12,698 tweets. We merged them with the TAGS dataset, removed the duplicated tweets, and ended up with a new comprehensive dataset with 61,039 tweets.
We also recognized the limitation of this data collection. As these tools all utilize the official API from twitter for scraping, it could only retrieve approximately 10% of the total tweets. The escalation of the Silent Sam event in August 2018 might produce more tweets than other time periods. However, we think the tool limitation here would only twist the distribution of the tweets but not introduce much bias since the scrapper always retrieves tweets in a random way.
comprehensive dataset. We further sampled 10% of the original tweets with the random seed of 2020. The sampled 1561 tweets with original words were then annotated separately by two annotators. Each tweet was be assigned with one label, “A”, “N”, or “F”, which indicates the standpoint of a tweet being Against, Neutral or For-Silent Sam. For example, tweets with the “A” label are likely to express their opinions of taking down the Silent Sam for it is a symbol of racism. F-labeled tweets might be the opposite of A-labeled tweets, mainly stating more conservative opinions with historical concerns. The N-labeled tweets are most likely to be reports or restatements of the activism issue without strong opinions. The confidence of each annotation was also recorded for selecting records for training. We filtered out the annotation that has zero confidence level on from either of the annotators. After this, we had a subset of the annotation dataset of 1,181 tweets. The inter-rater agreement between two annotators on this subset reached 71.9%, which is an acceptable number for training.
Methods of Data Analysis
Machine Learning
Machine learning includes designing algorithms that allow trends and patterns to be recognized and intelligent decisions based on empirical data-driven evidence. It has been extensively used over the past decades to solve complex problems in various research fields such as speech recognition, computer vision, and text mining. The power of machine learning depends on its ability to learn through training data. We used machine learning algorithms in our data sample to automatically detect political content in tweets and therefore differentiate tweets by their classified standpoints. Using the training data, a supervised learning algorithm assumes a mathematical model that can be used to map new data. The training data comprises a corpus of text already labeled as “A”, “N” or “F”. Then
the learning tasks came in two separates parts. The first part is used to "arm" the algorithm for classification. The second part is used to test the ability to properly identify unknown labeled samples and thus to evaluate the algorithm.
The training data is composed of different features to be feed to the algorithm. Generally, when running a machine learning task, one big question is to find the best feature representation for the data. The details about feature generations are explained in the Data Analysis section.
performance. Possible candidates for the classifiers could be learned from relevant research, where we found algorithms like Support Vector Machines algorithm, K-nearest neighbor algorithm, Logistic Regression, Decision Trees algorithm, Association rule-based algorithm, Boosting algorithm, and Naïve Bayes classifier algorithm has been used inventively in Twitter classifications (Alabdullatif, Shahzad, and Alwagait 2016).
The classification was conducted on the tweet level. We opted not to conduct on the user level because we understand that people’s standpoints are volatile. They could
change their viewpoint and tweet from different standpoints. If we mix them together, it would be unhelpful for us to get an accurate standpoint since the document is mixed with different texts that supposed to have different labels. We first predicted the tweet’s standpoint and then grouped the tweets by the users. Next, since we want to know one user who has tweeted in this hashtag is against or for the Silent Sam issue, we averaged the standpoints of all his or her tweets, so we ended up with a continuous number, not a categorical value, for the user standpoint. The technical details about these steps are elaborated in the Data Analysis chapter as well.
Metrics Generation
Based on the result of the matching learning algorithm classification results, a set of metrics addressing different research questions were computed and derived. The metrics we derived would be divided into the linguistic style, argumentation patterns, and hyperlinks.
Linguistic style is defined as the manner or style in which a person communicates in our research. Studies about linguistic style reveal that “it not only reveals one’s
(Pennebaker 2011). In order to find the differences in linguistic style, we used the Linguistic Inquiry and Word Count (LIWC) (Pennebaker, Francis, and Booth 2001), which has been utilized as a tool for linguistic style for many studies on text analysis, for example, the differences in linguistic style among U.S. presidential candidates (Slatcher et al. 2007), and supporter of different presidential candidates (An et al. 2019).
We addressed the argumentation patterns by using the following features generated from perspective API4, which is created by Jigsaw and Google’s Counter Abuse
Technology team in a collaborative research project called Conversation-AI. The models and their features are explained as follows:
Seven features from the Toxicity model were selected in our research:
1. Toxicity. Rude, disrespectful, or unreasonable comment that is likely to make people leave a discussion.
2. Severe Toxicity. A very hateful, aggressive, disrespectful comment or otherwise very likely to make a user leave a discussion or give up on sharing their perspective.
3. Identity Threat. Negative or hateful comments targeting someone because of their identity.
4. Insult. Insulting, inflammatory, or negative comments towards a person or a group of people.
5. Profanity. Swear words, curse words, or other obscene or profane languages.
6. Threat. Describes an intention to inflict pain, injury, or violence against an individual or group.
For understanding the third question, we summarized what kinds of websites are referred to in the tweets by different group members. We used the pydomain5 package in
python to get the category for the domain. This tool uses a Long-Short-Term Memory (LSTM) model with a published domain dataset to predict the category of a domain.
In addition, as news and media resources are frequently being referenced in the tweets, we also gathered media credibility and political leaning dataset to see the difference of media source usage between different groups.
Significance Tests
Significance tests were conducted to show whether the observed differences are not incidental if any. Considering the distribution of social media data, we chose to use non-parametric statistical tests, a.k.a. distribution-free tests because they are based on fewer assumptions on the distribution. Sign Test (Dixon and Mood 1946) or Mann‐Whitney U Test (Nachar 2008) were chosen to examine whether the metric of one of two groups or is different from the other that is not caused by incidence. This could help us answer the research questions: whether people put on colored glasses when they interact with people with the same or different opinions.
Social Network Analysis & Subgraph Mining
Considering the nature of twitter interactions and communications are intrinsically networks, we also adopted the approach of social network analysis and subgraph mining. Using this method, we want to focus on the triads, which are subgraphs formed by three nodes. Triadic closure is an important topic in the network analysis realm. The triadic closure is often called the “strength of weak ties”, which means that two individuals with
strong social relationships with a common third individual are likely to have a social relationship with each other (Granovetter 1973). It has a very important implication for the transitivity of the network and its local structure (Anon 2015). We want to see if user standpoints would actually influence the creation of triplets locally, and therefore influence the network structure globally.
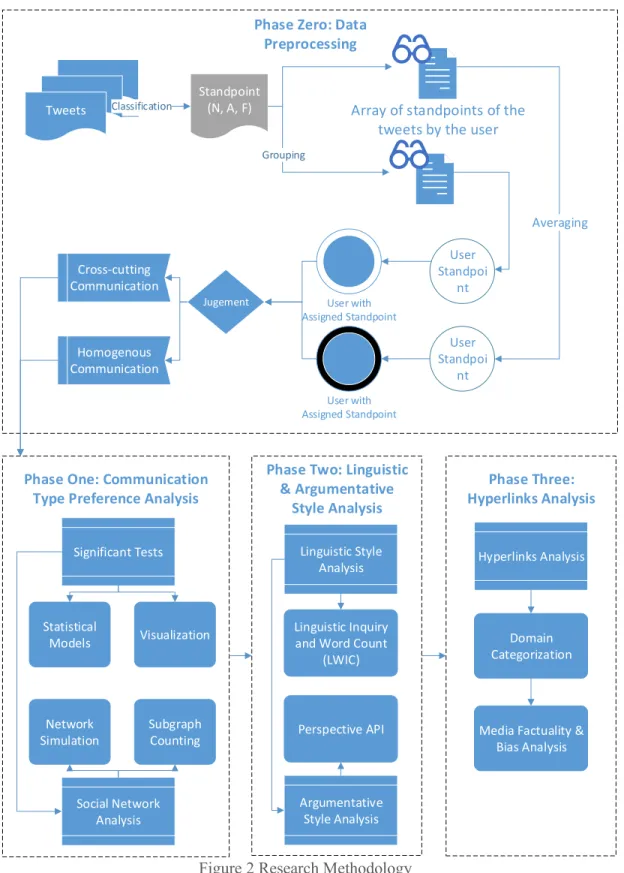
In summary, we condensed our overall methodology in this flow chart shown in Figure 2 Research Methodology. There are in total of four phases in this work. The goal of the first phase is to obtain the standpoints of the users and the communication type of their interactions using machine learning techniques. The first phase focuses on answering the first question using significance tests and social network analysis. The second phase would answer the second question about the language use difference between groups and we used metrics generation tools and significance tests. In the third phase, we also used the metric generation tools for testing.
Tweets
Standpoint (N, A, F)
Jugement Cross-cutting Communication Homogenous Communication Hyperlinks Analysis Domain Categorization
Media Factuality & Bias Analysis User with Assigned Standpoint User with Assigned Standpoint Grouping
Array of standpoints of the tweets by the user
User Standpoi nt User Standpoi nt Averaging
Phase Zero: Data Preprocessing Significant Tests Social Network Analysis Visualization Statistical Models Network Simulation Subgraph Counting Linguistic Style Analysis Argumentative Style Analysis Linguistic Inquiry and Word Count
(LWIC)
Perspective API
Classification
Phase One: Communication Type Preference Analysis
Phase Two: Linguistic & Argumentative
Style Analysis
Phase Three: Hyperlinks Analysis
Data Analysis
We layout the procedures and the results using the data and the methods we introduced in the previous chapter. Overall, we have five major sections for the data analysis. The first two are the classification and the identification of the standpoint for tweets and users, and the communication type for the interactions. The result of these two stages are used for the following three stages corresponding to our three research questions. We next conduct a communication type preference analysis for users using significance tests and network analysis. Also, we further investigate the difference in language used by these two different kinds of communication. Lastly, we analyze how people use outside links in their tweets when they are in homogeneous communications and cross-cutting communications.
Standpoint Classification
multiple spaces with single spaces within the strings. In the end, we had all the words lowercased and lemmatized.
To achieve the best classification result, we tried different feature generation methods and different classifiers and then evaluated their performance. The classifiers we used here were Logistic Regression and Neural Network. The first one is a popular linear classifier while the latter one is often used for deep learning. We also used accuracy as our evaluation metric, which is simply just the ratio of corrected predictions to the total number of the samples.
𝐴𝑐𝑐𝑢𝑟𝑎𝑐𝑦 = 𝐶𝑜𝑟𝑟𝑒𝑐𝑡 𝑃𝑟𝑒𝑑𝑖𝑐𝑡𝑖𝑜𝑛 𝐴𝑙𝑙 𝑃𝑟𝑒𝑑𝑖𝑐𝑡𝑖𝑜𝑛
We chose to use accuracy as the evaluation metric because our goal is to assign the right class for each tweet and the cost of each wrong prediction, no matter it is wrongly predicted as “A” or “N”, weighted the same. Therefore, we did not need to penalize false
positive or false negative differently. In this scenario, we can just use accuracy as the metric to evaluate the model performance.
For the evaluation methods, we used the 10-fold cross-validation (CV) for all classification tasks. For some tasks, we also used hold-out validation with the training-validating set ratio of 8:2.
A baseline was set for comparing the model performance of each trial. Here our baseline was defined as the accuracy when we always predicted the majority of the class for each tweet, which is “N”. This baseline could reach an accuracy of 0.657. The processes
N-gram Features
An n-gram is a sequence of N words (Manning and Schütze 1999). For example, a bigram is a sequence of two words. Using the n-gram model, we can have the whole text corpus divided into a set of a sequence of N words. Usually, bigger N would learn more about a specific instance because it contains more contextual information, while smaller n would be more reliable since it generates more features for training data. Considering the nature of the tweet, a small text document that has at most 140 words. We tried the smaller N because bigger N would drastically decrease our training features. In the end, we tried different N ranging from one to three.
The feature representations are also important. In addition to just using the word counts of each n-gram, we also tried TF-IDF representation, short for term
frequency-inverse document frequency. The TF-IDF value is calculated as 𝑡𝑓𝑖,𝑗× 𝑙𝑜𝑔 ( 𝑁
𝑑𝑓𝑖), where 𝑡𝑓𝑖,𝑗 is the number of occurrences of I in document j, 𝑑𝑓𝑖 is the number of documents that
contain I, and N is the total number of documents. Using TF-IDF would highlight the important words in the tweets that specifically associate with a document. Using this representation, we could decrease the influence of stop words and assign high values to the distinctive words of each class of the documents.
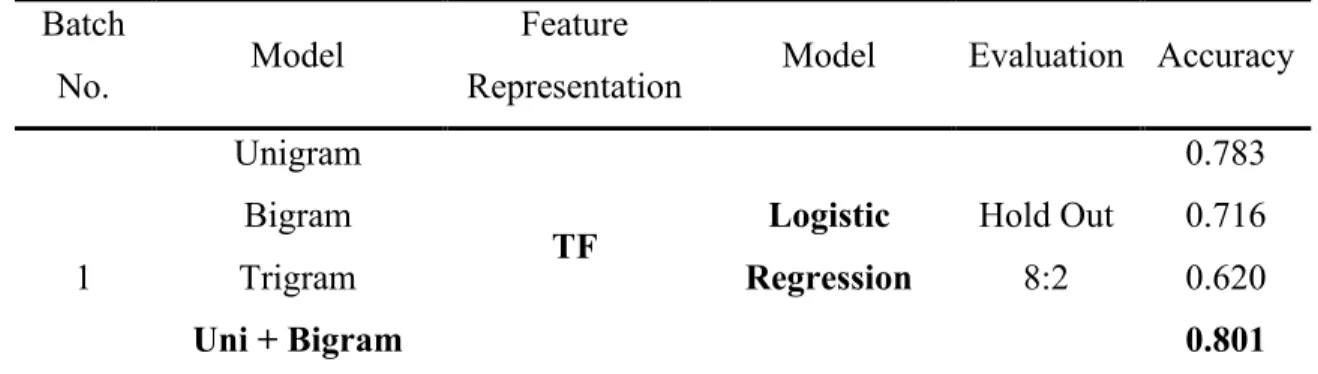
Table 1 Classification Results of N-gram Models
Batch
No. Model
Feature
Representation Model Evaluation Accuracy Unigram
TF Logistic
Regression
Hold Out 8:2
0.783
1
Bigram 0.716
Trigram 0.620
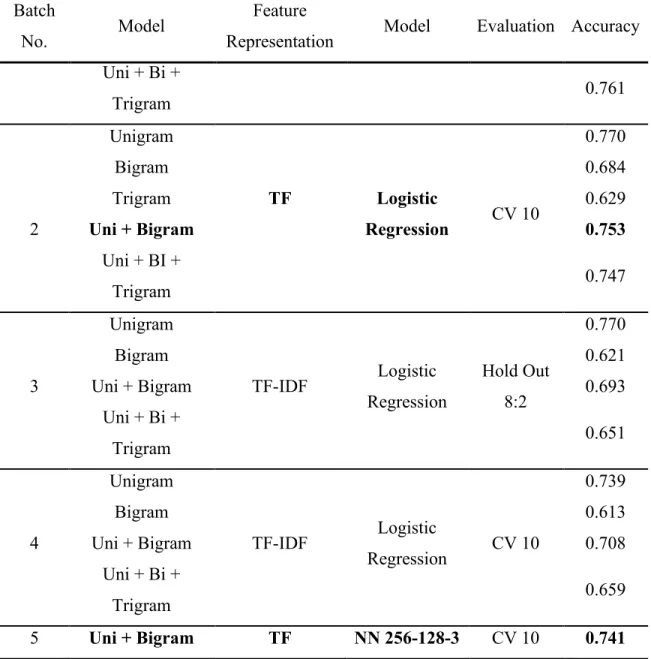
Batch
No. Model
Feature
Representation Model Evaluation Accuracy Uni + Bi +
Trigram 0.761
Unigram
Logistic
Regression CV 10
0.770
2
Bigram 0.684
Trigram TF 0.629
Uni + Bigram 0.753
Uni + BI +
Trigram 0.747
3
Unigram
TF-IDF Logistic Regression
Hold Out 8:2
0.770
Bigram 0.621
Uni + Bigram 0.693
Uni + Bi +
Trigram 0.651
4
Unigram
TF-IDF Logistic
Regression CV 10
0.739
Bigram 0.613
Uni + Bigram 0.708
Uni + Bi +
Trigram 0.659
5 Uni + Bigram TF NN 256-128-3 CV 10 0.741
amount of predictive power. From the first two batches of trials, we also observed that the trigram model alone did not add much to the classification, both in the cross-validation and the hold-out tests. Therefore, we did not build the model using solely trigram features when using the TF-IDF features.
The third and fourth batch of experiments using TF-IDF features did not improve the accuracy. The trials using hold-out evaluation only reaches the accuracy level of the second batch. The fourth batch using cross-validation for the evaluation turned out to be the worst performance batch of the first four ones. It is also worth noting that using TF-IDF features, the best model performance is the models trained with simple unigram models.
After the trials, we decided to use the unigram and bigram word count features to train a neural network. While theoretically, TF-IDF features are more suitable than just word counts, our experiment result actually favors the model fed with just word count features, so we just used the word count as feature representation. In terms of model choice, compared with another highly performed model, the unigram model, the unigram and bigram model generated more features and contained more contextual information while the simple unigram model might likely have over-fitting issues, so we chose to use the unigram and bigram word count features.
Document Embeddings
Although the N-gram model is among the most common and efficient ways for document feature representations, it has two main deficiencies: the loss of the order of the word and the semantics (Le and Mikolov 2014). To cope with these flaws in using N-gram models, one common approach is to embed the documents on a vector space, so each document would be a vector. This document embedding has been tested to improve the predictive performance, especially on capturing the semantics of the texts (Lau and Baldwin 2016). Here we also used this approach to classify the tweets. There are two main kinds of doc2vec model implementation, one is the distributed bag of words (DBOW) model and the other one is the distributed memory (DM) model. The former one is analogous to the Skip-Gram model used for Word2Vec, which basically uses the document to classify entire words in the document; while the latter one is inspired by the Continuous Bag of Words model used for Word2Vec, where it fundamentally just tries to predict a center word based the words surrounding the center word, and the full document vector (Le and Mikolov 2014).
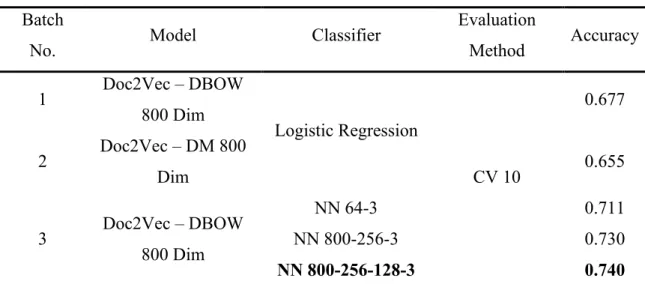
Table 2 Results from Doc2Vec Models
Batch
No. Model Classifier
Evaluation
Method Accuracy
1 Doc2Vec – DBOW
800 Dim
Logistic Regression
CV 10
0.677
2 Doc2Vec – DM 800
Dim 0.655
3 Doc2Vec – DBOW
800 Dim
NN 64-3 0.711
NN 800-256-3 0.730
NN 800-256-128-3 0.740
The results using Doc2Vec features are shown in Table 2. In the first batch of trails, we used the Distributed Bag of Words Model to generate features for a Logistic Regression classifier. The 10-fold cross-validation returned the accuracy of 0.677, which is just slightly higher than our benchmark of the accuracy of 0.657. The results from the Distributed Memory model are even worse, with a lower accuracy of 0.655, which is lower than the benchmark accuracy. These disappointing results could ascribe to the nature of the dataset, as the practical usage of Doc2Vec mostly applied to big datasets with millions of documents (Lau and Baldwin 2016), our dataset might not be able to unleash its power due to the lack of “learning material”.
Word Embeddings
In the previous section, we tried to use the document embedding as the document representation but the result was not very desirable. Hence, we tried another embedding model, the Word2Vec models and evaluated their predictive power. Word2Vec models are the prototypes of the Doc2Vec models; they generate the vectors for on the word level, not the paragraph or document level. There are two kinds of Word2Vec models, the Skip-Gram (SG) model, and the Continuous Bag of Words (CBOW) model. The first one is using the target word to predict its context while the other is the opposite, using the context to predict the target word.
In these batches of experiments, we first trained the Continuous Bag of Words model and the Skip Gram model using different parameters. We kept the vector dimensions as 800, the same as the ones that we used in the Doc2Vec experiments, but here we tried different window sizes. Then, we used the word vector derived from the model to ensemble a document vector. In total, we tested two common methods, one was to average all the word vectors within the same document, and the other was to calculate the document vector by summing all the word vectors up. On top of this, we also tried to concatenate the features generated by the sum and the average functions.
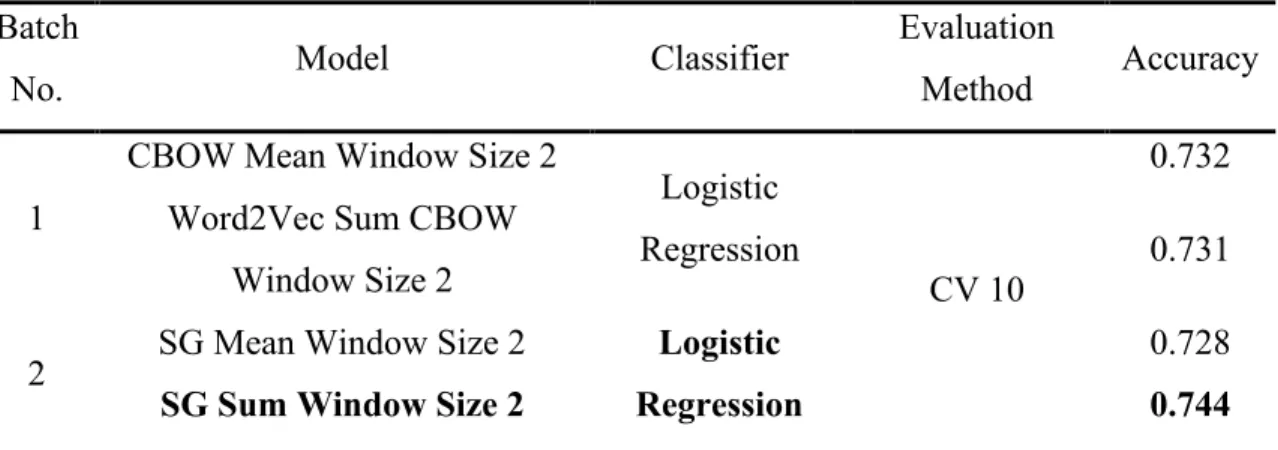
Table 3 Results from Word2Vec Models
Batch
No. Model Classifier
Evaluation
Method Accuracy
1
CBOW Mean Window Size 2
Logistic Regression
CV 10
0.732 Word2Vec Sum CBOW
Window Size 2 0.731
2 SG Mean Window Size 2 Logistic
Regression
0.728
Batch
No. Model Classifier
Evaluation
Method Accuracy
3 CBOW+SG Mean Window
Size 2 Logistic
Regression
0.738
CBOW+SG Sum Window Size
2 0.716
4 CBOW Sum Window Size 5 Logistic Regression
0.728
CBOW Mean Window Size 5 0.717
5 CBOW+SG Mean Window
Size 2
NN 256-3 0.735
NN 256-128-3 0.756
The results from all the experiments are shown in Table 3. In the first and second batch of trails, we tested the performance Continuous Bag of Words model and the Skip Gram model respectively. The classifier here was consistent with the previous trials, the ones using the Logistic Regression. We found the results of these two models barely differ, and there is no significant difference in the functions of sum and average. In the third batch, we concatenated the features generated from two models. Therefore, in the third batch, each document had 1,600 dimensions, not 800. The results shows that using two models at the same time has similar results, while the vector generated by summing has lower accuracy, the one generated by averaging has high accuracy.
In the fourth batch, we tried to tune the window size of the training data. It turns out that in our dataset the bigger window size actually impaired the predictive performance of the model. Therefore, we stuck to the previous window size of two. This phenomenon might relate to the nature of the tweet because it is a small document with 140 words at most. The larger window size will just take the whole document as the context.
calculated by taking the mean value of each word vectors within the document. We eventually tuned a Neural Network with three layers, whose first layer has 256 dimensions, second with 128 and the final one with 3. The ten-fold cross-validation of the model had an average accuracy of 0.756, the highest among all the results from the document and word embeddings.
Final Tweets Classification Results & User Standpoint Assignment
After the previous three rounds of classification tasks, we chose to use five of the models that have the best performance on accuracy in the cross-validations. They are the Logistic Regression Classifier with Unigram and Bigram term frequency features, the Neural Network Classifier with Unigram and Bigram term frequency features, the Neural Network Classifier with Distributed Bag of Words features, the Logistic Regression classifier with summed up Skip-gram model features, and the Neural Network classifier with both Continuous Bag of Words and Skip-gram features.
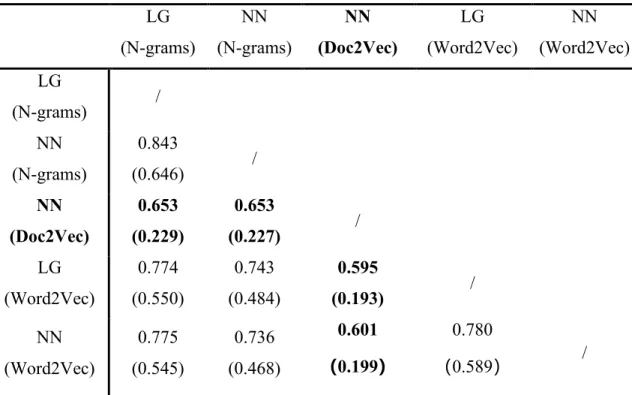
We further measured the inter-rater agreement between these five classifiers to see if the classifiers predicted the target in a consistent way even though they had similarly high accuracy. We utilized two major methods here. One is the joint probability of agreement, which is the most simple and intuitive one; the other one is the Cohen’s Kappa Coefficient (Cohen 1960), which measures the agreements beyond that caused by chance.
produced odd results that were not consistent with the other four models, which only reached a Kappa value of around 0.2. According to the convention, the Kappa value from 0 to 0.2 only indicates slight agreement; 0.2 to 0.4 implies fair agreement; 0.4 to 0.6 entails moderate agreement; 0.6 to 0.8 ensures substantial agreement (Landis and Koch 1977). Therefore, we chose to drop out the results of the Doc2Vec model due to its low inter-rater agreement which only slightly overlaps with the other four classifiers. If not, this array of data might corrupt the dataset and added noise to it. We nonetheless kept the other classifiers’ results since they performed consistently and echoed with each other, reaching
a moderate or substantial agreement.
Table 4 Inter-rater Agreement between Five Classifiers
LG (N-grams) NN (N-grams) NN (Doc2Vec) LG (Word2Vec) NN (Word2Vec) LG
(N-grams) / NN
(N-grams)
0.843
(0.646) /
NN (Doc2Vec)
0.653 (0.229)
0.653
(0.227) /
LG (Word2Vec) 0.774 (0.550) 0.743 (0.484) 0.595
(0.193) /
NN (Word2Vec) 0.775 (0.545) 0.736 (0.468) 0.601 (0.199) 0.780
(0.589) /
Finally, we conducted the user-level standpoint assignment by grouping their tweets and averaging the standpoint score of their utterance. In our research, tweets with neutral standpoints were assigned with the value of 0, against Silent Same tweets have the value of 1, and the for Silent Sam tweets are assigned with -1s. In the end, we were able to obtain 4,499 users and their standpoint on the activism of Silent Sam conversation in our dataset. Figure 3 shows the distribution of the user standpoint. We observed a non-normal distribution in this plot as most of the users clumps around 0. Also, there is a considerable amount of users at the end of the spectrum, the Against and For party. In general, more users that are active in the dataset are Against-leaned. This is understandable because our tweets dataset has more tweets classified as “A” and “N” other than “F”. The unbalance observed here reflected the inactivity of the For Silent Sam group, the more conservative side of the conversation. Considering the overall political atmosphere around the campus is more liberal, we think the lesser appearance of the For Silent Sam group a realistic representation of the dynamics of the activism on the digital platform.
Interaction Type Identification
Several kinds of interaction profuse on Twitter. The most commons ones are replies, mentions, retweets, and quote tweets. A reply is a response to another person’s tweet while mention is a tweet that contains another person’s username anywhere in the body of the tweet (Twitter n.d.). To clarify their difference, a reply must have a specific parent tweet that it is responding to while a mention could be just an initiation of a conversation with someone. Mentions do not have a specific tweet as a communication target, but a person. These two kinds of interaction would create a “Conversation” in twitter’s system, and therefore within the scope of our research. Retweets, including quote
tweets, are similar to replies and mentions but they serve a slightly different function. Retweets are mainly for sharing. When users retweet, they share the tweet publicly to their followers. If a user retweets with a comment, it would be a special kind of retweet called quote tweet. Compared with a simple retweet, quote tweets must contain the original words by the user who retweets. Therefore, considering our research questions here, we only use the quoted tweets of all the retweets and the simple retweets are not considered for the lack of informativeness.
all the URLs appeared in the text and extract its corresponding username. In total, we were able to find 14,789 times of interactions between the users. 11,055 of them were replies or mentions and the rest 3,734 were quote tweets.
cross-cutting between Against and For users. Therefore, to avoid the spurious interaction type identification, we eventually put neutral users aside.
In order to distinguish the type of interaction on Twitter and the type of interaction based on standpoint, we used the term “Twitter Interaction Type” to describe the former ones and “Communication Type” for the latter ones.
Table 5 Possible Communication Types
A N F
A Homogeneous Neutral Cross-Cutting
N Neutral Neutral Neutral
F Cross-Cutting Neutral Homogeneous
Additionally, we also observed that in some tweets people would mention some users that are not in our dataset. For example, a lot of users who wanted the Silent Sam to be taken down urged the chancellor to do so at that time, and in their tweets, they mentioned “@ChancellorFolt”. However, the account “@ChancellorFolt” has no original tweets
User-Communication Type Analysis
In this section, we analyze the data to answer the first question: do people communicate more with their friends or not? Based on our literature review, researchers discovered different results about the cross-cutting or the homogeneous nature of an online conversation. In this more niched situation, online activism, we want to see the result for this specific kind of online communications. Two main approaches are used in this part of the analysis, one is the significance tests while the other is the social network analysis.
Significance Tests
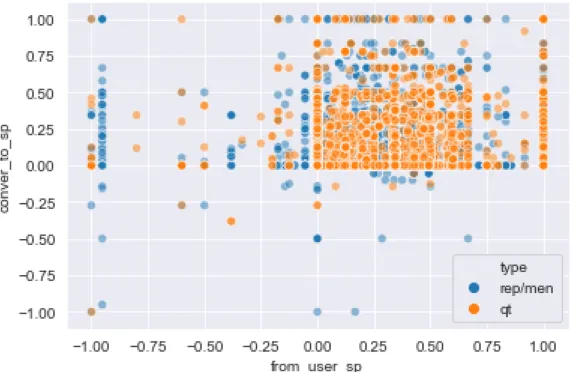
Figure 4 Scatter Plot of The Standpoints of Interacted Users
Table 6 Descriptive Statistics of User Interactions
Descriptive Statistics
Number of Cross-cutting Interactions
Number of Homogeneous Interactions
Median 0.000 0.000
Mean 0.086 1.344
Std. 1.200 11.374
Min 0.000 0.000
25% 0.000 0.000
50% 0.000 0.000
75% 0.000 0.000
Max 58.000 562.000
Figure 6 Cross-Cutting and Homogeneous Interaction Percentage Distribution
To determine whether the difference in initiating two kinds of interaction has statistically significance, significance tests were conducted followingly. Based on the assumption of the significance tests, we first tested the normality of our data. Figure 6 shows the Q-Q Plot for the count for different types of interaction for users. With the line deviates from the ideal red line, along with the distribution and descriptive statistics mentioned before, we could assume that the counts for the number of different interaction types do not conform to the Gaussian distribution. The same non-normality also applies to
the relative value of the types of interactions, as Figure 7 shown below. Our D’Agostino’s
K2 Test further confirmed our initial conclusion from visualizing the Q-Q plot that the
counts for homogeneous interactions, K2 (4,499) = 11,834.82, p = .000, the counts for the
cross-cutting interactions, K2 (4,499) = 2,437.71, p = .000, the percentage of homogeneous
interaction, K2 (2,827) = 2,600.43, p = .0, and the percentage of cross-cutting interaction,
K2 (2,827) = 799.31, p = .000, all have non-normal distributions. Thereby, we can conclude
that due to their data distribution, they are unsuitable for parametric statistical tests. Next, we chose to run the Mann-Whitney U test. This is a non-parametric significance test technique that doesn’t assume a normal distribution of the data. As two groups are independent and they are not repeated measured at different times, the data are not matched or paired data, so U test also fits for our needs and situations. For the count of the number of cross-cutting and homogeneous interactions, there is a significant difference,
U (4,499) = 3,154,232, p = .000, with people have higher homogeneous interactions (M = 1.344, SD = 11.3) than cross-cutting interactions (M = 0.086, SD =1.200). When it comes to the percentage, the results from the U test are also statistically significant, U (2,827) = 3,138,470.0, p = .000, inferring that users incline to have more higher probability of
forming homogeneous interactions (M = 0.148, SD = 0.298) than cross-cutting interactions (M = 0.013, SD = 0.091).
Social Network Analysis
While the significance tests inferred that from the statistical point of view, people in an online activism setting tend to interact with their friends, we do not see any nuanced insights about how they discriminately interact with each other. To further delve into their communication patterns, we want to find more motifs from a network perspective. In this subsection, we constructed a network using extracted edges and nodes from our cleaned dataset. Specifically, we counted the subgraphs in the real-world network to validate whether the “triadic closure” is found or affected in this scenario. Then, we compared the
result of it with other simulated networks, twerking the probability of two nodes forming an edge based on the similarity or difference of their standpoints.
Network Overview
Table 7 Descriptive Statistics of the whole Network
Category Metric Value
Node Statistics
Num. of Nodes 4,498
Max Degree 886
Min Degree 0
Average Degree 1.9249
Edges Statistics
Num. of Edges 4,329
Edge Density 0.000428
Assortativity Degree Assortativity -0.1661
Cliques
Largest Clique Size 7
Number of Largest Clique 6
Number of Maximal Clique 5,705
Clustering
Num. of Triangles 8,442
Transitivity 0.01762
Average clustering 0.06329
Components Num. of Connected Components 2,495
Is Connected False
Subgraph Mining & Network Simulation
After we constructed the network encompassing all existing interactions, we iterated all the possible triplets in our network to see the interaction motifs between three people, not just two people. Triangles are the solid structure that is hard to break, also triadic closure, the manifestation of the “strength of the weak ties” would take effects here.