Temporal changes in small scale snowpack surface roughness length for sublimation estimates in hydrological modelling
15
0
0
Full text
(2) Fassnacht. from and/or a snowpack surface. There have been numerous values estimated for the zo of snow. Fassnacht et al. (1999) computed a value of 0.005 m for zo using a relationship developed by Lettau (1969) that considers the magnitude of roughness elements. Goodison et al. (1998) suggested that 0.01 m should be used for converting wind speeds from their measured height to the height of the precipitation gauge mouth. Leydecker and Melack (1999) stated that the snowpack zo varies from 0.0001 to 0.02 m, with “smooth” snow having a length of 0.001 m and 0.005 m for undulating snow. Land surface schemes use constant snowpack zo values that are the same for sensible heat flux and latent water vapor flux computations, but may be different for momentum flux. Hydrological models are typically less physically based since they are driven by less forcing data and do not consider atmospheric stability, with sublimation often being computed only from the latent vapor flux equation. For in-depth studies of heat and vapor fluxes, the zo for a snow or sea ice surface has been defined as a function of the momentum, sensible heat, and latent water vapor fluxes (e.g., King and Anderson, 1994). These different roughness lengths, zoM, zoH, zoE, respectively, are likely influenced by the atmospheric stability (Wood and Mason, 1991). Due to scatter in their data, King and Anderson (1994) stated that the different roughness lengths were approximately equal (0.000056 m), while Andreas (1987) illustrated that they are not equal and are a function of the Reynolds, Prandtl, and Schmidt numbers, with zoH 3.49 times as large as zoM, and zoE 5 times as large as zoM. Chamberlain (1983) showed that zo was a function of the square of the friction velocity (u*), which Pomeroy (1988) empirically related to the 10-m wind speed (U10) by the exponent 1.295. The different values estimated for snowpack surface roughness length are a function of location in time and space, and snowpack surface properties are strongly influenced by meteorological conditions that dictate fresh snow characteristics, movement of snow, and metamorphism. In this light, the objectives of this paper were i) to estimate the temporal change in snowpack zo from laboratory experiments, and ii) to determine the sensitivity of snowpack zo temporal changes in hydrological modeling. 2. Methods 2.1. Laboratory Experiments The experiments were performed in a cold room operated by the Department of Civil Engineering at the University of Waterloo. The cold room had a volume of approximately 4 m3 and was insulated by 8 cm foam within steel walls plus 5 cm Styrofoam insulation. The temperature was maintained in the chamber by an internal compressor unit that ran on a 24 hour defrost cycle. To reduce the humidity and temperature variation at the experiment, the experiment area was isolated from the compressor unit by a double sheet of 5-mil polyethylene plastic. The sublimation apparatus was housed in a box sealed by polyethylene plastic except for the entrance fan and an exit port.. 44.
(3) Temporal changes in small scale snowpack surface roughness length for sublimation estimates in hydrological modelling. Snow was placed in a small evaporation pan with as minimal disturbance as possible. Fresh snow was shoveled into the pan to fill the bottom uniformly, leaving five to 10 cm free at the top. Snow was then shoveled carefully as blocks to fill the pan to the top. Fresh snow was poured into the pan’s edges, where undisturbed layers could not placed, in order create a uniform snow surface. The pan was constructed from galvanized steel and had a diameter of 61 cm and a depth of 12.7 cm. It was mounted on three knife blade edges at the outside ends of 2.5 cm box beams. At the opposite ends, the three box beams were attached together below the centre of the pan by a bolt into a 12 kg S-shaped load cell (manufactured by ARCTECH®) industries). The knife blades sat on a three arm base built of 12.7 cm Ibeams that were each welded to the adjacent beam 25 cm from the end to create an empty triangular space, 20 cm in length. A 1.5 cm piece of steel was welded to the underside of each I-beam flange to create a triangular support at the center of the I-beam base that held the bottom of the load cell to measure changes in load in terms of voltage. Upon calibration, the data acquisition unit recorded mass in kg with a precision of 7 g. The deformation of the apparatus and pan were assumed to be minimal since the sublimation losses were measured as a function of the initial snow plus apparatus mass, and the mass usually decreased by less than 20% over each experimental run. The initial mass was taken as the average mass of the first 20 readings to decrease the effect of voltage fluctuation through the load cell. A. Dry and wet bulb temperatures were measured near the surface of the snowpack using thermocouples. At the top of the snow and at several heights up to a meter above, two VAISALLA® HMP 35 sensors (labelled 1 and 2) were used to measure the air temperatures. The mass of the pan, and the dry and wet bulb temperatures were recorded every three minutes based on a continuous average. Wind was provided by a variable speed 25 cm fan. The wind speed was measured across the pan at several heights throughout each experiment. A digital display hot-wire anemometer (KANOMAX® Climomaster 6511 with a flexible tip) was used to measure the point wind speeds. Daily mean wind speeds at each height were calculated by kriging the point measurements. Four experimental runs were conducted and were labeled A, B, C, and D in sequential order of occurrence. Each experiment used different snow and was continued for five to seven days. The wind speed was held constant for each run, but varied between experimental runs. The load cell mass data were averaged to provide 12-h estimates of sublimation losses. From the two VAISALLA sensors, the latent and sensible mass transfer equations were used to compute two sets of zo values. 2.2. Estimating Sublimation Sverdrup (1936) derived equations for air movement over snow by considering eddy conductivity. The amount of water transported away from or towards the surface was defined as a function of the eddy conductivity and the change in the specific. 45.
(4) Fassnacht. humidity of air (q) with respect to the height above the surface (z). The mass transport per time per area, FE, explains the vertical distribution and exchange of water vapor as:. (1),. where ρa is the density of water vapor, ko is the von Karman roughness coefficient (set to 0.40 from Oke, 1987), Ua is the wind velocity at height za, zd is the zero-plane displacement, zb is the measurement height of qb, and qo is the specific humidity at the surface of the snow. The sensible heat flux, as energy per unit time per area, QH, is a function of the specific heat capacity of air (cp), the eddy conductivity under stable air, and the change in the potential temperature of air (φb) with respect to the height above the surface, defined as:. (2),. where (φo) is the surface potential temperature. The potential temperature considers the vertical atmospheric stability in terms of pressure change from the surface to the measurement height. Light (1941) assumed no zero-plane displacement, i.e., a zd of zero. The lapse rate was assumed to be minimal for typical measurement heights, i.e., there was no significant atmospheric pressure change. Dividing the sensible heat flux (equation 2) by the latent heat of sublimation, the heat flux equation becomes a mass flux equation. 2.3. Estimating Roughness Length To determine the snowpack roughness length, measured sublimation can be compared to the sublimation computed from mass and heat transfer equations. Using the latent and sensible mass transfer equations (1 and 2), the roughness length can be solved. The latent mass flux equation (1) can be rewritten as:. (3),. where Δeb is the difference between the vapor pressure at zb and at the surface,. 46.
(5) Temporal changes in small scale snowpack surface roughness length for sublimation estimates in hydrological modelling. (4),. and P is the station air pressure, zoE can be solved for by expanding the natural logarithm divisions. Assuming that all roughness lengths are equal, and setting the right side of the equation set to zero, a quadratic function is formed, and the roots of zoE can be found as:. (5).. Subtraction of the square root in equation (5) will yield the natural logarithm of the roughness length. A similar formulation can be found for zoH from the sensible mass flux equation that has KH Ua ΔTb / FH as the final term under the square root. 2.4. Sublimation Modeling Sensitivity A simplified hydrological modeling approach used the latent mass flux (equation 3 with equation 4) to compute sublimation and determine the sensitivity of the roughness length. The density of air was computed as a function of the air temperature. The temperature, wind speed, air pressure were measured. Vapor pressure above the snow surface was computed as a function of air temperature and humidity that were measured at the same height as the wind speed, and at a known height above the snow surface. The vapor pressure at the snow surface (eo) was assumed to be the saturated vapor pressure at the air temperature. Fassnacht (2004) used this approach to estimate the hourly sublimation losses when the air temperature was at or colder than 0oC for six meteorological stations in the conterminous United States. Sublimation was computed for the Syracuse, NY and Leadville, CO National Weather Service Automated Surface Observing Sites (ASOS) for the winter of 2001 (data from NCDC, 2004) for comparison of the following five different roughness length formulations: i) a constant zo of 0.005 m and subsequently 0.01 m; ii) a decreasing zo from 0.01 m to 0.005 m using a first order decay; iii) an increasing zo in the reverse form of iii); iv) anisotropy of zo based on the wind direction; and v) zoE (0.005 m and subsequently 0.01 m) five times as large as zoM, as per the observations of Andreas (1987). For scenarios i) through iv), zoE was the same as zoM.. 47.
(6) Fassnacht. The first order decay was determined as a function of zo from the previous time step in the form:. (6),. where the initial zo, i.e., zo(t=0) is 0.01 m for iii) and 0.005 m for iv), the minimum (or maximum) zo, i.e., zo(t=4) is 0.005 m (or 0.01 m for iv), Δt is the time step in hours, and the decay coefficient, α, is -0.0125 per hour. It was assumed that zo was reset for at each new snowfall event. For the directionality of zo (scenario iv), the smooth roughness length (zo SMOOTH) occurred in the direction of the most consistent wind direction (UDN), which was identifying from the 10E increment wind rose, since ASOS wind direction (UD) is report to the nearest 10E. The rough roughness length (zo ROUGH) was assumed to occur when the wind was perpendicular to the most consistent wind direction. The directional zo was thus computed as:. (7).. To further test the sensitivity of the directional (zo), different sets of zo SMOOTH and zo were used, with zo SMOOTH varying from 0.001 to 0.005 m, and zo ROUGH varying from ROUGH 0.005 to 0.01 m.. 3. Results The sublimation that was measured in the laboratory was directly from the snowpack samples. Li and Pomeroy (1997) show that the threshold wind speed for movement of snow particles at a measurement height of 10m is usually greater than 5 m/s, but in a few instances as low as 4 m/s. Using the logarithmic wind profile equation (Oke, 1987), the maximum 10-m wind speed for the experiments A, B, C, and D was 3.2, 3.4, 1.3 and 0.85 m/s, respectively. Therefore it is assumed none of the crystals were blown from the sublimation pan. A plot of mass change per unit area per day (Fig. 1) illustrates that there was a decrease in the observed sublimation over time with the greatest decrease occurring in the first couple of days. The low sublimation for the first 12 hours in experiment C may have been caused by the setup of the particular experiment or rapid changes in the environmental conditions in the cold room.. 48.
(7) Temporal changes in small scale snowpack surface roughness length for sublimation estimates in hydrological modelling. Figure 1. Observed sublimation losses in millimetres per day (12 hour averages) for four different experimental trials.. For the measured sublimation, the roughness length was computed from the sensible heat flux (heat) and latent mass flux (mass) equations for the two sets of VAISALLA sensors (1 and 2), assuming that the momentum roughness length was the same as the latent or sensible flux zo. The decrease in the roughness lengths are consistent for the four computations for experiment A (Fig. 2); the four sets of change in zo are consistent for each of the other three experiments. The stepwise decrease in zo from the “mass” equations is based on the defrost cycle which ran daily for approximately 30 minutes, increasing the freezer temperature and venting excess humidity. At the maximum observed sublimation for experiment A, 2.2 mm/d, only approximately 0.6 kg of snow was sublimated. This amount of additional vapour into the system was small, and was removed from the system during the defrost cycle. The experimental design was such that sublimated vapor would be carried out of the polyethylene box which was closed on the top and sides, thus creating a microclimate which was gauged by the thermocouple, VAISALLA sensors and the anemometer. Since the computed sublimation was relatively constant, the changes in computed zo (Fig. 3) closely reflect the observed sublimation rates (Fig. 1). For experiments A and C (except the first time step), zo decreases over the course of each experiment while zo only decreases over the first three and two time steps for experiments B and D, respectively (Fig. 3). The computed roughness length increases for experiment B after three days. After one day the computed zo oscillates between 0.004 and 0.006 m with a period of. 49.
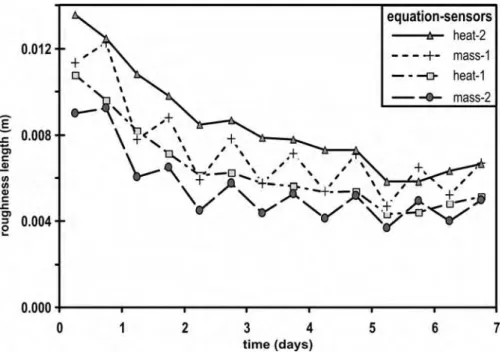
(8) Fassnacht. Figure 2. Roughness length required to match computed with observed sublimation using mass and heat transfer formulae for two different sensors for experiment “A”.. Figure 3. Roughness length required to match computed with observed sublimation (heat transfer method using sensor #1 data) sublimation and fitted first-order law curves for the four experiments.. 50.
(9) Temporal changes in small scale snowpack surface roughness length for sublimation estimates in hydrological modelling. Figure 4. Summary of winter (November 2000 to March 2001) monthly meteorological data for the Syracuse NY and Leadville CO Automated Surface Observation Station: a) daily cumulative precipitation, b) frequency of precipitation, c) wind speed, d) vapour pressure deficit, and e) temperature.. 51.
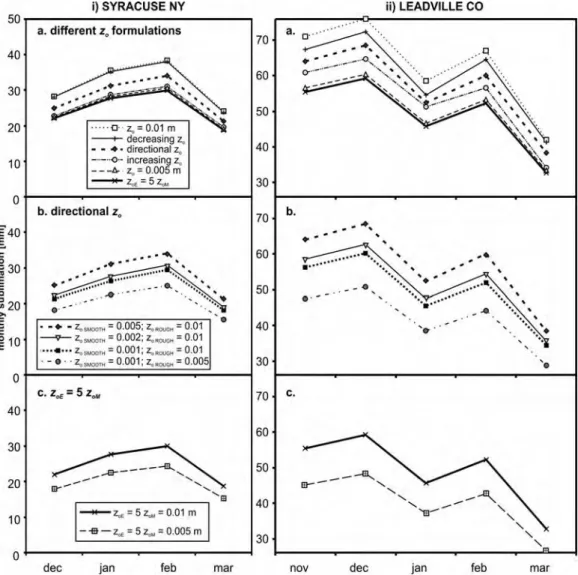
(10) Fassnacht. Figure 5. Ten degree wind rose for Syracuse NY and Leadville CO.. approximately two days for experiment D. After four days, zo for all experiments was computed to be between 0.005 and 0.006 m. For the longest experiments (A and D), zo began to increase after five days and approached the same value. The winter 2000-2001 for Syracuse was a cool and wet, while Leadville had a cold, dry winter (Fig. 4a-e). Syracuse experienced precipitation two to three times as often as Leadville (Fig. 4b) with more than five times as much snow falling (Fig. 4a). Wind speed were similar for the two sites (Fig. 4c), but the dominant wind direction for Syracuse was 85E while for Leadville, it was 5E (Fig. 5). While temperatures were warmer for Syracuse (Fig. 4e), and the humidity was higher, yielding similar vapour pressure deficits for both sites (Fig. 4d). For the base case, i.e., using a zo (zoE = zoM) of 0.01 m, monthly sublimation was computed to be between 25 and 40 mm for Syracuse, and between 42 and 72 mm for Leadville (Fig. 6ai and 6aii), as per Fassnacht (2004). All other scenarios yielded a decrease in the monthly sublimation. Lowering zo to 0.005 m decreased sublimation by 20.5%. The estimated sublimation for the decreasing zo (scenario ii) was similar to the base case when precipitation occurred more often, i.e., at Syracuse. Similarly, the increasing zo scenario (iii) was similar to the zo of 0.005 m case. The difference in sublimation estimates for directional zo scenarios (iv) were a function of the smooth and rough zo values (Fig. 6bi and 6bii), as well as the distribution of wind (Fig. 5). Considering zoE to be five times zoM (scenario v), sublimation was 22% less than the base case for a zoE of 0.01 m, and 36.5% less for a zoE of 0.005 m (Fig. 6ci and 6cii).. 52.
(11) Temporal changes in small scale snowpack surface roughness length for sublimation estimates in hydrological modelling. Figure 6. Estimated total monthly sublimation from the latent heat flux formulation computed from a) different zo formulations, b) directional zo, and c) different zoE and zoM for the i) Syracuse NY and ii) Leadville CO.. 53.
(12) Fassnacht. 4. Discussion Snowpack surface roughness length varies temporally. Wind, radiation inputs, snowfall, and temperature variations all influence the properties of a snowpack surface. Small scale experimentation showed a decrease in snowpack zo over seven days. Modelled sublimation is a function of the aerodynamic roughness length. The various formulations for zo illustrated a large range of sublimation estimates. While several of these estimates were a scaled proportion of the base case (zo = 0.01 m), i.e., all non-variable zo values (scenarios i and v), sublimation estimated computed from zo as a function of the occurrence of precipitation (scenarios ii and iii) and from directionality in zo (scenario iv) varied from the base case (Fig. 6a and 6b). The differences were related to the values zo, but also influence by the variations in local meteorology, in particular, the frequency of precipitation and the consistency in the direction of the wind. Williams (1959) measured sublimation using three shallow 30-cm diameter pans for 14 days during the winter of 1956-1957 in Ottawa, Canada. Using the daily snow depth data (from Environment Canada, 2002) at the Ottawa Experimental Farm (station 6105976) to determine the occurrence of fresh snow, all but one measurement illustrated a consistent trend of increasing roughness as snow aged. The work by Williams (1959) presented the opposite of what the experiments showed; after a precipitation event the computed sublimation was greater than the measured values and when time elapsed after a storm, the measured sublimation was greater than computed values. The systematic difference is due in part to the resolution of the meteorological and snow depth data, i.e., sub-daily meteorological variability was not considered, or the small size of the sublimation pans. No other concurrent measurements of sublimation and meteorological variables were found in the literature that allowed for an examination of temporal changes in snowpack zo. In the White Mountains of California and Nevada, Beaty (1975) measured the mass change of snow blocks and found that the largest sublimation occurred after a fresh snow event. While there was no comment on the change in surface conditions or meteorology, the variation in sublimation may have been associated with a change in either. Roughness length was computed to decrease over time from sublimation experiments. Various investigators have shown a range of snowpack zo values: at Maudheim ice shelf, Konstantinov (1963) presented values from 0.0002 to 0.0008 m and 0.005 to 0.02 m for different snow conditions; at the Ampere Glacier, Poggi (1976) computed a fresh snow zo of 0.0002 while that of ice was 50 times larger; and Inoue (1989) showed a directionality of zo with wind and reported values between 10-6 to 10-3 m for the Antarctic Plateau. Munro (1989) determined an average value snowpack zo of 0.0055 m. Since there was at least an order of magnitude of difference in reported snowpack zo values, he recommended that site specific values should be obtained from profile data or microtopographic information, such as the Lettau (1969) computation or photography. The interaction between changing meteorology and a changing snowpack surface will. 54.
(13) Temporal changes in small scale snowpack surface roughness length for sublimation estimates in hydrological modelling. continue to alter zo, which may be dramatically changed by a fresh snowfall. For ice, Munro (1989) found that zo was controlled by larger elements, i.e., ice hummocks, instead of fine scale features, i.e., crystals. This illustrates the importance of scale. The experimental results shown herein relate to crystal size variation due to the small size of the apparatus. Future work should record small and large scale snowpack surface changes using photography or digital tomography. Deviation from the logarithmic wind profile, such as seen by Munro (1989) higher than 1 m above the Peyto Glacier, will introduce additional errors, but this is beyond the scope of this paper. While zo is highly correlated with u*, the scatter in this relationship found by Bintanja and Van den Broeke (1995) for East Antarctica may be indicative of surface changes not correlated between zo and u*. Using albedo measurements to differentiate between partial snow cover and ice, Bintanja and Van den Broeke (1995) illustrated an increase in zo with increased snow. Since many of the snow zo values found in the literature are based on permanent snowfields, in particular Antarctica and glacier surfaces, additional measurements are needed for seasonal snow environments. When Bathurst and Cooley (1996) incorporated snowmelt into the Systeme Hydrologique Europeen for the Reynolds Creek watershed in Idaho, they changed zo from 0.001 m to 0.003 m and found a 30% increase in total runoff volume due to increased snowmelt related to turbulent exchange. This significantly improved the simulation of the rising limb of the hydrograph. They also varied the height of the anemometer above the snow surface with similar results. The state of atmospheric stability is important and either the Monin-Obukhov length scale or the bulk Richardson number is used. For simplified hydrologic modeling, neither is used, however realistic approximations of zo, among other variables, is required to produce reasonable sublimation rates, and/or latent and sensible heat fluxes. Similarly changes in the snowpack surface zo, as illustrated by the experimental results in this paper, together with decreases (or increases) in instrument height above the surface as the snowpack deepens (or ablates) (Munro, 1989; Bathurst and Cooley, 1996), will alter sublimation and turbulent flux estimates.. 5. Conclusions Laboratory experiments were performed that illustrated a decrease in snowpack roughness length of up to 50% over a five to seven day period. A variation in zo is consistent with what has been found by other researchers, especially in light of the difficulty in estimating a single value. Snowpack roughness length is an important parameter for hydrological modeling, as it influences heat fluxes and sublimation rates. Its sensitivity illustrates the necessity to determine the its uncertainty and variability. Variations in zo can be a function of the metamorphism of the snowpack and hence related to the time since the last snowfall. As well, consistent wind can create directionality of zo, whereby when the wind blows in the. 55.
(14) Fassnacht. dominant wind direction zo is more smooth and it is more rough when the wind blows in a perpendicular direction. It is important to determine a site specific value for zo, which varies over time and space, and may be a function of a snowpack’s meteorological history.. Acknowledgments Initial financial support for this project was provided by Meteorological Service of Canada through the CRYSYS project and science subventions. Ideas and funding for the apparatus were provided Dr. N. Kouwen of the University of Waterloo (UW). Mr. T.P. Ridgway of UW assisted with the laboratory and apparatus construction. Preliminary results were discussed with Dr. E.D. Soulis of UW. Discussions with Dr. J.W. Pomeroy at the University of Saskatchewan provided invaluable insight into the process of sublimation. Thoughtful comments on this paper were given by Dr. J.D. Stednick, Ms. A.E. Sawyer and Mr. S.D. McKim of the Watershed Science Program at Colorado State University.. References ANDREAS, E.L. (1987). A theory for the scalar roughness and the scalar transfer coefficients over snow and sea ice, Boundary-Layer Met., 38: 159-184. BATHURST, J. C., COOLEY, K. R. (1996). Use of the SHE hydrological modeling system to investigate basin response to snowmelt at Reynolds Creek, Idaho, J. Hydrol., 175: 181-211. BINTANJA, R., VAN DEN BROEKE, M. R. (1995). Momentum and scalar transfer coefficients over aerodynamically smooth Antarctic surfaces, Boundary-Layer Met., 74, 89-111. CHAMBERLAIN, A.C. (1983). Roughness length of sea, sand, and snow, Boundary-Layer Met., 25: 405-409. ENVIRONMENT CANADA (2002). Canadian Daily Climate Data CDs, The Green Lane, Environment Canada, accessed December 22, 2004, URL: http://www.climate. weatheroffice.ec.gc.ca/prods_servs/cdcd_iso_e.html. FASSNACHT, S. R., SOULIS, E. D., KOUWEN, N. (1999). Shape characteristics of freshly fallen snowflakes and their short-term changes, Interactions between the Cryosphere, Climate and Greenhouse Gases (Proceedings IUGG 99 Symposium HS2, Birmingham, July 1999) IAHS 256: 111-122. FASSNACHT, S. R. (2004). Estimating alter-shielded gauge snowfall undercatch, snowpack sublimation, and blowing snow transport at six sites in the coterminous United States, Hydrol. Proc., 18(18), 3481-3492 (doi:10.1002/hyp.5806).. 56.
(15) Temporal changes in small scale snowpack surface roughness length for sublimation estimates in hydrological modelling. GOODISON, B. E., LOUIE, P. Y. T., YANG, D. (1998). WMO Solid Precipitation Measurement Intercomparison Final Report, WMO Instruments and Observing Methods Report No. 67, WMO/TD No. 872. HOOD, E., WILLIAMS, M., CLINE, D. (1999). Sublimation from a seasonal snowpack at a continental, mid-latitude alpine site, Hydrol. Proc., 13: 1781-1797. KING, J. C., ANDERSON, P. S. (1994). Heat and water vapor fluxes and scalar roughness lengths over an Antarctic ice shelf, Boundary-Layer Met., 69: 101-121. INOUE, J. (1989). Surface drag over the snow surface of the Antarctic Plateau 1. Factors controlling surface drag over the katabatic wind region, J. Geophys. Res., 94(D2): 2207-2217. KONSTANTINOV, A.R. (1963). Evaporation in Nature, Gidrometeoizdat, Leningrad, 590 pp. (in Russian). LETTAU, H. (1969). Note on aerodynamic roughness-parameter estimation on the basis of roughness-element description, J. Appl. Met., 8(5), 828-832. LEYDECKER, A., MELACK, J. M. (1999). Evaporation from snow in the central Sierra Nevada of California, Nordic Hydrol., 30(2), 81-108. LI, L., POMEROY, J. W. (1997). Estimates of threshold wind speeds for snow transport using meteorological data, J. Appl. Met., 36, 205-213. LIGHT, P. (1941). Analysis of high rates of snow-melting, Trans. AGU, 195-205. MUNRO, D. S. (1989). Surface roughness and bulk heat transfer on a glacier: comparison with eddy correlation, J. Glaciol., 35, 343-348. NCDC (2004). National Climate Data Center, National Climate Data Center, Ashville NC, <http://www.ncdc.noaa.gov/oa/ncdc.html>, page last updated September 07, 2004. OKE, T.R. (1987). Boundary Layer Climate, 2nd ed., Routledge, 435 pp. POGGI, A. (1977). Heat balance in the ablation area of the Ampere Glacier (Kerguelen Islands), J. Appl. Met., 16, 48-55, 1977. POMEROY, J. W. (1988). Wind Transport of Snow, PhD thesis, Division of Hydrology, University of Saskatchewan, Saskatoon, 226 pp. SVERDRUP, H. U. (1936). The eddy conductivity of the air over a smooth snow field, Geofysiske Publikasjoner, 11(7), 1-69. WILLIAMS, G. P. (1959). Evaporation from snow covers in Eastern Ontario, National Research Council of Canada, Division of Building Research, Research Paper No. 73. WOOD, N., MASON, P. J. (1991). The influence of static stability on the effective roughness lengths for momentum and heat transfer, Quart. J. Royal Met. Soc., 117, 1025-1056.. 57.
(16)
Figure


+2
Related documents
We showed that the use of cannabis at either phase of assessment (baseline or 12 month follow-up) was associated with significantly higher scores in PANSS total and positive
Based on studies of Porter’s theory and other concepts of cluster development the author formulated the following definition of the territorial and industrial cluster in ACS: This
The aim of this research is to investigate the comfort and safety of a novel device for measuring P-A trunk stiffness in a sample of young adults.. Methods: A sample of young
To summarise, the two Gambia Environment Action Plans (GEAP I & II) aim to conserve and promote the sustainable use of natural resources in the Gambia and set the required
reported significantly lower plasma irisin concentrations in hemodialysis patients when compared to healthy vol- unteers; moreover, no association between irisin levels
