INTRODUCTION
Artemether ((3R, 5aS, 6R, 8aS, 9R, 10S, 12R, 12aR )-decahydro-10-methoxy-3, 6, 9-trimethyl-3, 12-epoxy-12Hpyrano [4,3-j]-1, 2-benzodioxepin) is a semisynthetic polyoxygenated amorphene-containing aperoxide bridge that confers potent antimalarial activity.[1] It is the O-methyl
ether prodrug of dihydroartemisinin and a derivative of artemisinin (qinghaosu), the principal antimalarial constituent of the Chinese herb Artemisiaannua (qing hao).[2] Artemether
is active against the erythrocytic stage of multidrug-resistant strains of Plasmodiumfalciparum. The antimalarial activity has been attributed to chemical activation of the drug within the food vacuole of the intraerythrocytic stage of the parasite; it is proposed that reductive cleavage of the peroxide bridge
by heme liberated during digestion of hemoglobin generates free radicals, which induce oxidative stress and alkylate heme and vital parasite proteins.[3] An interaction with membrane
phospholipids has also been suggested.[4] The peroxide
group in these compounds appears essential for activity and the peroxide group is retained in the active metabolite, dihydroartemisinin.[5]
Because of the promising activity exhibited by artemether against multidrug-resistant strains of P. falciparum, several researchers have focused on the development of various analytical methods to determine artemether in different matrices, such as plant extracts, serum, and pharmaceutical formulations. These methods include gas UV spectrophotometry,[5,6] high-performance liquid
ABSTRACT
A new simple, sensitive, precise, and accurate high-performance liquid chromatography (HPLC) method of analysis for artemether both as a bulk drug and in capsule formulations was developed and validated. The method employed mobile phase acetonitrile (ACN) and buffer in the ratio 65:35 of pH 6.5 adjusted with tryethylamine. The linear regression analysis data for the calibration plots showed good linear relationship with r25 0.9996 in the
concentration range 250-750 mg/ml. The mean value slope and intercept were 9355.5 and 293.5, respectively.
The method was validated for precision, accuracy, and recovery studies. Limit of detection (LOD) and Limit of quantitation (LOQ) for artemether were found to be 21.83-750 mg/ml, respectively. The method has been
successfully applied in the analysis of marketed capsule formulations. The presented method was found to be reliable to separate all the degradents from all the stress conditions with resolution of more than 1.5 showing that it is a stability indicating method.
Key words: ART, forced degradation, high-performance liquid chromatography, stability indicating method of artemether
DOI: 10.4103/0975-1483.62220
Stability Indicating High-Performance Liquid Chromatography
Method for the Estimation of Artemether in Capsule Dosage Forms
Shrivastava A, Issarani R
1, Nagori BP
1Department of Pharm. Sciences,B.R. Nahata College of Pharmacy, Mhow-Neemuch Road, Mandsaur (M.P) - 458 001, 1L.M. College of Science and Technology, Pharmacy wing, Shastri Nagar, Sector A,
Jodhpur (Rajasthan), India
Shrivastava, et al. J Young Pharm. 2010;2(1): 79-84 chromatography (HPLC) based on UV absorption,[7-9]
chromatography-mass spectrometry (GC-MS),[10] chemilu
minescence and electrochemical detection,[11] high-
performance thin-layer chromatography (HPTLC),[12,13]
and the capillary electrophoresis techniques.[14] However,
to the best of our knowledge no stability indicating HPLC method has been published in the available literature. The aim of the present work is to develop and validate[15]
an accurate, specific, and precise stability indicating HPLC method for determination of artemether as bulk drug and in solid dosage forms.
MATERIALS AND METHODS
HPLC Apparatus (shimadzu) equipped with LC-10 ATvp, double reciprocating plunger pump and SPD-10 Avp UV detector, and deuterium lamp as a light source ranging 190-600 nm was used. Hypersil Octadecyl silane (ODS) column, (250 3 4) mm, 5 mm particle size of packing,
pore size 120 A, Thermo Electron Corporation. Marketed formulations Larither and Falcidol capsules were purchased from a local market. Mobile phase selected was ACN and buffer in the ratio of 65:35 of pH 6.5 adjusted with tryethylamine. Wavelength selected was 210 nm. Standards and facilities were provided by Oasis Lab, Ahmedabad.
Preparation of a mobile phase
650 volumes of acetonitrile (ACN) was mixed with 0.005 M potassium dihydrogen phosphate (KH2PO4), adjusted to pH 6.5 with triethylamine filtered and degassed.
Preparation of 0.005 M KH2PO4
0.340 g KH2PO4 was transferred to a 500 ml volumetric flask and dissolved up to the mark with double distilled water.
Calibration curve
Suitable aliquots of the standard stock solution (10 mg/ ml) of ART (0.25, 0.35, 0.4, 0.45, 0.5, 0.55, 0.6, 0.65 and 0.75) were taken in 10 ml volumetric flasks and diluted with a mobile phase up to the mark to get 250, 350, 400, 450, 500, 550, 600, 650, and 750 mg/ml solution of drug. The
prepared solutions were then filtered through 0.45 m filter,
and 20 ml of each solution was injected.
The calibration data, the linear regression equation, and correlation coefficient for artemether were found to be y5 9355.5x 2 93.7 and r5 0.9998, where y is response
and x is the concentration of drug solution, respectively.
VALIDATION OF PROPOSED METHOD
Linearity
Linearity was assessed by two methods.
Visual examination
The numbers of points equally distributed on both sides of best fit line were inspected. From the calibration curve it is clearly seen that out of 9 points, 4 are on positive side (upper side of best fit line), 4 are on negative side (lower side of best fit line) and 1 is on the best fit line.
Residual analysis
Residuals were calculated and a graph was plotted between the residuals/deviations (predicted response-experimental response) and concentration. Distribution of residuals between upper and lower side of the regression line shows linearity.
Range
Working range
It begins from limit of quantification to the maximum concentration used for the development of the analytical method. In this case it is equal to 21.8317-750 mg/ml.
Linearity range
It is the interval in which the response is directly proportional to the concentration between the upper and lower levels (which is generally 65% of the intercept of average value).
In this case it is equal to 250-750 mg/ml.
Target concentration
It is defined as the concentration which is equal to the midpoint of linearity range [(250 1 750)/2] 5 500 mg/ml.
Target range
It is that concentration which is 80%, 100% and 120% of the target concentration. In this case these are equal to 400, 500, and 600 mg/ml.
Precision
Repeatability
Assessed by the area of six replicate determinations of ART solution at 100% of the target concentration, i.e. at 500 mg/ml. RSD obtained because of variation in area was
0.257 showing that the method it repeatable.
Intraday and Interday
three consecutive days for interday precision. RSD values obtained were 0.643 and 0.712 for intraday and interday, respectively.
Accuracy
5 ml of a preanalyzed capsule powder solution (500 mg/ ml)
and 0.1, 0.2 and 0.3 ml of an ART standard solution (1 mg/ ml) were mixed within three different 10 ml volumetric flask, respectively. The estimation of drug was done by a proposed method. The results of recovery of Larither and Falcidol capsules are shown in Tables 1 and 2, respectively.
System suitability
Five injections of the same solution (500 mg/ml) were
injected and variations between area and RT were observed. RSD due to changes in area and RT were found to be 0.274 and 0.326, respectively. Asymmetric and tailing factors were 1.20 and 1.30, respectively. The number of theoretical plates for the test concentration was 6998.
Limit of detection and limit of quantitation
The value of limit of detection (LOD) and limit of quantitation (LOQ) were calculated from the formula 3.3 3 (SD/S) and 10 3 (SD/S), respectively, by using
mean SD of data from the calibration curve. In this proposed method, 7.204 and 21.8317 mg/ml of ART are
calculated as LOD and LOQ, respectively.
Estimation of artemether in a capsule dosage form
50 mg equivalent powder of a capsule dosage form was transferred to four different 50 ml volumetric flasks. 65 ml of ACN was added and sonicated for 15 min. The flasks were then diluted up to a volume with 0.005 M phosphate buffer, filtered with 0.45 mm filter, and 20 ml was injected.
A standard artemether solution was prepared by dissolving 100 mg of drug in a 10 ml volumetric flask and diluting up to the volume. 0.5 ml of this solution was transferred to a 10 ml volumetric flask. Results of estimation of drug in two different capsule formulation are given in Table 3. Table 1: Results of recovery of larither capsules
Conc. (mg/ml)
Conc. found before spiking (mg/ml) (C1)
Conc. of std added (mg/ml) (C2)
Conc. found after spiking (mg/ml) (C3)
%Recovery (C32C1)* 100/C2
Mean 6 S.D RSD
250 247.558 100 345.89 99.52 99.37 6 0.76 0.765 344.82 99.21
348.67 100.32
250 247.558 200 448.29 100.16
446.15 99.68 447.05 99.88
250 247.558 300 539.06 98.44
536.93 98.06 542.27 99.03
Table 2: Result of recovery study of falcidol caps Conc.
(mg/ml)
Conc. found before spiking (mg/ml) (C1)
Conc. of std added (mg/ml) (C2)
Conc. found after spiking (mg/ml) (C3)
%Recovery
(C32C1)* 100/C2 Mean
6 S.D RSD
250 244.75 100 340.95 98.89 99.31 6 0.514 0.517
342.55 99.36 343.6 99.66
250 244.75 200 437.68 98.41
440.89 99.13 440.04 98.94
250 244.75 300 545.11 100.06
542.68 99.62 543.21 99.71
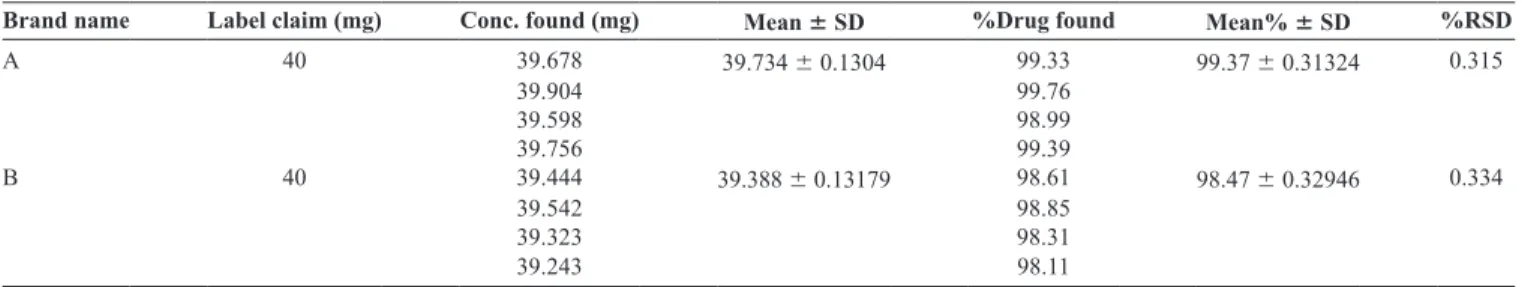
Table 3: Estimation of artemether in capsule dosage form
Brand name Label claim (mg) Conc. found (mg) Mean 6 SD %Drug found Mean% 6 SD %RSD A 40 39.678 39.734 6 0.1304 99.33 99.37 6 0.31324 0.315
39.904 99.76
39.598 98.99
39.756 99.39
B 40 39.444 39.388 6 0.13179 98.61 98.47 6 0.32946 0.334
39.542 98.85
39.323 98.31
39.243 98.11
Shrivastava, et al. J Young Pharm. 2010;2(1): 79-84 The calculation was done by using the formula:
Artemether content (mg) 5 (Area test/Area
std) 3 (100/10) 3 (0.5/10) 3 (50/wt capsule
powder) 3 (potency of std/100) 3 (average wt powder/cap)
Forced degradation studies
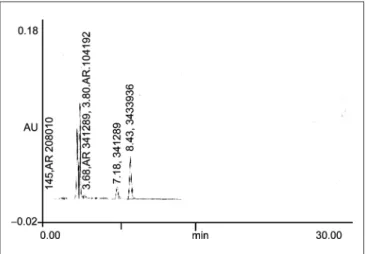
Acid hydrolysis
0.5 ml of a standard stock solution (10 mg/ml) was transferred to a 10 ml volumetric flask and in this 1 ml of 0.01 N HCl, volume was made to about 5 ml with mobile phase and heated on the water bath at 60ºC for 3 hours. Flask was then cooled to room temperature and diluted up to mark with mobile phase. Solution was then filtered through 0.45 mm filter, and 20 ml solution was injected
[Figure 1].
Alkaline hydrolysis
0.5 ml of standard stock solution (10 mg/ml) was transferred to 10 ml volumetric flask and in this 1 ml of 0.001 N NaOH, volume was made to about 5 ml with
Figure 1: Chromatogram obtained after treating a 0.5 ml of the standard
stock solution with 1 ml of 0.01 N HCl at 608C for 3 h
Figure 2: Chromatogram obtained after treating a 0.5 ml of the standard
stock solution with 1 ml of 0.001 N NaOH at 608C for 6 h
Figure 4: Chromatogram obtained after heating drug at 608C for 24 h
mobile phase and heated on the water bath at 60ºC for 6 hours. Flask was then cooled to room temperature and diluted up to mark with mobile phase. Solution was then filtered through 0.45 mm filter and 20 ml solution was
injected [Figure 2].
Oxidation
0.5 ml of the stock solution (10 mg/ml) was taken in a 10 ml volumetric flask and 1 ml of 3% H2O2 was then added. The solution was then kept at room temperature for 18 h. The solution was then filtered through 0.45 mm
filter, and 20 ml solution was injected [Figure 3].
Thermal degradation
Dry heat
100 mg drug was taken in a 10 ml volumetric flask and heated in the oven at 608C for 24 h, diluted up to the mark
with the mobile phase. The solution was then filtered through 0.45 mm filter, and 20 ml solution was injected
[Figure 4].
Figure 3: Chromatogram obtained after treating a 0.5 ml of the standard
Figure 5: Chromatogram obtained after heating a 0.5 ml of stock
solution diluted to about 5 ml heated on the water bath at 1008C for 4 h
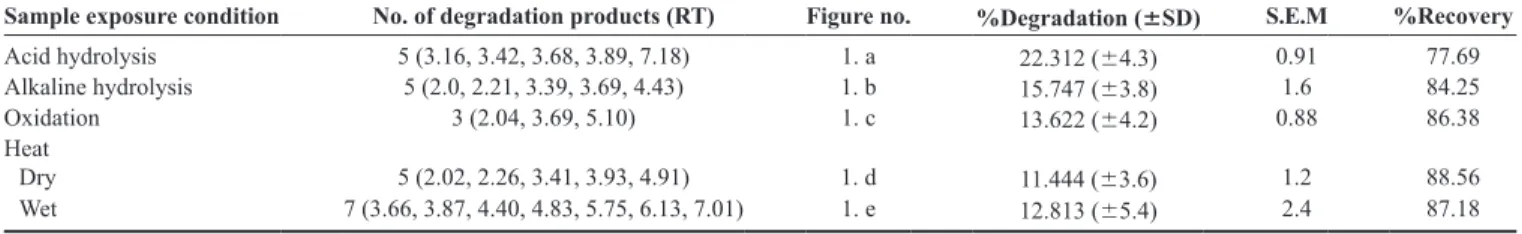
Table 4: Summary of results of forced degradation studies
Sample exposure condition No. of degradation products (RT) Figure no. %Degradation (6SD) S.E.M %Recovery Acid hydrolysis 5 (3.16, 3.42, 3.68, 3.89, 7.18) 1. a 22.312 (64.3) 0.91 77.69
Alkaline hydrolysis 5 (2.0, 2.21, 3.39, 3.69, 4.43) 1. b 15.747 (63.8) 1.6 84.25 Oxidation 3 (2.04, 3.69, 5.10) 1. c 13.622 (64.2) 0.88 86.38
Heat
Dry 5 (2.02, 2.26, 3.41, 3.93, 4.91) 1. d 11.444 (63.6) 1.2 88.56
Wet 7 (3.66, 3.87, 4.40, 4.83, 5.75, 6.13, 7.01) 1. e 12.813 (65.4) 2.4 87.18
Table 5: Summary of validation parameters
Linearity 250-750 (mg/ml); r5 0.9998 Range (mg/ml)
Linear range 250-750 Working range 21.831-750 Target range 400, 500 and 600 Target concentration 500 Precision (%RSD)
Repeatability 0.256
Intraday 0.642
Interday 0.712
Accuracy (%recovery) 99.36 LOD (mg/ml) 7.20445
LOQ (mg/ml) 21.8317
Wet heat
0.5 ml of the standard stock solution (10 mg/ml) of drug was transferred to a 10 ml volumetric flask and diluted with about 5 ml of the mobile phase and kept on water bath at 1008C for 4 h. The solution was then filtered
through 0.45 mm filter, and 20 ml solution was injected
[Figure 5].
UV treatment
0.5 ml of the standard stock solution (10 mg/ml) was transferred to a 10 ml volumetric flask, diluted to the mark, and kept in UV chamber overnight for 24 h. The solution was then filtered through 0.45 mm filter, and 20 ml solution
was injected, no degradation was observed.
CONCLUSION
The developed HPLC technique is precise, accurate, specific, and stability indicating. Statistical analysis proves that the method is repeatable and selective for the analysis of artemether as bulk drug and in pharmaceutical formulations. The summary of results of stability studies and validation parameters of method are presented in Tables 4 and 5 respectively. The method can be used to determine the purity of the drug available from various sources by detecting the related impurities. It may be extended to study the degradation kinetics of artemether and for its estimation in plasma and other body fluids. As the method separates the drug from potential degradation products in different storage conditions with the resolution of more than 1.5, it is stability indicating.
REFERENCES
1. Meshnick SR, Taylor TE, Kamchongwongpaisan S. Artemisinin and the antimalarial endoperoxides: From herbal remedy to targeted chemotherapy. Microbiol Rev 1996;60:301-15.
2. Klayman DL. Qinqhousu (Artemisinin): An antimalerial drug from China. Science n. 1985;228:1049-55.
3. Cumming JN, Ploypradath P, Posner GH. Antimalarial activity of artemisinin (qinghaosu) and related trioxanes: Mechanism(s) of action. Adv Pharmacol 1997;37:253-97.
4. Basco LK, Le Bras J. In vitro Activity of Artemisinin Derivatives Against African Isolates and Clones of Plasmodiumfalciparum. Am J Trop Med Hyg 1993;49:301-7.
5. Shrivastava A, Nagori BP, Saini P, Issarani R and Gaur SS. New Simple and Economical Spectrophotometric Method for Estimation of Artemether in Pharmaceutical Dosage Forms. Asian J. Research Chem 2008;1(1):19-21. 6. Monographs for antimalerial drug. International Pharmacopoeia. 187-196.
Available from: http://whqlibdoc.who.int/publications/2003/9241545364_ part4.pdf. As assessed on 19/07/07.
7. Thomas CG, Ward SA, Edwards G. Selective determination, in plasma, of artemether and its major metabolite, dihydroartemisinin, by high-performance liquid chromatography with ultraviolet detection. J Chromatogr 1992;583:131-6.
8. Chimanuka B, Gabriёls M, Detaevernier MR, Plaizier-Vercammen JA. Preparation of b-artemether liposomes, their HPLC-UV evaluation and relevance for clearing recrudescent parasitaemia in Plasmodiumchabaudi malaria-infected mice. J Pharm Biomed Anal 2002;28:13-22.
9. Muhia DK, Mberu EK, Watkins WM. Differential extraction of artemether and its metabolite dihydroartemisinin from plasma and determination by high-performance liquid chromatography. J Chromatogr B 1994;660:196-9.
Shrivastava, et al. J Young Pharm. 2010;2(1): 79-84
1999;731:251-60.
11. Karbwang J, Na-Bangchang K, Molunto P, Banmairuroi V, Congpuong K, Determination of artemether and its major metabolite, dihydroartemisinin, in plasma using high-performance liquid chromatography with electrochemical detection. J Chromatogr B 1997;690:259-65.
12. Tayade NG, Nagarsenker MS. Validated HPTLC method of analysis for artemether and its formulations. J Pharm Biomed Anal 2007;43:839-44. 13. Gabriёls M, Plaizier-Vercammen JA. Densitometric thin-layer chromato
graphic determination of artemisinin and its lipophilic derivatives, artemether and arteether. J Chromatogr Sci 2003;41:359-66.
14. Avery BA, Venkatesh KK, Avery MA. Rapid determination of artemisinin and related analogues using high-performance liquid chromatography and an evaporative light scattering detector. J Chromatogr B Biomed Sci Appl 1999;730:71-80.
15. ICH Q2B Guidline: Validation of Analytical Procedures Methodology. Link: Available from: http://www.ikev.org/haber/stabilite/kitap/36%20 1.8% 20% 20 Stability %20 Workshop %20 ICH%20Q2B%20C%20.pdf. As assessed on 14/04/07.
Source of Support: Nil, Conflict of Interest: None declared.
Staying in touch with the journal 1) Table of Contents (TOC) email alert
Receive an email alert containing the TOC when a new complete issue of the journal is made available online. To register for TOC alerts go to
http://www.jyoungpharm.in/signup.asp.
2) RSS feeds
Really Simple Syndication (RSS) helps you to get alerts on new publication right on your desktop without going to the journal’s website. You need a software (e.g. RSSReader, Feed Demon, FeedReader, My Yahoo!, NewsGator and NewzCrawler) to get advantage of this tool. RSS feeds can also be read through FireFox or Microsoft Outlook 2007. Once any of these small (and mostly free) software is installed, add