176
RESEARCH REGARDING THE DYNAMICS OF THE EU-27 POSITION IN
THE WINE MARKET
AGATHA POPESCU
University of Agricultural Sciences and Veterinary Medicine of Bucharest, 59 Marasti, District 1, Bucharest, 011464, Romania, Phone:+40213182564, Fax:+40213182888, Email:[email protected]
Keywords: consumption, EU-27, production, trade, wine
ABSTRACT
The results proved that the EU-27 is the main wine producer, exporter and importer in the world. It contributes by 60.96 % to global wine production, by 56.93 % to wine world consumption, by 69.49 % to the world export and by 59.74 % to the world wine import. In 2010, the EU-27 produced 16 Billion liters wine, exported 7.2 Billion liters and imported 5.8 Billion liters. About 45 % of wine production is exported and export/import ratio is 1.23 reflecting an efficient foreign trade. The continuous decline of its share at international level have enforced the EU to keep pace with the increased competition and to be focused mainly on wine production growth, quality, oenological technology and wine marketing.
INTRODUCTION
The EU has been and still is the main wine producer, exporter and importer in the world (Baldi, 2012).The development of the new markets in Americas, Oceania, South Africa and Asia has affected the EU’s share in the global wine market (Wine Annual Report, 2012).
The EU is facing with a wine overproduction, with a high wine consumption per inhabitant, with some less productive areas planted with vine, the small sized producers compared to the ones operating on other continents, the weak capacity to adapt to the fast market change. The Common Market Organization has involved a new wine reform aiming to increase the EU competitiveness in the international wine market (Baldi, 2012).
In this context, the paper aimed to analyze the dynamics of the EU-27 wine production, consumption, export and import, identifying the main trends and aspects which characterize its position and contribution to the development of wine market at global level.
MATERIALS AND METHODS
The paper was achieved based on the data collected from FAO Stat database, 2012 for the period 2000-2010. The data have been processed based on the use of share, index and comparison methods.
The main aspects approached in this study have been wine production, consumption, consumption per capita, exported and imported amount of wine and wine export and import value. The analysis was made at the EU level reflecting its market share at international level and also by EU member states, pointing out the EU countries situated on the top positions.
RESULTS AND DISCUSSIONS
The EU-27 wine production accounted for 16,083.8 Million liters in 2010, being by
177
In many EU countries, wine production registered a decline as follows: Belgium (-79 %), Cyprus (-74 %), France (- 20 %), Germany (-8.5 %), Greece (-8.5 %), Italy (-15.3 %), Hungary (-22.2 %), Portugal (-25 %), Romania (-9 %), Slovakia (-27 %), Spain
(-12 %).In a few EU countries, wine production increased as follows: United Kingdom (+84.6 %), Malta (+428.5 %), Slovenia (+79.6 %), Lithuania (+75 %), and Czech Republic
(+1.3 %).
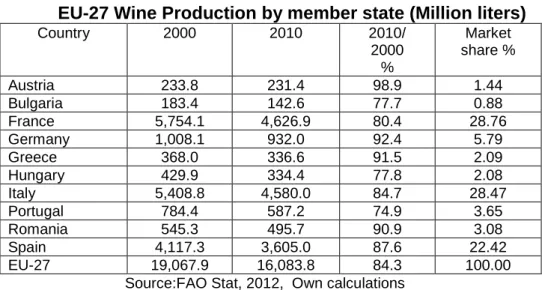
The 10 EU largest wine producers are: France with 28.76 % market share, Italy with 28.47 %, Spain 22.42 %, Germany 5.79 %, Portugal 3.65 %, Romania 3.08 %, Greece 2.09 %, Hungary 2.08 %, Austria 1.44 % and Bulgaria 0.88 %. Therefore, France, Italy and Spain are in the top, their wine production totalizing 12,812.9 Million liters in 2010, representing 79.66 % of the EU wine production (Table 1).
Table 1 EU-27 Wine Production by member state (Million liters)
Country 2000 2010 2010/
2000 %
Market share %
Austria 233.8 231.4 98.9 1.44
Bulgaria 183.4 142.6 77.7 0.88
France 5,754.1 4,626.9 80.4 28.76
Germany 1,008.1 932.0 92.4 5.79
Greece 368.0 336.6 91.5 2.09
Hungary 429.9 334.4 77.8 2.08
Italy 5,408.8 4,580.0 84.7 28.47
Portugal 784.4 587.2 74.9 3.65
Romania 545.3 495.7 90.9 3.08
Spain 4,117.3 3,605.0 87.6 22.42
EU-27 19,067.9 16,083.8 84.3 100.00
Source:FAO Stat, 2012, Own calculations
In 2010, the EU contributed by 60.96 % to the world wine production, and this placed it on the top position. However, its market share was lower in 2010, compared to 67.31 % performed in the year 2000, because the development of production in other countries from Americas, Africa, Oceania and Asia.
France is the largest wine producer in the world producing 4,627 Million liters, with
17.5 % market share in 2010, followed by Italy with 17.4 % and Spain with 13.7 % (Baldi
S., 2012). Germany produced 932 Million liters, placing it on the 4th position in the EU in
2010 and on the 7th position in the top wine producers in the world, its market share being
3.5 %. Portugal comes on the 5th position in the EU and on the 10th position in the world in 2010, with 587.2 Million liters wine production, representing 2.2 % of world production.
Romania comes on the 6th position as wine producer in the EU-27 with 495.7 Million liters
in 2010 and a market share of 3.08 %.
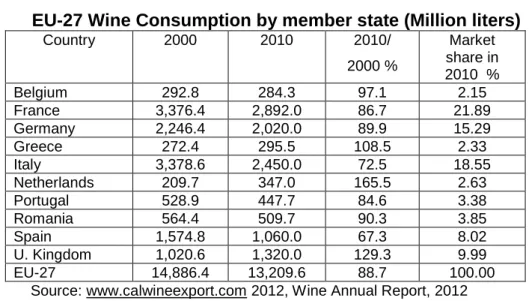
The EU wine consumption decreased by 11.3 % from 14,886.4 Million liters in
178
Table 2 EU-27 Wine Consumption by member state (Million liters)
Country 2000 2010 2010/
2000 %
Market share in 2010 %
Belgium 292.8 284.3 97.1 2.15
France 3,376.4 2,892.0 86.7 21.89
Germany 2,246.4 2,020.0 89.9 15.29
Greece 272.4 295.5 108.5 2.33
Italy 3,378.6 2,450.0 72.5 18.55
Netherlands 209.7 347.0 165.5 2.63
Portugal 528.9 447.7 84.6 3.38
Romania 564.4 509.7 90.3 3.85
Spain 1,574.8 1,060.0 67.3 8.02
U. Kingdom 1,020.6 1,320.0 129.3 9.99
EU-27 14,886.4 13,209.6 88.7 100.00
Source: www.calwineexport.com 2012, Wine Annual Report, 2012
The EU-27 wine consumption/inhabitant registered a similar trend like total wine
consumption. At the EU level, the average consumption/capita accounted for 26.36 liters in 2010, being by 15 % lower than 30.83 liters in the year 2000. The average wine consumption/inhabitant in the EU is definitely higher than 3.47 liters/capita at world level. In 2010, the highest consumption/capita was recorded in: Luxembourg 52.5 liters, France 47.7 liters, Italy 42.2 liters, Portugal 41.8 liters, Slovenia 36.4 liters, Denmark 35.1 liters, Austria 29.3 liters, Belgium 27.3 liters, Spain 26.2 liters and Germany 24.5 liters. The lowest wine consumption per capita was noticed in: Poland 2 liters, Lithuania 5.3 liters, Latvia 5.7 liters, Estonia 10 liters, Bulgaria 11.1 liters and Finland 11.5 liters. The highest increase was registered in: Malta (6 times higher), Czech Republic (3 times higher), Estonia (+70 %), Netherland (+74.7 %), Sweden (+62.5 %), Finland (+47 %), Ireland (+47 %), United Kingdom (+38.5 %), Greece (+22 %), Slovenia (+20 %), Poland (+11 %), Slovakia (+10 %). On the contrary, in Spain, Italy, Hungary, Portugal was noticed the highest reduction of wine consumption per capita (Wine Institute.org; Per capita wine consumption by country, 2010).
The EU-27 wine exported quantity has increased by 60.3 % in the analyzed
period from 4,522.4 Million liters in 2000 to 7,251.9 Million liters in 2010. Many of the EU countries are wine exporters, but the largest wine exporting countries in the decreasing order, have been: Italy with 33.43 % market share, Spain with 27.02 %, France with 21.50 %, Germany with 5.87 % and Portugal with 3.85 %. In 2010, these 5 EU countries exported 6,650.5 Million liters wine, representing 91.70 % of the EU wine. The highest increase of wine exported amount was noticed in case of Lithuania, whose export was 578 times higher in 2010 than 10 years ago. Then it was noticed a 360 times increase in Poland’s wine export, 122 times in Latvia, 166 times in Ireland, 310 times in Finland and 260 times in Estonia.
Table 3 EU-27 Wine Export (quantity) (Million liters)
Country 2000 2010 2010/
2000 %
Market share %
France 1,482.5 1,561.0 105.3 21.50
Germany 241.4 426.0 176.5 5.87
Italy 1,467.5 2,424.6 165.2 33.43
Portugal 187.6 279.7 149.1 3.85
Spain 777.3 1,959.2 252.0 27.02
EU-27 4,522.4 7,251.9 160.3 100.00
179
The EU is the top wine producer but also exporter in the world. In 2010, its contribution to the global wine export was 69.49 % compared to 68.20 % in 2000. In 2010, the EU exported 13.5 Million hl bottled wine, 4.8 Million hl bulk and 1.9 Million hl sparkling wine (Global Trade Atlass). In 2010, the main trade partners for EU wine exports were the following ones: USA (4.65 Million hl), Russian Fed. (3.95 Million hl), Switzerland (1.69 Million hl), Canada (1.67 Million hl), China (1.50 Million hl), Japan (1.20 Million hl), Norway (0.55 Million hl), Brazil (0.29 Million hl).
Italy, Spain and France are top wine exporters in the world in 2010, all together exported 30.6 Million hl wine, representing 49 % of the global wine export. Also, Germany and Portugal came on the 8th and 10th positions in the global hierarchy, having 3.6% and, respectively 2.5 % market share.
The EU-27 wine imported amount has grown by 57.7 % from 3,737.4 Million liters
in the year 2000 to 5,894 Million liters in 2010. The EU contributed by 59.74 % to the world wine import being the top wine importer in the world. The highest growth rate of wine import was registered in Romania (19 times), Hungary (8 times), Cyprus (8 times), Malta (5 times), Lithuania (5 times), Slovakia (2.9 times) and Czech Rep (2.7 times). Only 3 EU countries: Luxembourg, Portugal and Slovenia decreased their wine import.
Table 4 EU-27 Wine Import (quantity) (Million liters)
Country 2000 2010 2010/
2000 %
Market share %
Belgium 255.2 316.5 124.0 5.36
France 435.0 585.6 148.4 10.95
Germany 992.2 1,572.4 158.5 26.67
Netherlands 201.4 402.4 199.8 6.82
U. Kingdom 887.8 1,385.8 156.1 23.51
EU-27 3,737.4 5,894.0 157.7 100.00
Source: FAO Stat, 2012, Own calculations
The top EU wine importing countries were: Germany (26.67 %), United Kingdom (23.51 %), France (10.95 %), Netherlands (6.82 %), Belgium (5.36 %). Their import accounted for 4.322.7 Million liters representing 73.34 % of the EU wine import. Germany, United Kingdom, France, Netherlands and Belgium are on the 1st, 2nd, 5th, 7th and, respectively, 8th position in the world. All these EU countries imported 37.5 Million hl wine in 2010, representing 38 % of global wine import (Table 4). The main EU wine suppliers have been and will continue to be: Australia (3.5 Million hl), South Africa (2.87 Million hl), USA (2.78 Million hl), Argentina (0.6 million hl) and New Zeeland (0.58 Million hl).
Table 5 EU-27 Wine Export (USD Million)
Country 2000 2010 2010/
2000 %
Market share in 2010 %
France 5,044.4 8,392.1 166.4 42.38
Germany 352.3 1,139.6 323.5 5.75
Italy 2,229.6 5,170.6 231.9 26.11
Portugal 469.0 806.7 172.0 4.07
Romania 17.7 17.0 96.0 0.08
Spain 1,126.1 2,453.3 217.8 12.39
EU-27 9,845.1 19,801.0 201.1 100.00
180
The EU wine export value accounted for USD 19,801 Million, representing 68.01
% of the global wine export value. All the EU states registered an increase, except Cyprus and Romania.
The highest growth rate of wine export value was recorded in Lithuania (434 times), Finland (23.6 times), Latvia (28 times), Estonia (49 times), Czech Republic (11.6 times), Ireland (12.3 times), and Poland (33.5 times).
In Cyprus wine export value declined by 48 %, while in Romania it decreased only by 4 %. The top countries based on wine export value are France (42.38 %), Italy (26.11 %), Spain (12.39 %), Germany (5.75 %) and Portugal (4.07 %).
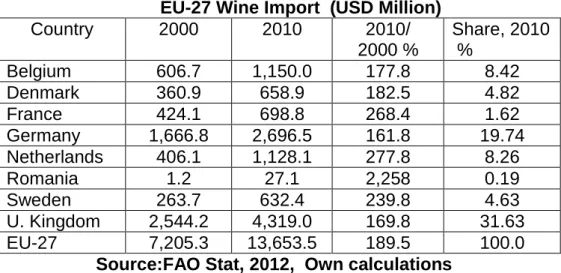
The EU-27 wine import value increased by 89.5 % in the analyzed period from
USD 7,205.3 Million in 2000 to USD 13,653.5 Million in 2010. The EU wine import value represented 45.55 % placing it among the top wine importer in the world (Table 6)
Table 6 EU-27 Wine Import (USD Million)
Country 2000 2010 2010/
2000 %
Share, 2010 %
Belgium 606.7 1,150.0 177.8 8.42
Denmark 360.9 658.9 182.5 4.82
France 424.1 698.8 268.4 1.62
Germany 1,666.8 2,696.5 161.8 19.74
Netherlands 406.1 1,128.1 277.8 8.26
Romania 1.2 27.1 2,258 0.19
Sweden 263.7 632.4 239.8 4.63
U. Kingdom 2,544.2 4,319.0 169.8 31.63
EU-27 7,205.3 13,653.5 189.5 100.0
Source:FAO Stat, 2012, Own calculations
The highest growth rate for wine import value was recorded in Romania (22.5 times), Hungary (9.7 times), Lithuania (9.2 times), Cyprus (5.5 times), Bulgaria (5.4 times), Czech Republic (6 times), Poland (4.2 times), Malta (3.7 times), Latvia (3.7 times).
Based on the wine import value, the top 10 EU countries and their market share are: United Kingdom 31.63 %, Germany 19.74 %, Belgium 8.42 %, Netherlands 8.26 %, France 5.11 %, Denmark (4.82 %) and Sweden 4.63 % (Table 6).
Table 7 EU-27 Wine Production, Export, Import, Consumption in 2000 and 2010
Country MU 2000 2010 2010/
2000 %
Share, 2010 %
Production Mil. Liters 19,068 16,084 84.4 60.9
Export Mil. Liters 4,523 7,252 160.3 69.5
Import Mil. Liters 3,737 5,894 1,577 59.7
Consumption Mil. Liters 14,886.4 13,209.6 88.7 56.9
Consumption per capita
Liter/ Capita
30.836 26.36 85.5 759.6
Export value USD Mil. 9,845 19,801 201.1 68.0
Import value USD Mil. 7,205 13,653.5 189.5 45.5
Export/ Production
- 0.24 0.45 187.5 -
Export/ Import
- 1.24 1.23 101.6 -
Consumption/ Production
181
CONCLUSIONS
The EU is the major wine producer, exporter and importer in the world. Its contribution to the world wine production was 16 Billion liters, representing 60.06 % of world wine production in 2010. In the same year, the EU exported 7.2 Billion liters wine, whose value accounted for USD 19.8 USD Billion, representing 68.01 % of the global wine export value. The EU wine import was 5.8 Billion liters, with a value of USD 13.6 Billion, representing 45.55 % of the global wine import value. About 45 % of wine production was exported in 2010 compared to 24 % in the year 2000. The export/import ratio increased by 1.6 % from 1.21 % in the year 2000 to 1.23 % in the year 2010, reflecting an increasing efficiency in the EU’s wine international trade. The consumption share in wine production increased from 78.07 % in the year 2000 to 82.12 % in 2010.
In order to keep pace with the increased competitiveness in the international market, the EU has to improve production growth, oenological technologies, wine quality and marketing.
BIBLIOGRAPHY
Baldi, S., 2012, EU-27 Wine Annual Repot and Statistics. USDA Foreign
Agricultural Service.
FAO Stat, 2012, www.fao.oreg.
Wine Annual Report, 2012, www.calwineexport.com
Wine Institute, Per capita wine consumption by country, 2010,
www.wineinstitute.org