Lab Validation
Report
IBM System Storage DS3500 Express
Mixed Workload Performance with Application Aware Data Management
By Brian GarrettFebruary 2011
Contents
Introduction ... 3
The Challenges ... 3
The Solution ... 4
The Results... 5
ESG Lab Validation ... 6
Mixed Workload Storage Performance Testing ... 6
Test Bed ... 7
Workloads ... 8
Results ... 9
Application Aware Storage and Data Management ... 16
ESG Lab Validation Highlights ... 19
Issues to Consider ... 19
The Bigger Truth ... 20
Appendix ... 21
All trademark names are property of their respective companies. Information contained in this publication has been obtained by sources The Enterprise Strategy Group (ESG) considers to be reliable but is not warranted by ESG. This publication may contain opinions of ESG, which are subject to change from time to time. This publication is copyrighted by The Enterprise Strategy Group, Inc. Any reproduction or redistribution of this publication, in whole or in part, whether in hard-copy format, electronically, or otherwise to persons not authorized to receive it, without the express consent of the Enterprise Strategy Group, Inc., is in violation of U.S. Copyright law and will be subject to an action for civil damages and, if applicable, criminal prosecution. Should you have any questions, please contact ESG Client Relations at (508) 482.0188.
ESG Lab Reports
The goal of ESG Lab reports is to educate IT professionals about emerging technologies and products in the storage, data management and information security industries. ESG Lab reports are not meant to replace the evaluation process that should be conducted before making purchasing decisions, but rather to provide insight into these emerging technologies. Our objective is to go over some of the more valuable feature/functions of products, show how they can be used to solve real customer problems and identify any areas needing improvement. ESG Lab's expert third-party perspective is based on our own hands-on testing as well as on interviews with customers who use these products in production environments. Although this report may utilize publicly available material from various vendors, including IBM, it does not necessarily reflect the positions of such vendors on the issues addressed in this report. This ESG Lab report was funded by IBM Corporation.
Introduction
This ESG Lab report explores the capabilities of an IBM System Storage DS3500 Express deployed in a consolidated virtual server environment with a focus on the value of predictably balanced mixed application performance and application aware storage management plug-ins.
The Challenges
A worldwide wave of server and storage consolidation is reducing the cost and complexity of delivering IT services to the business. Consolidation is clearly a priority as a growing number of organizations embrace server virtualization technology. In a recent survey, ESG asked IT decision makers to list their top priorities over the next 12-18 months.1
Figure 1
As shown in , increased use of server virtualization, data growth management, and data center consolidation were all top priorities.
Figure 1. Top 2011 IT Priorities
Source: Enterprise Strategy Group, 2011. However, despite the broad success of server virtualization, nagging issues and challenges exist. As a result, a low percentage of the potential workloads that can be virtualized have been migrated to virtual machines, and the consolidation ratios of virtual machines per physical server remains relatively low. A recent ESG survey explored the storage challenges associated with the next wave of server virtualization.2
Consolidation and server virtualization are changing the way that IT infrastructure is managed. Managing IT infrastructure from a centralized virtual server console is simplifying the process of deploying new applications. Storage system management tools need to be integrated with the virtual server management interface and higher level application management frameworks to increase the value of a centrally managed IT infrastructure.
Given the rapid growth in the number of virtual machines being deployed, it’s no surprise that scalability, performance, and the overall volume of storage capacity have been identified as key challenges.
1 Source: ESG Research Report
2 Source: ESG Research, 2010 Server Virtualization Survey, September 2010.
20% 21% 21% 22% 23% 24% 24% 30%
0% 5% 10% 15% 20% 25% 30% 35%
Business continuity/disaster recovery programs Data center consolidation Desktop virtualization Improve data backup and recovery Major application deployments or upgrades Information security initiatives Manage data growth Increase use of server virtualization
Which of the following would you consider to be your organization’s most important IT priorities over the next 12-18 months? (Percent of respondents, N=611,
The Solution
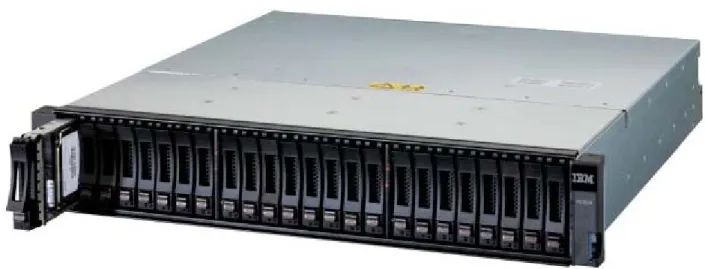
The IBM System Storage DS3500 Express is a modular data storage system with balanced mixed workload performance and a rich set of application aware management tools. The DS3500 uses the latest 6 Gbps Serial Attached SCSI (SAS) interface for the back-end connection to disk drives and a rich set of front-end server connectivity options. The iSCSI host attach option leverages the affordability and ubiquity of industry standard Ethernet technology. The high performance 8 Gbps Fibre Channel (FC) host attach option provides connectivity for applications with high performance and availability requirements. SAS, which has traditionally been used for an affordable connection to entry level disk arrays (often referred to as just a bunch of disks, or JBOD), is also supported for high speed, low cost host connectivity.
Figure 2. Introducing the IBM System Storage DS3500 Express
Supporting up to 4 GB/sec of throughput and 40,000 IOPS, the key capabilities of the DS3500 include:
• Four native 6 Gbps SAS host interfaces.
• Up to eight additional 1 Gbps iSCSI host interfaces.
• Up to eight additional 8 Gbps FC host interfaces.
• Up to four additional 6 Gbps SAS interfaces.
• Up to 96 high-speed SAS, cost-effective nearline SAS, self encrypting, or solid state drives.
• 3.5 and 2.5 inch drive enclosures.
• Up to 4 GB of cache.
• Advanced recovery capabilities, including snapshots and volume copies.
• Advanced availability capabilities, including dual controllers and remote replication.
A growing set of application aware management plug-ins provide tight integration with management tools from Microsoft, VMware, Oracle and others. Plug-ins simplify the management of DS3500 storage with built-in provisioning, monitoring, event management, and advanced data recovery. A growing set of management
frameworks are supported, including VMware vSphere, Microsoft Systems Center Operations Manager (SCOM), and Oracle Enterprise Manager.
The Results
This report documents the performance and application management capabilities of IBM System Storage DS3500 Express. Performance testing with a mix of real-world applications in a VMware vSphere-enabled virtual server environment and mix of management framework plug-ins explores how:
• A single IBM System Storage DS3500 Express with 88 10K RPM SAS drives attached to a pair of powerful multi-core servers running a mix of real-world application workloads in 16 virtual machines supports up to:
20,458 mailboxes using the Microsoft Exchange 2010 Jetstress utility
and 3,724 database IOs per second for small OLTP IOs with the Oracle Orion utility and 856 MB/sec of throughput for large OLAP Oracle Orion operations
and 3,490 simulated web server IOPs
and 1,260 MB/sec of throughput for simulated backup jobs with predictably fast response times and scalability.
• Management tools were examined with a goal of confirming that provisioning, monitoring, and protecting
application data residing on an DS3500 storage system can be simplified with application aware capabilities including:
vCenter vSphere Plug-in.
Oracle Enterprise Manager Plug-in.
Site Recovery Adapter(SRA) for VMware Site Recovery Manager (SRM).
Integration with Microsoft Disbursed Cluster Storage Failover (DCSF).
Management Pack for Microsoft Systems Center Operations Manager (SCOM).
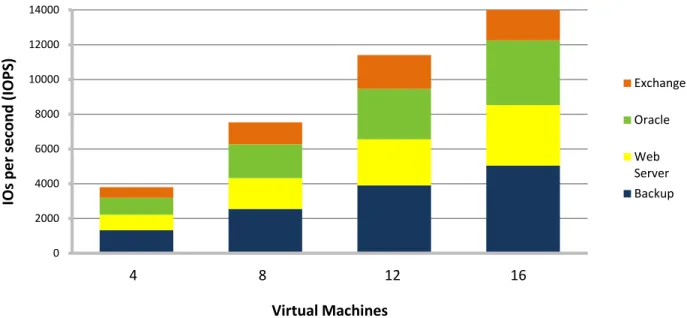
The predictably fast, mixed workload performance scalability of the virtualized environment tested by ESG Lab is summarized in Figure 3. The results will be explored in detail later in this report, but for now it should be noted that the performance of the DS3500 scaled well as a mix of real-world application workloads run in parallel on up to 16 virtual machines.
Figure 3. DS3500 Mixed Workload Scalability
The balance of this report explores how the tests were accomplished, what the results mean, and why they matter to your business.
0 2000 4000 6000 8000 10000 12000 14000
1 2 3 4
IOs pe r s ec ond (I O PS ) Virtual Machines Exchange Oracle Web Server Backup
ESG Lab Validation
The real-world performance capabilities of the DS3500 storage system were assessed by ESG Lab. The methodology presented in this report was designed to assess the mixed workload performance and manageability of a DS3500 in virtual server and consolidated application environments.
Mixed Workload Storage Performance Testing
Conventional server benchmarks were designed to measure the performance of a single application running on a single operating system inside a single physical computer. SPEC CPU2000 and CPU2006 are well known examples of this type of server benchmarking tool. Much like traditional server benchmarks, conventional storage system benchmarks were designed to measure the performance of a single storage system running a single application workload. The SPC-1 benchmark, developed and managed by the Storage Performance Council, is a great example. SPC-1 was designed to assess the performance capabilities of a single storage system as it services an online
interactive database application.
Traditional benchmarks running a single application workload can’t help IT managers understand what happens when a mix of applications are deployed together in a virtual server environment. To overcome these limitations, VMware created a mixed workload benchmark called VMmark. VMmark uses a tile-based scheme for measuring application performance and provides a consistent methodology that captures both the overall scalability and individual application performance of a virtual server solution. VMmark measures performance as a mix of application workloads are run in parallel within virtual machines deployed on the same physical server.
The novel VMmark tile concept is simple, yet elegant. A tile is defined as a mix of industry standard benchmarks that emulate common business applications (e.g., e-mail, database, web server). The number of tiles running on a single machine is increased until the server runs out of performance. A score is derived so that IT managers can compare servers with a focus on their performance capabilities when running virtualized applications.
While VMmark is well suited for understanding the performance of a mix of applications running on a single server, it was not designed to assess what happens when a mix of applications is run on multiple servers sharing a single storage system. VMmark tends to stress server internals more than it does the storage system. The methodology developed by ESG Lab and presented in this report was designed to stress the storage system more than the servers. Taking a cue from the VMmark methodology, a tile-based concept was used. Each tile is composed of a mixture of four application workloads. Two physical servers, each configured with eight virtual machines, were used to measure performance as the number of active tiles was increased from one to four.
VMmark testing is performed with a single server, often attached to multiple storage systems. When server vendors publish VMmark results, they make sure there is plenty of storage available so they can record the highest VMmark score. This provides IT managers with a fair comparison of the performance capabilities of competitive server technologies.
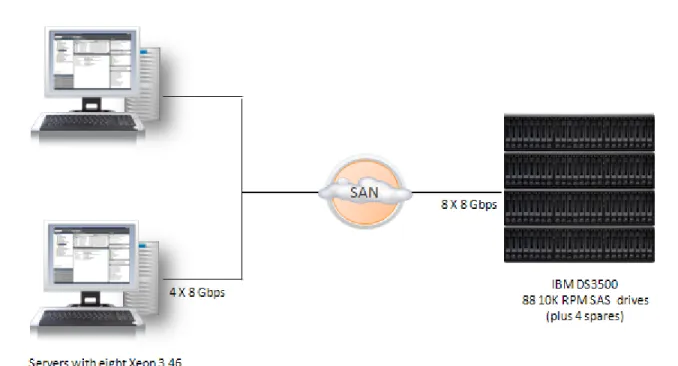
As shown in Figure 4, ESG Lab storage-focused benchmarking uses a different approach. Instead of testing with a single server and more than enough storage, multiple servers are attached to a single storage system. Rather than running application-level benchmarks which stress the CPU and memory of the server, lower level industry standard benchmarks are used with a goal of measuring the maximum mixed workload capabilities of a single storage system.
Figure 4. Server-focused VMmark vs. Storage-focused ESG Lab Benchmarking
Test Bed
VMware vSphere version 4.1 was installed on a pair of servers, each with a pair of quad-core processors and a pair of dual-port host adapters. A DS3500 storage system with 88 10K RPM SAS drives was connected to the servers through a pair of 8 Gbps FC switches, as shown in Figure 5.
Workloads
Industry standard benchmarks were used to emulate the IO activity of four common business application workloads:
• E-Mail: The Microsoft Jetstress 2010 utility was used to generate e-mail traffic. Similar to the Microsoft
LoadGen utility used in the VMmark benchmark, Jetstress simulates the activity of typical Microsoft Exchange users as they send and read e-mails, make appointments, and manage to-do lists. The Jetstress utility is, however, a more lightweight utility than LoadGen. Using the underlying Jet Engine database, Jetstress was designed to focus on storage performance.
• Database: The Orion utility from Oracle was used to generate database traffic. Much like Jetstress, Orion is
a lightweight tool that is ideally suited for measuring storage performance. Orion was designed to help administrators understand the performance capabilities of a storage system, either to uncover
performance issues or to size a new database installation without having to create and run an Oracle database. Orion is typically used to measure two types of database activity: response-time sensitive online transaction processing (OLTP) and bandwidth sensitive online analytic processing (OLAP).
• Web Server: The industry standard Iometer utility was used to generate web server traffic. The IO
definition was composed of random reads of various block sizes. The web server Iometer profile used for this test was originally distributed by Intel, the author of Iometer. Iometer has since become an open source project.3
• Backup: The Iometer utility was used to generate a single stream of large block sequential read traffic.
Operations that tend to generate this type of traffic include backup operations, scan and index operations, long running database queries, bulk data uploads, and copies. One 256 KB sequential read workload was included in each tile to add a throughput intensive component to the predominantly random IO profile of interactive e-mail, database, and web server applications. As most experienced database and storage administrators have learned, a throughput-intensive burst in IO traffic can drag down performance for interactive applications, causing performance problems for end-users. Adding a few streams of throughput-intensive read traffic was used to determine whether interactive performance would remain predictably responsive as the amount of mixed IO utilization increased.
Iometer tests were performed on Windows physical drives running over VMware raw mapped devices.
Each of the four workloads ran in parallel, with the Jetstress e-mail test taking the longest to complete (approximately three hours). Configuration details and the settings for each of the workload generators are documented in the appendix.
Why This Matters
ESG research indicates that storage scalability and performance are significant challenges for the growing number of organizations embracing server virtualization technology. Storage benchmarks have historically focused on one type of workload (e.g., database or e-mail) and one key performance metric (e.g., response time or throughput). Server benchmarks have typically tested only one server running a CPU-intensive workload that doesn’t stress storage. To help IT managers understand how a DS3500 performs in a virtual server environment, this benchmark was designed to assess how real-world applications behave when running on multiple virtualized servers sharing a single storage system.
Results
In a way, storage system benchmark testing is like an analysis of the performance of a car. Specifications, including horsepower and acceleration from 0 to 60, are a good first pass indicator of a car’s performance. But while
specifications provide a good starting point, there are a variety of other factors that should be taken into
consideration including the condition of the road, the skill of the driver, and gas mileage ratings. Much like buying a car, a test drive with real-world application traffic is the best way to determine how a storage system will perform.
Characterization
Performance analysis began with an examination of the low level aggregate throughput capabilities of the test bed. This testing was performed using the Iometer utility running within the eight virtual machines that were used later during mixed workload testing. The eight virtual machines accessed DS3500 storage through eight 8 Gbps FC interfaces.
Iometer access definitions, which measured the maximum throughput from disk, were used for this first pass analysis of the underlying capabilities of the DS3500.4
Figure 6
Similar to a dynamometer horsepower rating for a car, maximum throughput was used to quantify the power of a turbo-charged DS3500 storage engine. As shown in
, ESG Lab recorded a maximum throughput of 4.2 GB/sec. Figure 6. Characterizing the IBM DS3500 Storage Engine
What the Numbers Mean
• Much like the horsepower rating of a car, the throughput rating of a storage system is a good indicator of the power of a storage system’s engine.
• Storage throughput is a measure of the bandwidth available to the system. Throughput can be measured on a stream or aggregate basis. A stream is represented by one application or user communicating through one IO interface to one device. Aggregate throughput is a measure of how much data the storage system can move on a whole for all applications and users.
• ESG Lab recorded a peak aggregate throughput of 4.2 GB/sec in a VMware vSphere environment.
• When comparing the performance capabilities of two servers in a virtual server environment, the server with more cache tends to perform better. ESG Lab is confident that a similar pattern holds true for storage systems. A storage system with more cache—and better caching algorithms—should perform better in a virtual server environment.
• ESG Lab characterization testing indicates that the DS3500 has more than enough cache and front-end bandwidth to meet the needs of virtualized applications.
• ESG Lab is convinced that the caching algorithms of the DS3500 provide a significant performance boost during virtualized mixed application testing.
Why This Matters
A storage system needs a strong engine and well-designed modular architecture to perform predictably in a mixed real-world environment. One measure of the strength of a storage controller engine is its maximum aggregate throughput. ESG Lab testing of the DS3500 in a VMware vSphere environment achieved 4.2 GB/sec of aggregate large block sequential read throughput.
In ESG Lab’s experience, these are excellent results for a dual controller modular storage system. As a matter of fact, these results provide an early indication that the DS3500 is well suited for virtual server consolidation and mixed real-world business applications.
Virtual Machine Utilization
Mixed application testing began with a quick analysis of server CPU and RAM utilization to make sure that there were no bottlenecks between virtualized application workloads and the DS3500. As expected, utilization was manageably low on the physical servers during the busiest mixed workload test (3.2% CPU utilization and 32% memory utilization were observed at the vSphere client).
Mixed Real-world IOPS Scalability
IOs per second, or IOPS, is a measure of the number of operations a storage system can perform in parallel. When a system is able to move a lot of IOPS—from disk and from cache— it will tend to be able to service more applications and users in parallel. Much like the horsepower rating for a car engine, the IOPS rating for a storage controller can be used as an indicator of the power of a storage system engine.
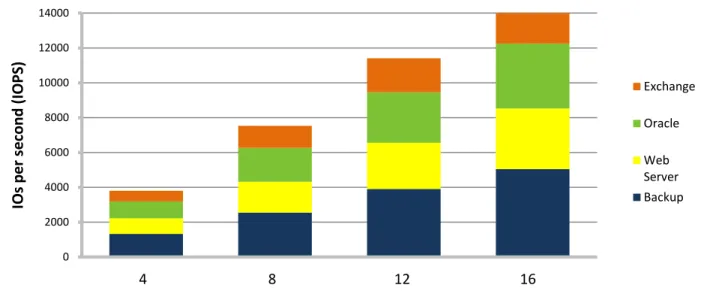
While IOPS out of a cache is typically a big number and can provide an indication of the speed of the front end of a storage controller, IOPS from disk is a more useful metric when determining the real-world performance of a storage system servicing a mix of business applications. For example, e-mail and interactive database applications tend to be random in nature and therefore benefit from good IOPS from disk. With that said, a mix of real-world applications tends to generate random and sequential IO traffic patterns that may be serviced from disk or from cache. ESG Lab measured IOPS performance as reported by the DS3500 as the number of virtual machines running mixed real-world application workloads increased from four through sixteen. With a mix of random and sequential IOs over 88 disk drives, the goal was not to record a big IOPS number; the goal with this exercise was an assessment of the scalability of the DS3500 as an increasing number of applications are consolidated onto a single virtualized platform. The IOPS scalability during the peak period of mixed workload activity is shown in Figure 7.
Figure 7. DS3500 Mixed Workload Scalability
What the Numbers Mean
• IOPS varied throughout the mixed workload test with peaks occurring during the Orion small IOPs phase and toward the end as the Jetstress utility performed a database consistency check.
• A peak of 14,709 IOPS was recorded during the four tile run.
• IOPS scaled well as mixed real-world application traffic increased from four through sixteen virtual servers. 0 2000 4000 6000 8000 10000 12000 14000
1 2 3 4
IOs pe r s ec ond (I O PS ) Virtual Machines Exchange Oracle Web Server Backup
Handling Throughput Spikes with Ease
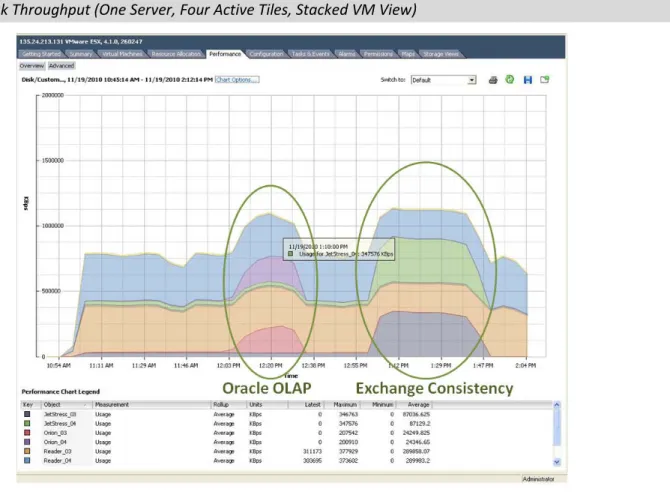
As noticed during IOPS monitoring, peaks of throughput activity could be correlated to the periodic behavior of real-world applications. Two bursts of aggregate throughput were observed: the first during the Oracle large MBPS test which simulates a throughput-intensive OLAP application and the second during the Jetstress database consistency check. A VMware vSphere view of mixed workload performance on one of the servers is shown in Figure 8.
Figure 8. Peak Throughput (One Server, Four Active Tiles, Stacked VM View)
What the Numbers Mean
• An aggregate throughput level of 2.1 GB/sec was recorded as mixed, real-world applications were run on 16 virtual machines sharing a single DS3500 storage system (1.1 GB/sec for one of the two physical servers is shown in Figure 8).
• As throughput intensified during the Oracle Orion OLAP test phase, bandwidth utilization for other mixed workloads operating in parallel remained steady.
Why This Matters
Predictable performance scalability is a critical concern when a mix of applications shares a storage system. A burst of IO activity in one application (e.g., a database consistency check) can lead to poor response times, lost
productivity, and, in the worst case, lost revenue.
ESG Lab confirmed that the balanced performance of the DS3500 scales predictably as a growing number of applications are consolidated in a virtual server environment.
Mixed Application Performance Scalability
Having looked at the IOPS and throughput ratings of the turbo-charged DS3500 engine, here’s where the rubber meets the road as we examine performance at the application level. The output from each of the industry standard benchmark utilities was analyzed to determine the performance scalability and responsiveness of real-world applications running in a consolidated virtual environment.
Microsoft Exchange
The IO and performance efficiency of Microsoft Exchange have improved significantly over the years. Architectural improvements in Exchange 2010, including a new store schema, larger page sizes (8 KB to 32 KB), improved
read/write coalescing, improved pre-read support, and increased cache effectiveness, have reduced the number of IOs per user up to 70% compared to Exchange 2007.5
The Microsoft Jetstress 2010 utility was used to see how many simulated e-mail users could be supported by the DS3500 during mixed workload testing. The number of IOPS and response time for each database and log volume was recorded at the end of each Jetstress run. A response time goal of 20 milliseconds or less for database reads is required to pass the test. These values are defined by Microsoft as a limit beyond which end-users will feel that their e-mail system is acting slowly.
ESG Lab typically uses a value of 0.5 IOPS per mailbox to emulate a heavy Exchange user environment when testing with Jetstress 2007. A value of 0.12 IOPS per mailbox was used during Jetstress 2010 testing to reflect the 70% reduction in IOPS compared to Exchange 2007.
6 The results are shown in Figure 9 and itemized in Table 1.
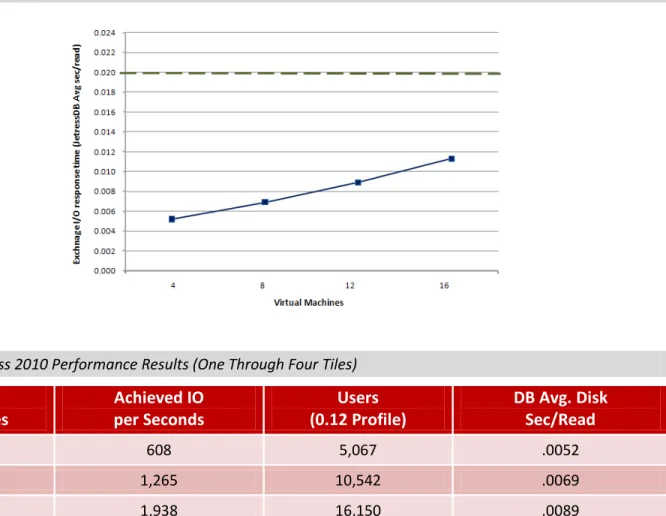
Figure 9. Mixed E-mail Scalability (Response Time)
Table 1. Jetstress 2010 Performance Results (One Through Four Tiles)
Virtual
Machines
Achieved IO
per Seconds
Users
(0.12 Profile)
DB Avg. Disk
Sec/Read
4 608 5,067 .0052
8 1,265 10,542 .0069
12 1,938 16,150 .0089
16 2,455 20,458 .0113
5
What the Numbers Mean
• The single tile mixed application test supported 5,067 Exchange users with an average DB disk response time of 5.2 milliseconds.
• Performance scaled to 20,458 users while the DS3500 was busy servicing other applications concurrently.
• As the number of simulated e-mail users was increased, the DS3500 provided excellent response times that are well within Microsoft’s guidelines. Note that response times for database reads are below the Microsoft recommended maximum of 20 milliseconds, which is shown as a dotted line in Figure 9.
• The IO efficiency improvements in Exchange 2010 reduce the cost of delivering e-mail support in mixed virtual server environments. In this case, ESG Lab supported up to 20,458 mailboxes on four virtualized Exchange 2010 servers in a mixed workload environment—more than twice the expected number of supported mailboxes within an Exchange 2007 environment.
Oracle
The Oracle Orion utility was used to measure small transfer (8 KB) response time and large transfer (1 MB)
throughput. The small transfer results are used to predict the performance and scalability of response time-sensitive interactive database applications (e.g., OLTP). The large transfer results are used to predict the performance of throughput-intensive online analytical processing (OLAP) and decision support systems (DSS).
ESG used the following guidelines from an Oracle OpenWorld presentation to interpret the results: Target 5-10 millisecond for response time critical IO. Start by assuming 30 IOPS per disk for OLTP and 20 MB/sec per disk in DSS. This is way below the theoretical value, but allows for media repair etc.7
For new or non-existing applications, use business rules or data model transaction profiles flow to understand what a transaction is and then extrapolate for transactions per second or hour. Optionally, you can use the numbers we have seen in our consulting gigs. Note that these are just guideline values. Use the following as basic guidelines for OLTP:
Low transaction system – 1,000 IOPS or 200 MB/sec Medium transaction system – 5,000 IOPS or 600 MB/sec
High-end transaction system – 10,000 IOPS or 1 GB/sec (rarely achievable)8
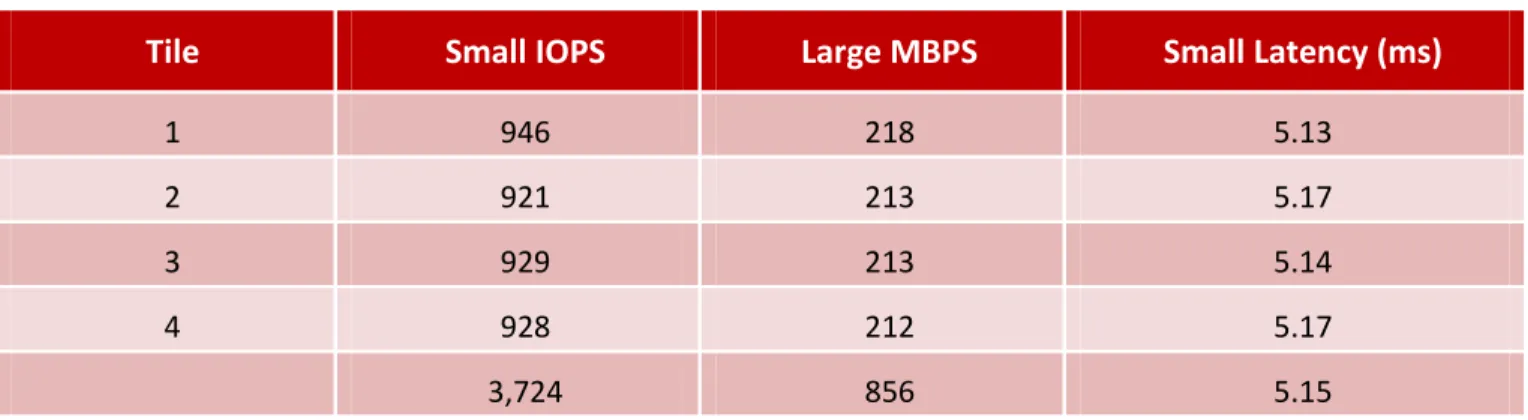
The results for the four tile Orion test are summarized in Table 2. A sample Orion report is shown in the Appendix. Table 2. Orion Four Tile Performance Results
Tile
Small IOPS
Large MBPS
Small Latency (ms)
1 946 218 5.13
2 921 213 5.17
3 929 213 5.14
4 928 212 5.17
3,724 856 5.15
7Current trends in Database Performance, Andrew Holdsworth, Oracle OpenWorld, November 2007.
What the Numbers Mean
• The four tile test achieved a grand total of 3,724 small IOPS and 856 large MBPS while the system was simultaneously running a mix of real-world application workloads.
• Using Oracle’s back of the envelope sizing guidelines, this level of IO activity falls between the performance guidelines for a “low transaction system” and a “medium transaction system.”
• The total number of small IOPS processed during the busy four tile test yielded a rate of 53.5 small IOPS per drive, which exceeds the conservative Oracle planning guideline of 30 IOPS per drive.
• Orion reported an average latency of 5.15 milliseconds for the small IOPs workload. Given the Oracle guidance of 5 to 10 milliseconds, ESG Lab believes that these are excellent results—especially given the mix of IO-intensive workloads being serviced by the DS3500 in parallel.
Web Server and Backup Reader
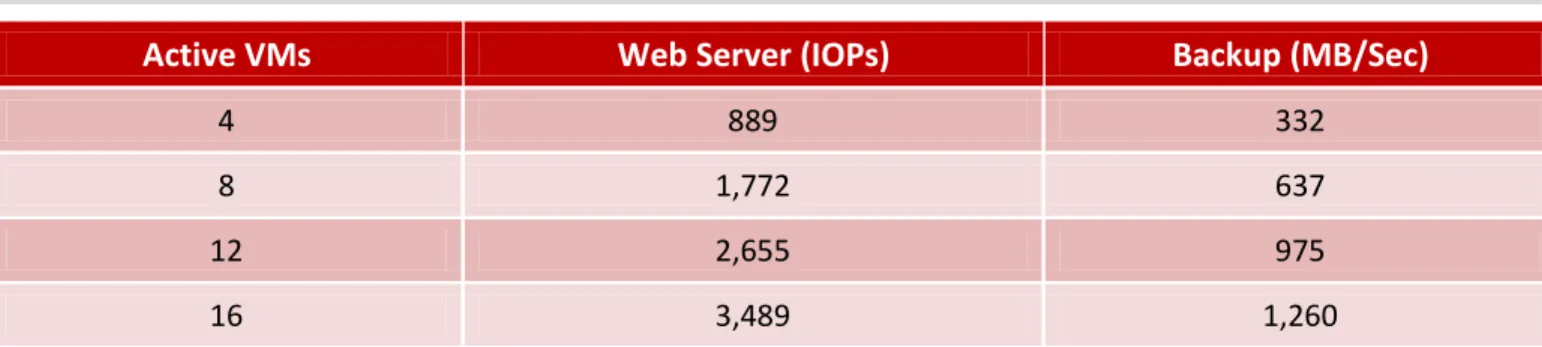
Performance results as reported by the Iometer utility for the web server and backup workloads during the one, two, three, and four tile tests are listed in Table 3.
Table 3. Iometer Four Tile Performance Results
Active VMs
Web Server (IOPs)
Backup (MB/Sec)
4 889 332
8 1,772 637
12 2,655 975
16 3,489 1,260
What the Numbers Mean
• Performance scaled in a nearly linear fashion as the number of virtual machines running in parallel was scaled from four to sixteen.
• Given the cache friendly, read-only nature of web server IO traffic, ESG Lab believes that these results indicate that the DS3500 has the horsepower required to service tens of thousands of simultaneous page requests.
• Each of the four backup streams sustained at least 300 MB/sec of throughput for the entire duration of the mixed workload test. A stream of this magnitude could service the data needs of a number of simultaneous backup jobs, a very aggressive scan and index job, or a throughput-intensive database table scan.
Much like the electrical system in your home, figuring out how many appliances you can run in parallel before blowing a fuse is not a function of the number of wires behind the walls. What matters more is the design of the circuits used to distribute the right amount of power to appliances. ESG Lab testing indicates that the DS3500 engine delivers the right amount of power to virtualized applications when needed.
Why This Matters
Excessive downtime and slow response time can result in the loss of sales, loss of customer goodwill, loss of productivity, loss of competitiveness, and increased costs. With more and more companies running entire suites of business applications on virtualization solutions like VMware, mixed workload scalability with predictable
performance is needed. ESG Lab testing confirmed that the DS3500 can sufficiently handle a very large number of Exchange users—even as it services other applications and thousands of users with predictably fast response times.
Application Aware Storage and Data Management
The IBM System Storage DS3500 Express supports a growing number of application aware plug-ins. The plug-ins are available as a free download for a number of popular application-level management, high availability, and recovery frameworks, including the VMware vSphere Client, Microsoft System Center Operation Manager (SCOM), and Oracle Enterprise Manager. ESG Lab confirmed that each of the plug-ins can be used to monitor, provision, and
troubleshoot the storage system from an application perspective. Figure 10. Application Aware Storage and Data Management
As shown in Figure 11, ESG Lab confirmed that application aware plug-ins can be used to monitor, provision, and troubleshoot the storage system from a virtual server management console.
In this example, DS3500 storage capacity is being monitored from the VMware vSphere client. Note how storage system specific information including the number of hot spares can be monitored without having to switch to the DS3500 management console.
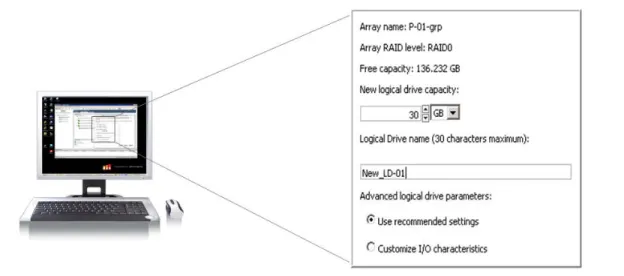
Application aware storage can not only be used to passively monitor DS3500 storage systems, it can also be used to actively change storage system settings. In the screen shot shown in Figure 12, a new logical drive is being configured with recommended settings from the VMware management console. Once again it should be noted that the
administrator doesn’t need to switch to the storage management console to provision a new volume. Figure 12. Provisioning DS3500 Storage from the VMware vSphere Client
Application aware data and storage management can also be used to manage the advanced data protection and recovery capabilities of the DS3500. Point in time snapshots can be scheduled and activated at the application level for popular Microsoft applications including Exchange, SQL Server, and SharePoint. Leveraging the Microsoft VSS protocol, snapshots can be managed at the application level for nearly instant data protection and quick and easy recovery of a corrupt application data.
Similarly, application aware data management can be used to automate the recovery of application services after a disaster. For example, the DS3500 Site Recovery Adapter (SRA) for VMware Site Recovery Manager (SRM) can be used to automate the recovery of applications running in a virtual machine after a site failure. The SRA adapter leverages the remote replication capabilities of the DS3500 and APIs specified by VMware to create an intuitive management interface that’s used to configure, test, and automate the recovery of virtual machines at a remote site.
ESG Lab tested an Oracle application with VMware Site Recovery Manager and previous generation IBM disk arrays.9
9See: ESG Lab Validation Report, Automated, Real-World Disaster Recovery Solutions, April 2009.
The configuration of a complex recovery plan involving multiple virtual machines was wizard-driven and easy. Fifteen minutes after starting a failover with a single mouse click, the entire application environment was up and running at a remote recovery site. Thirty minutes later, the same wizard-driven process was used to fail back to the primary data center. From an end-user perspective, the recovered environment felt exactly the same—regardless of the data center delivering the services. The network addresses, logins, and operating system preferences were the same. No application data was lost. And last, but not least, for the Oracle 11g order entry application tested by ESG Lab, there was no noticeable difference in application performance—even as data was replicated to a recovery site 100 Km away.
ESG Lab performed a failover test to confirm that virtual machines protected by a VMware recovery plan (and the applications running in those virtual machines) can be successfully restarted at the secondary data center. The screen shot shown in Figure 13 shows the progress of the first recovery moments after the Run button was clicked. ESG Lab noted that progress was very easy to follow. Successfully completed steps are depicted in green, the currently executing step is blue, and any failed steps are shown in red.
Figure 13.DS3500 Site Recovery Adapter(SRA) for VMware Site Recovery Manager(SRM)
Why This Matters
IT managers are struggling with explosive data growth and rising management complexity as they deliver
application services with ever-increasing performance and availability requirements. As the lines between virtual server, application, and storage administrators blurs, a single pane of glass that is familiar to administrators at all levels is needed to improve the delivery, management, and availability of application services.
ESG Lab has confirmed that the growing family of application aware solutions for the DS3500 can be used to deploy and manage storage from a single pane of glass that is familiar to users at the application level, the virtual server level, and the infrastructure management level.
ESG Lab Validation Highlights
4.2 GB/sec of aggregate throughput was sustained during characterization testing in a VMware-enabled virtual server environment.
A single DS3500 attached to a pair of servers running a mix of real-world application workloads in 16 virtual machines supports up to:
o 20,458 mailboxes using the Microsoft Exchange 2010 Jetstress utility
o and 3,724 database IOs per second for small OLTP IOs with the Oracle Orion utility o and 856 MB/sec of throughput for large OLAP Oracle Orion operations
o and 3,490 simulated web server IOPs
o and 1,260 MB/sec of throughput for simulated backup jobs o with predictably fast response times and scalability.
Management tools were examined with a goal of confirming that provisioning, monitoring, and protecting
application data residing on an DS3500 storage system can be simplified with application aware capabilities including:
o Storage vCenter vSphere Plug-in.
o Storage Oracle Enterprise Manager Plug-in.
o Site Recovery Adapter for VMware Site Recovery Manager (SRM). o Integration with Microsoft Disbursed Cluster Storage Failover (DCSF).
o Management Pack for Microsoft Systems Center Operations Manager (SCOM).
Issues to Consider
Generally accepted best practices and predominantly default VMware and IBM storage settings were used during the design of this test. As expected after any benchmark test of this magnitude, deep analysis of the results indicates that tuning would probably yield slighter higher absolute results. Given that the goal of this test was not to generate a big number, ESG Lab is confident that the results presented in this report meet the objective of estimating performance scalability and responsiveness as a growing number of virtual machines share a consolidated pool of DS3500 storage.
The test results/data presented in this document are based on industry-standard benchmarks deployed together in a controlled environment. Due to the many variables in each production data center environment, it is still important to perform capacity planning and testing in your own environment to validate a storage system configuration.
The Bigger Truth
Server virtualization is being deployed by a growing number of organizations to lower costs, improve resource utilization, provide non-disruptive upgrades, and increase availability. Each benefit is fundamentally enabled by de-coupling servers, applications, and data from specific physical assets. Storage virtualization takes those very same benefits and extends them from servers to the underlying storage domain—bringing IT organizations one step closer to the ideal of a completely virtualized IT infrastructure.
While the benefits of a completely virtualized infrastructure are obvious to most IT managers, performance and manageability are real concerns. Server, storage, and application administrators are looking for answers to a number of questions:
• Can we meet performance service level agreements for a mix of business-critical applications?
• Does the storage system have the horsepower to serve mixed real-world applications?
• Can the storage system scale to accommodate future growth and consolidation?
• Can storage management be simplified with tools that we are familiar with?
The IBM System Storage DS3500 Express, with next generation 6 Gbps SAS back-end technology and a flexible mix of SAS, iSCSI, and FC host connectivity options, is ideally suited for consolidation and virtualization in medium-sized businesses, mid-range environments, and remote sites.
ESG Lab confirmed that the performance and scalability of the DS3500 is well suited for a mix of applications running in a consolidated virtual server environment in small to medium-sized businesses. A single DS3500 simultaneously supported 20,458 simulated Exchange 2010 mailboxes and 3,724 Oracle Orion small database IOs per second and 856 MB/sec of throughput for large OLAP Oracle Orion operations and 3490 simulated web server IOPs and 1,260 MB/sec of throughput for bandwidth-intensive backup jobs—all while delivering predictably fast response times. ESG Lab confirmed that the growing family of freely available application aware plug-ins can be used to provision and manage data and storage from an application perspective. The VMware vCenter plug-in makes it easy to monitor and provision storage from a VMware virtual server administration console. The site recovery adapter for VMware site recovery manager makes is easy to define, automate, and test the remote recovery of applications running in virtual machines. Management framework plug-ins for Oracle Enterprise Manager and Microsoft System Center Operation Manager (SCOM) make it easy to monitor and manage storage from an infrastructure level. These capabilities, along with a growing family of application-specific snapshot and cluster failover tools, can be used to simplify storage management using a single pane of glass that administrators are familiar with.
ESG Lab is pleased to report that the IBM System Storage DS3500 Express, with a growing suite of application aware management interfaces, delivers balanced and predictable performance that is well suited for a mix of real-world business applications running in a VMware-enabled virtual server infrastructure.
Appendix
Table 4. Test Bed Overview
Storage
IBM DS3500 92 300 GB 10K SAS drives, 8 Gbps FC host connect
Servers
Two IBM System x x3850 X5 servers Dual quad core GHz processors, 96 GB of RAM
Host Bus Adapters
QLogic 8 Gb FC Dual-port HBA
Fibre Channel Switches
QLogic Sanbox 5802v
Virtualization Software and Guest Operating Systems
Server Virtualization VMware vSphere ESXi 4.1
Guest OS Windows Server 2008 R2 Enterprise Edition
Virtual Machine and Drive Configuration
DS3500 disk capacity was used for all storage capacity including VMware virtual disk files (VMDK), Windows Server 2008 R2 operating system images, application executables, and application data. The operating system images were installed on VMDK volumes. All of the application data volumes under test were configured as mapped raw LUNs (also known as raw device mapped, or RDM, volumes).
Application data and log volumes were configured as four drive RAID-1 volumes. Guest operating system volumes were configured using four-drive RAID-5 volumes. Volume ownership was balanced across the dual controllers and distributed evenly over the eight host interfaces.The volumes were spread evenly over two VMware host groups with a multipath policy of most recently used (MRU). The drive configuration is summarized in Table 5.
Table 5. Drive Configuration
Application
Number of LUNs
Number of Drives
Usable Capacity (GB)
Exchange DB 4 16 3,348
Exchange log 4 8 1,600
Oracle 4 16 4,800
Web server 4 16 3,348
Backup reader 4 16 3,348
Vmdk/OS 4 16 2,400
Hot Spare N/A 4 N/A
Table 6. Benchmark Utilities/Workload Generators
Characterization Iometer, version 2006.07.27
Dynamo clients ran within sixteen guest VMs running on a pair of IBM X3850 X5 servers with Windows Server 2008 R2 Enterprise Edition as the guest operating system. Forty-eight LUNs, built with 88 SAS drives, were tested. Each of the LUNs was tested as physical drive over raw device mapped volumes in a VMware vSphere
environment (ESX 4.1). The servers worked in parallel accessing the DS3500 through eight FC interfaces negotiated at 8 Gbps. Maximum throughput was measured using 1 MB sequential reads. One worker, sixteen outstanding IOs per physical drive.
E-Mail Microsoft Jetstress, version 08.02.0060.000
• Mailboxes – 4,500 • Mailbox size – 180 MB • IOPS per mailbox – 0.12 • Thread – 32
• Log buffers – 9000 • Min DB cache – 64 MB • Max DB cache – 512 MB • Insert operations – 40% • Delete operations – 30% • Replace operations – 5% • Read operations – 25% • Lazy commits – 55%
Database Workload Generator Oracle Orion, version 10.2.0.1.0
• Small IO size: 8 KB • Large IO size: 1024 KB
• IO Types: Small Random, Large Random • Simulated Array Type: RAID 0
• Num_disks: 5
• Stripe Depth: 1024 KB • Write: 30%
• Duration for each Data Point: 150 seconds
Web Server Iometer, version 2006.07.27
Four workers, four outstanding IOs per physical drive 100% random reads, assorted block sizes
Backup Reader Iometer, version 2006.07.27
One worker, one outstanding IO per physical drive 100% 256 KB sequential reads
Figure 14. E-mail Results
This is an example of the output created by the Jetstress utility. It shows the performance for one of four Jetstress tests running in parallel. Specifically, this report was created by the Jetstress utility running on a virtual machine within the fourth tile of the four tile test.
Microsoft Exchange
Jetstress 2010
Performance Test Result Report
Test Summary
Overall Test Result Pass
Machine Name JETSTRESS_01
Test Description
Test Start Time 11/19/2010 10:55:54 AM
Test End Time 11/19/2010 12:56:53 PM
Collection Start Time 11/19/2010 10:56:51 AM Collection End Time 11/19/2010 12:56:45 PM
Jetstress Version 14.01.0180.003
Ese Version 14.00.0639.019
Operating System Windows Server 2008 R2 Enterprise (6.1.7600.0)
Performance Log C:\JetStress-Results\Tile-4\Performance_2010_11_19_10_55_57.blg
Database Sizing and Throughput
Achieved Transactional I/O per Second 568.938
Target Transactional I/O per Second 540
Initial Database Size (bytes) 857745195008
Final Database Size (bytes) 858852491264
Database Files (Count) 1
Jetstress System Parameters
Thread Count 7 (per database)
Minimum Database Cache 32.0 MB
Maximum Database Cache 256.0 MB
Insert Operations 40%
Delete Operations 20%
Replace Operations 5%
Read Operations 35%
Lazy Commits 70%
Run Background Database Maintenance True
Number of Copies per Database 1
Database Configuration
Instance2308.1 Log Path: F:\Transactional I/O Performance MSExchange Database ==> Instances I/O Database Reads Average Latency (msec) I/O Database Writes Average Latency (msec) I/O Database Reads/sec I/O Database Writes/sec I/O Database Reads Average Bytes I/O Database Writes Average Bytes I/O Log Reads Average Latency (msec) I/O Log Writes Average Latency (msec) I/O Log
Reads/sec I/O Log Writes/sec I/O Log Reads Average Bytes I/O Log Writes Average Bytes
Instance2308.1 11.975 3.332 354.775 214.164 32836.081 34254.581 0.000 1.220 0.000 111.283 0.000 4878.843 Background Database Maintenance I/O Performance
MSExchange Database ==> Instances Database Maintenance IO Reads/sec Database Maintenance IO Reads Average Bytes Instance2308.1 28.484 261612.878
Log Replication I/O Performance
MSExchange Database ==> Instances I/O Log Reads/sec I/O Log Reads Average Bytes Instance2308.1 0.000 0.000
Total I/O Performance
MSExchange Database ==> Instances I/O Database Reads Average Latency (msec) I/O Database Writes Average Latency (msec) I/O Database Reads/sec I/O Database Writes/sec I/O Database Reads Average Bytes I/O Database Writes Average Bytes I/O Log Reads Average Latency (msec) I/O Log Writes Average Latency (msec) I/O Log
Reads/sec I/O Log Writes/sec I/O Log Reads Average Bytes I/O Log Writes Average Bytes
Instance2308.1 11.975 3.332 383.259 214.164 49838.856 34254.581 0.000 1.220 0.000 111.283 0.000 4878.843 Host System Performance
Counter Average Minimum Maximum
% Processor Time 2.397 1.406 18.386
Available MBytes 3031.785 3015.000 3039.000
Free System Page Table Entries 33555094.871 33555092.000 33555606.000 Transition Pages RePurposed/sec 0.000 0.000 0.000
Pool Nonpaged Bytes 24904925.867 24670208.000 25210880.000
Pool Paged Bytes 113510596.267 113451008.000 113770496.000
Database Page Fault Stalls/sec 0.000 0.000 0.000 11/19/2010 10:55:54 AM -- Jetstress testing begins ...
11/19/2010 10:55:54 AM -- Prepare testing begins ... 11/19/2010 10:55:56 AM -- Attaching databases ... 11/19/2010 10:55:56 AM -- Prepare testing ends.
11/19/2010 10:55:56 AM -- Dispatching transactions begins ...
11/19/2010 10:55:56 AM -- Database cache settings: (minimum: 32.0 MB, maximum: 256.0 MB) 11/19/2010 10:55:56 AM -- Database flush thresholds: (start: 2.5 MB, stop: 5.1 MB)
11/19/2010 10:55:57 AM -- Database read latency thresholds: (average: 20 msec/read, maximum: 100 msec/read). 11/19/2010 10:55:57 AM -- Log write latency thresholds: (average: 10 msec/write, maximum: 100 msec/write).
11/19/2010 10:56:00 AM -- Operation mix: Sessions 7, Inserts 40%, Deletes 20%, Replaces 5%, Reads 35%, Lazy Commits 70%. 11/19/2010 10:56:00 AM -- Performance logging begins (interval: 15000 ms).
11/19/2010 10:56:00 AM -- Attaining prerequisites:
11/19/2010 10:56:51 AM -- \MSExchange Database(JetstressWin)\Database Cache Size, Last: 241778700.0 (lower bound: 241591900.0, upper bound: none) 11/19/2010 12:56:51 PM -- Performance logging ends.
11/19/2010 12:56:51 PM -- JetInterop batch transaction stats: 78235. 11/19/2010 12:56:51 PM -- Dispatching transactions ends.
11/19/2010 12:56:51 PM -- Shutting down databases ... 11/19/2010 12:56:53 PM -- Instance2308.1 (complete)
11/19/2010 12:56:53 PM -- C:\JetStress-Results\Tile-4\Performance_2010_11_19_10_55_57.blg has 483 samples. 11/19/2010 12:56:53 PM -- Creating test report ...
11/19/2010 12:56:54 PM -- Instance2308.1 has 12.0 for I/O Database Reads Average Latency. 11/19/2010 12:56:54 PM -- Instance2308.1 has 1.2 for I/O Log Writes Average Latency. 11/19/2010 12:56:54 PM -- Instance2308.1 has 1.2 for I/O Log Reads Average Latency. 11/19/2010 12:56:54 PM -- Test has 0 Maximum Database Page Fault Stalls/sec.
11/19/2010 12:56:54 PM -- Test has 0 Database Page Fault Stalls/sec samples higher than 0.
Figure 15. Database Results
This is an example of the output created by the Oracle Orion utility for the database workloads. This example shows the performance of the four database VMs which ran in parallel during the mixed workload four tile test.
ORION VERSION 10.2.0.1.0 Commandline:
-run advanced -testname vmware -num_disks 5 -size_small 8 -size_large 1024 -type rand -simulate raid0 -write 30 -duration 150 -matrix basic
This maps to this test: Test: vmware
Small IO size: 8 KB Large IO size: 1024 KB
IO Types: Small Random IOs, Large Random IOs Simulated Array Type: RAID 0
Stripe Depth: 1024 KB Write: 30%
Cache Size: Not Entered
Duration for each Data Point: 150 seconds Small Columns:, 0
Large Columns:, 0, 1, 2, 3, 4, 5, 6, 7, 8, 9, 10 Total Data Points: 36
Name: \\.\E: Size: 1070596096 1 FILEs found.
Maximum Large MBPS=218.90 @ Small=0 and Large=10 Maximum Small IOPS=946 @ Small=25 and Large=0 Minimum Small Latency=5.13 @ Small=1 and Large=0
Figure 16. Backup Reader Results
This is an example of the output created by the Iometer utility for the backup reader workload. This example shows the performance of the four backup jobs which ran in parallel during the mixed workload four tile test.
Figure 17. Web Server Results
This is an example of the output created by the Iometer utility for the web server workload. This example shows the performance of the four web server VMs which ran in parallel during the mixed workload four tile test.