Appendix G: Water Availability Analysis
Appendix G provides the MCG-approved Water Availability Analysis which analyzes the potentially available water for MokeWISE projects, including groundwater, agricultural drainage water, Mokelumne River water, recycled water, stormwater, and desalination.
Water Availability Analysis
9 January 2015
Table of Contents
Introduction ... 1
Groundwater ... 2
Existing Groundwater Conditions ... 3
Summary of Potential Groundwater Supplies ... 11
Challenges with Maximizing Groundwater Use ... 11
Opportunities for Maximizing Groundwater Use ... 12
Agricultural Drainage Water ... 13
Potential Agricultural Drainage Supplies ... 13
Summary of Potential Agricultural Drainage Water Supplies ... 15
Challenges of Maximizing Agricultural Drainage Water Use ... 15
Opportunities for Maximizing Agricultural Drainage Water Use ... 15
Recycled Water ... 17
Wastewater Flows in the Watershed ... 17
Summary of Potential Recycled Water Supplies ... 38
Challenges with Maximizing Recycled Water Use ... 38
Opportunities for Maximizing Recycled Water Use... 40
Stormwater ... 41
Potential Stormwater Capture ... 42
Existing and Potential Stormwater Programs ... 51
Challenges with Maximizing Stormwater Use ... 54
Opportunities for Maximizing Stormwater Use ... 55
Conservation and Efficiency ... 57
Existing and Future Conservation Measures ... 57
Summary of Potential Conservation Savings ... 74
Challenges with Maximizing Conservation ... 75
Opportunities for Maximizing Conservation ... 75
Desalination ... 77
Regional Desalination Partnerships ... 81
Potential Supplies from Demineralization/Desalination ... 82
Summary of Potential Desalination/Demineralization Supply ... 83
Challenges with Maximizing Desalination/Demineralization Supply ... 83
Opportunities for Maximizing Desalination/Demineralization Supply ... 84
Mokelumne River ... 85
Background ... 85
Mokelumne Collaborative Group ... 86
Regulatory Setting ... 87
Overview of Results ... 91
Summary of Mokelumne River Supply ... 94
Challenges with Optimizing Mokelumne River Water Supply ... 94
Opportunities for Optimizing Mokelumne River Water Supply ... 95
Other Surface Water ... 96
Transfer Opportunities ... 96
Delta Supplies ...106
Transfer Conveyance Alternatives ...107
Challenges with Maximizing Other Surface Water Use ...108
Opportunities for Maximizing Other Surface Water Use ...109
Summary of Potentially Available Supply ...110
List of Figures
Figure 1: Groundwater Basins within the MokeWISE Region ... 3
Figure 2: CCWD Monitoring Well Network ... 6
Figure 3: Spring 2014 Groundwater Levels in the Eastern San Joaquin Groundwater Subbasin ... 8
Figure 4: San Joaquin County and Delta Water Quality Coalition Area Zones ... 14
Figure 5: Wastewater Treatment Facilities in the Upper Watershed ... 18
Figure 6: Wastewater Treatment Facilities in the Lower Watershed ... 27
Figure 7: Wastewater Treatment Facilities in EBMUDs Service Area* ... 32
Figure 8: Average Rainfall in the Region ... 42
Figure 9: Impervious Areas in the Region ... 44
Figure 10: Average Stormwater Runoff in the Region ... 46
Figure 11: Approximate Dimensions of Required Storage ... 54
Figure 12: Chloride Concentrations of Wells in the Eastern San Joaquin Subbasin (1984 to 2004) ... 78
Figure 13: Estimated 2000 and Projected 2030 Saline Front ... 80
Figure 14: Mokelumne River Flow Components* ... 93
List of Tables
Table 1: Average Change in Groundwater Level over Previous Year (in feet to
mean sea level) ... 10
Table 2: Wastewater Flows and Potential Recycled Water in the Upper Watershed ... 24
Table 3: Wastewater Flows and Potential Recycled Water in the Lower Watershed ... 30
Table 4: Wastewater Flows and Potential Recycled Water in the EBMUD Service Area ... 36
Table 5: Recycled Water Currently Used within the Upper and Lower Watersheds and EBMUD’s Service Area ... 37
Table 6: Recycled Water Assumed Available for the MokeWISE Program... 37
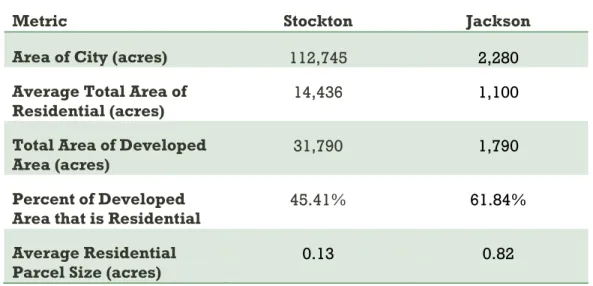
Table 7: Metrics for Upper and Lower Watershed Representative Cities ... 47
Table 8: Metrics for Calculating Residential Area in Upper and Lower Watersheds ... 48
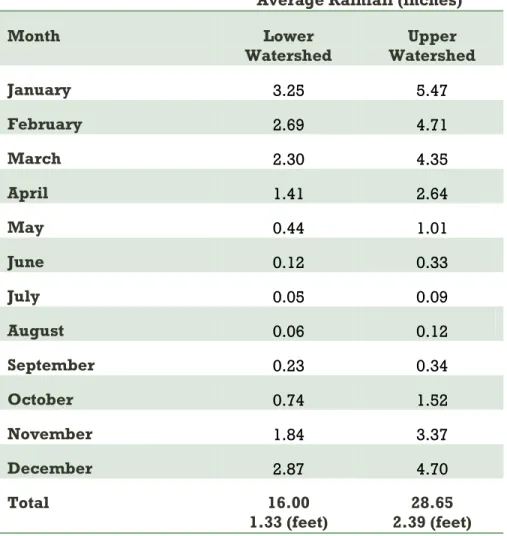
Table 9: Average Monthly Rainfall in Upper and Lower Watersheds ... 49
Table 10: BMP Naming Changes in the CUWCC MOU and Water Savings Assumptions ... 59
Table 11: Commercial, Industrial, Institutional Water Savings Assumptions ... 60
Table 12: AWA Estimated Future Savings Potential Associated with Conservation BMPs ... 62
Table 13: CCWD Estimated Future Savings Potential Associated with Conservation BMPs ... 64
Table 14: Primary Water Supply Sources in the Lower Watershed ... 67
Table 15: City of Stockton Estimated Future Savings Potential Associated with Conservation BMPs ... 69
Table 16: City of Lodi Estimated Future Savings Potential Associated with Conservation BMPs ... 71
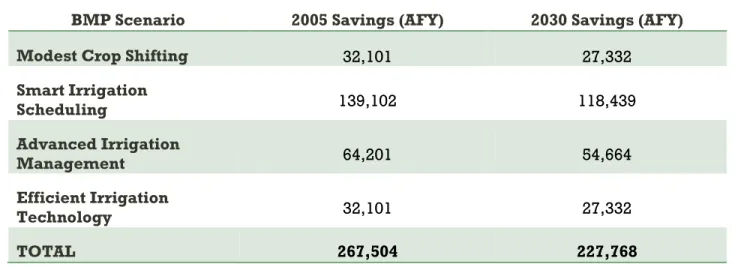
Table 17: Potential Agricultural Water Savings from Four BMPs ... 73
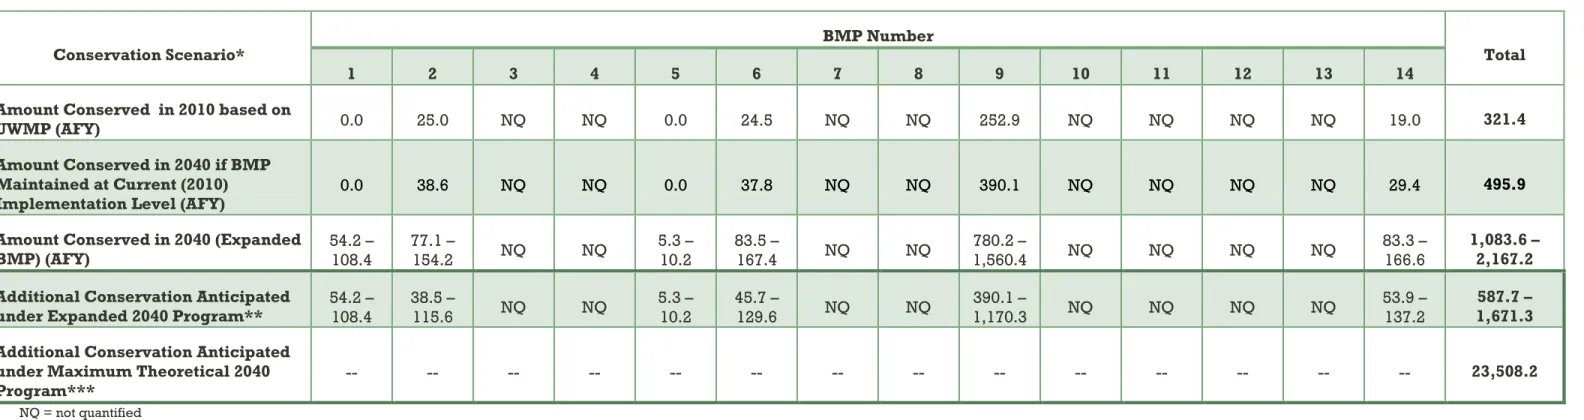
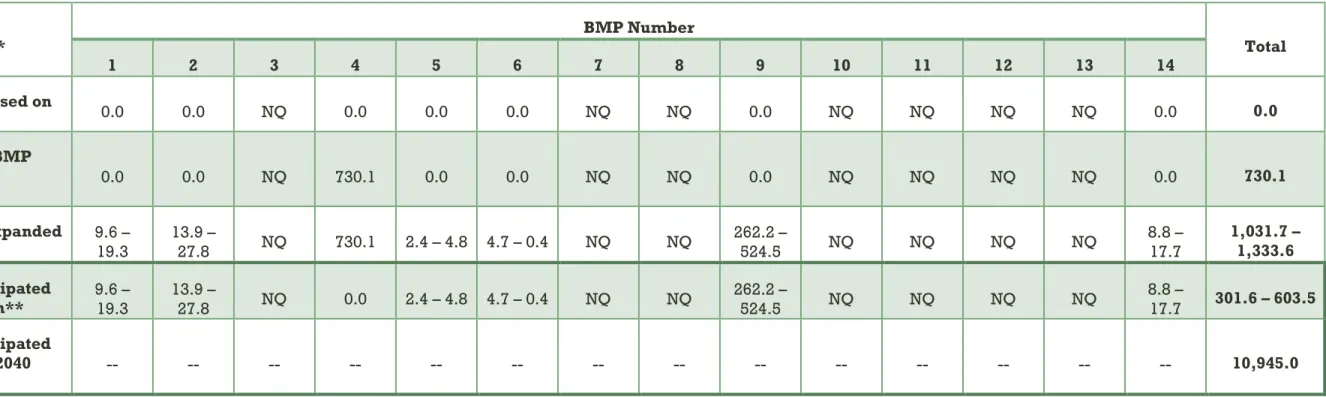
Table 18: Potential Additional Future Supply Available through Expanded Conservation Programs ... 74
Table 19: Diversion Assumptions for Current (2010) and Future (2040) Baselines ... 92
Table 20: Recent Water Transfers ... 99
Table 21: Percent of Time Surplus can be Expected to be Available if SWRCB Adopts Delta Flow Criteria as Flow Requirements ...106
List of Acronyms
20x2020 ADWF
Water Conservation Act of 2009 Average dry weather flow
AF Acre-feet
AFY Acre-feet per year
AGRIMET Bureau of Reclamation Agricultural Weather Network ARSA Amador Regional Sanitation Authority
AWA Amador Water Agency
AWMP Agricultural Water Management Plan
B/C Benefit-cost
BARDP Bay Area Regional Desalination Project BMPs Best Management Practices
CARWSP Camanche Area Regional Water Supply Plan CCSD Crockett Community Services District
CCCSD CCWD
Central Contra Costa Sanitary District Calaveras County Water District
CDCR California Department of Corrections and Rehabilitation CDEC California Data Exchange Center
cfs Cubic feet per second
CII Commercial, industrial, and institutional
COCORAHS Community Collaborative Rain, Hail and Snow Network COOP National Weather Service Cooperative Observer Program COSMUD City of Stockton Municipal Utilities Department
COWRP Castle Parks Water Reclamation Plant CPUD Calaveras Public Utility District CSD Community Services District CSD Crockett Sanitary Department
CVP CWC
Central Valley Project California Water Code
DFW California Department of Fish and Wildlife
DMM Demand Management Measure
DSRSD Dublin San Ramon Services District
DWR California Department of Water Resources DWSP Delta Water Supply Project
EBMUD East Bay Municipal Utility District
EPA United States Environmental Protection Agency ESJ Eastern San Joaquin
EWMP Efficient Water Management Practices
FY Fiscal year
GBA North Eastern San Joaquin County Groundwater Basin Authority GHMWC Garden Highway Mutual Water Company
GIS Geographic Information System gpcd Gallons per capita per day gphd
gpd
Gallons per household per day Gallons per day
GWMP Groundwater Management Plan HET High Efficiency Toilet
ILRP Irrigated Lands Regulatory Program
IRWMP Integrated Regional Water Management Plan JVID Jackson Valley Irrigation District
LAVWMA Livermore-Amador Valley Water Management Agency
LID Low impact development
MAC Mokelumne-Amador-Calaveras
MAF Million acre-feet
MGD Million gallons per day
MHSD Mokelumne Hill Sanitary District
MokeWISE Mokelumne Watershed Interregional Sustainability Evaluation MOU Memorandum of Understanding
MSPS Mallard Slough Pump Station
MWELO Model Water Efficient Landscape Ordinance NLCD National Land Cover Database
NMFS National Marine Fisheries Services
NOAA HDSC National Oceanic and Atmospheric Administration Hydrometerological Design Studies Center
NPDES National Pollutant Discharge Elimination System NRWRP North Richmond Water Reclamation Plant
NSJWCD North San Joaquin Water Conservation District OLSD Oro Loma Sanitary District
PCWA Placer County Water Agency PMWC Plumas Mutual Water Company
RARE Richmond Advanced Recycled Expansion
RAWS U.S. Forest Service and Bureau of Land Management Remote Automated Weather Stations
RO Reverse osmosis
RSD Rodeo Sanitary District
RWCF Stockton Regional Wastewater Control Facility RWQCB Regional Water Quality Control Board
SASD San Andreas Sanitary District
SAWPA Santa Ana Watershed Project Authority SAWS Stockton Area Water Suppliers
SBx7-7 SCVWD
Water Conservation Bill of 2009 Santa Clara Valley Water District SCWA Sacramento County Water Agency
SCWWTP Sutter Creek Wastewater Treatment Plant
SD Sanitary District
SEWD Stockton East Water District
SFCFCWCD San Joaquin County Flood Control and Water Conservation District SFPUC San Francisco Public Utilities Commission
SMCL Secondary Maximum Contaminant Level
SNOTEL Natural Resources Conservation Service Snowpack Telemetry SNOWCOURSE Natural Resources Conservation Service Snow Course
SWRCB State Water Resources Control Board TAF
TBF
Thousand acre-feet Tule Basin Farms TDS Total dissolved solids TMDL Total maximum daily load UAW
ULFT
Unaccounted-for water Ultra low flow toilets
UMRWA Upper Mokelumne River Watershed Authority USBR United States Bureau of Reclamation
USFWS United States Fish and Wildlife Services USGS United States Geological Services UWMP Urban Water Management Plant VSPUD Valley Springs Public Utility District WCMP Water Conservation Master Plan WCSD Wallace Community Services District WCWD West County Wastewater District WDRs Waste discharge requirements WID Woodbridge Irrigation District WPCP Water Pollution Control Plant WRCC Western Regional Climate Center
WRO WSMP 2040 WSS
Water Rights Order
Water Supply Improvement Program 2040 WaterSense Specification
WSWPCF White Slough Water Pollution Control Facility WWMP Wastewater Master Plan
WWTP Wastewater treatment plant YCWA Yuba County Water Agency Zone 7 Zone 7 Water Agency
List of Definitions
Unallocated water – The quantity of water in the Mokelumne River that is not diverted pursuant to a riparian or appropriative water right and that is not required to be in the river pursuant to a prescribed pre-1914 regulatory requirement.
List of Appendices
Appendix A presents the scope of work for a stormwater quantification project currently being implemented by EBMUD.
Appendix B presents further information on the conservation analysis, including the methodology and assumptions used to quantify the conservation BMPs for each agency. Appendix C provides the MOCASIM for the MokeWISE Program Technical Memorandum, which further describes the MOCASIM model.
Appendix D shows the annual flow duration curves at four locations along the river. Flow duration curves indicate the percentage of time over the period of record that flow in the river would be expected to be equal to or exceed a certain amount of water, based on historical hydrologic conditions and projected diversion levels. Results indicate that total flow decreases downstream and that there is projected to be less flow in 2040 than in 2010 due to increased diversions.
Appendix E shows monthly unallocated flow alongside regulated flow and unimpaired flow for the full period of historical hydrology as simulated by the model. This appendix also shows flow distributions by month for five different hydrologic year types, at selected threshold flow levels. Results indicate that there is generally more unallocated flow in wetter years, and that there is a higher likelihood of unallocated flows occurring in the months from January to June compared with the months from July to December. Results also show less unallocated flows in 2040 than in 2010 due to increased diversions.
Appendix F compares average total natural flow at Mokelumne Hill and unallocated flow below Camanche in 2010 and 2040 by water year type. Results indicate that total natural flow is greater than unallocated flow at Mokelumne Hill and that unallocated flow in 2010 is greater than unallocated flow in 2040 due to increased diversions. This pattern holds for each of the five hydrologic year types.
Appendix G compares annual JSA required flows and annual modeled flows. Results indicate that the amount of water being released decreases from 2010 to 2040, but that in each case, more water is being released than is required by the JSA.
Appendix H presents a constructed daily flow regime downstream of Camanche Dam by year for all years between 1998 and 2010. For the three wet years during that period (1998, 2005, and 2006), daily allocated and unallocated flows are presented on a monthly basis. This information is shown to provide information regarding historical daily flow variability. It is not intended to establish estimated pulse flows or geomorphic and/or fishery impacts. Appendix I shows the riparian diversions at Highway 99, Woodbridge Dam, and Interstate 5. Results indicate that diversions are greatest from May through July.
Appendix J shows unallocated water below Camanche for the 2010 and 2040 baselines. Results indicate that there is generally more unallocated water in the months from January to May, and that there is more unallocated water in the 2010 baseline than in the 2040 baseline. Appendix K presents data for all relevant figures and tables from Appendices D through J in cubic feet per second (cfs) rather than in acre-feet. The values stated provide the average flow in cfs over the time period specified (year, month, etc.). One acre-foot per year is equivalent to 0.00138 cfs.
Introduction
Basin-scale planning is currently underway within the Mokelumne River watershed under the auspices of the Upper Mokelumne River Watershed Authority (UMRWA) and the Eastern San Joaquin Groundwater Basin Authority (GBA), which represent the Mokelumne-Amador-Calaveras (MAC) and Eastern San Joaquin (ESJ) Integrated Regional Water Management Planning (IRWMP) Regions, respectively. Grant funding has been secured from the Proposition 84 Integrated Regional Water Management Program to develop the Mokelumne Watershed Interregional Sustainability Evaluation (MokeWISE) program, which seeks to improve water management in the Mokelumne River watershed.
The MokeWISE program has emerged following years of dialogue among a diverse set of stakeholders in the upper and lower Mokelumne River watersheds. MokeWISE, when concluded, is expected to yield a scientifically-based and broadly-supported water resources program that includes sustainable approaches to water resources management in the Mokelumne River watershed. Driving the development of the MokeWISE program is the Mokelumne Collaborative Group (MCG), a diverse and multi-faceted stakeholder group that includes water agencies, non-governmental organizations, private entities, resource agencies, and local, state, and federal government agencies.
As part of the MokeWISE program, the MCG will evaluate potential water management actions that involve a variety of water sources. The purpose of this document is to assist in determining the quantity of water potentially available from each source, including groundwater, agricultural drainage, stormwater, recycled water, conservation, desalination, the Mokelumne River, and other surface water. These sources were investigated over a 30-year planning horizon, spanning from 2010 to 2040 and evaluated for their potential to provide supply to the upper and lower Mokelumne watersheds. In order to develop an effective water resource management projects that could affect both regions, there is a need to identify water supply.
The results of this water availability analysis will help develop the project concepts currently being considered in the MokeWISE process. The following sections summarize the results of the water availability analysis for each water supply source considered. The study area for this analysis covers the portions of the MAC and ESJ IRWMP regions in the Mokelumne River watershed, which are identified as the upper and lower watersheds, respectively. In some instances, water supplies from outside the watershed could be exchanged to free up additional supply within the watershed. These opportunities were also evaluated.
2
Groundwater
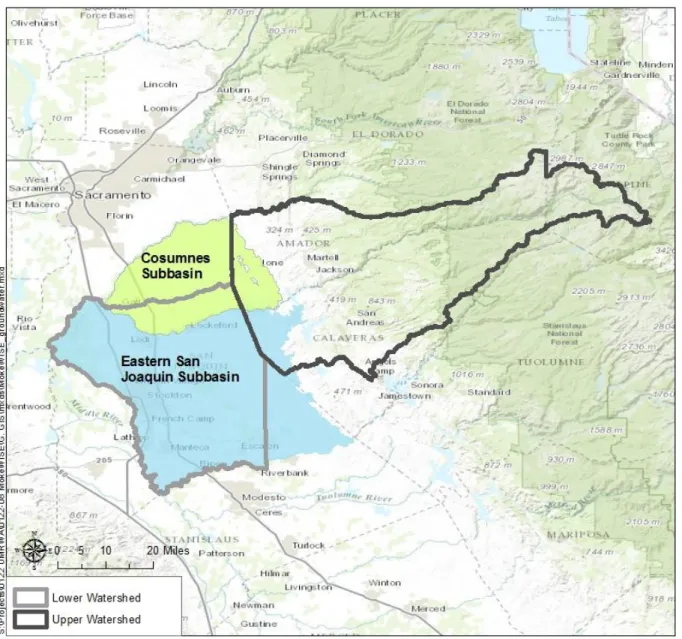
Available groundwater supply in the Mokelumne Watershed and adjacent areas was assessed by collecting information about the current conditions of the groundwater basins underlying the project area (including both western Calaveras and Amador counties, and Eastern San Joaquin County groundwater basins). Data was collected from available groundwater management plans, urban water management plans (UWMPs), groundwater models, other groundwater resource evaluations, and relevant agencies. As shown in Figure 1, the MAC and ESJ regions overlie the Cosumnes and Eastern San Joaquin groundwater subbasins of the San Joaquin Valley Groundwater basin. This evaluation considered potential groundwater supplies from the groundwater subbasins underlying the upper and lower watersheds.
Figure 1: Groundwater Basins within the MokeWISE Region
Existing Groundwater Conditions
Groundwater in the Upper Watershed
The Cosumnes Subbasin is approximately 440 square miles in size, and is bounded on the north and west by the Cosumnes River, on the east by the bedrock of the Sierra Nevada, and on the south by the Mokelumne River. The groundwater storage capacity of Cosumnes Subbasin is estimated to be about 6,000,000 AF. Basin inflows are estimated to be about 269,500 acre-feet per year (AFY). Water leaves the Subbasin through subsurface flow (144,600 AFY), urban extraction (35,000 AFY), and agricultural extraction (94,200 AFY). Based on this water balance, the Subbasin is in overdraft by about 4,300 AFY (RMC 2013, 1-35). As such, no additional groundwater supply is available in this area. Due to the
4 variable quality and supply of the basin, groundwater storage potential is considered negligible (RMC 2012).
A portion of western Calaveras County, served by Calaveras County Water District (CCWD), overlies the Eastern San Joaquin Subbasin, which is part of the larger San Joaquin Valley Groundwater Basin. The Eastern San Joaquin Subbasin is estimated to cover approximately 70 square miles (7 percent) of Calaveras County. This groundwater subbasin extends from the western corner of the County west of the cities of Stockton and Lodi. Use of groundwater for irrigation, domestic, and municipal purposes has resulted in a continuous decline of available groundwater over the past 40 years. The California Department of Water Resources (DWR) designated the Eastern San Joaquin Subbasin as “critically overdrafted” in Bulletin 118-80. The Subbasin is currently being managed under an AB 3030 Groundwater Management Plan (GWMP), prepared by the GBA. The Camanche/Valley Springs area is managed under a separate GWMP, adopted by CCWD in 2001, for investigation of opportunities to improve management of groundwater resources in western Calaveras County (RMC 2013).
In 2012, the U.S. Geologic Survey (USGS), in cooperation with CCWD and DWR, completed test drilling and data collection for the Calaveras County portion of the Eastern San Joaquin Groundwater Subbasin to better understand aquifer conditions in the Camanche/Valley Springs area (USGS 2012). As described in the study, groundwater is typically suitable for agricultural, domestic, and public-supply uses. However, high concentrations of naturally occurring dissolved solids, iron, arsenic, and increasing nitrate concentrations could limit future use and/or increase costs for treatment. Some areas, especially near Burson, have experienced drying wells due to declining groundwater level.
Estimating the age of groundwater is a tool often used to determine the recharge capabilities of a groundwater basin. To estimate the age of groundwater within the Calaveras County portion of the Easton San Joaquin Groundwater Subbasin, samples were collected from a number of monitoring wells for field parameters such as temperature, pH, and dissolved oxygen, as well as age-dating constituents including tritium and carbon-14 (see Figure 2). Tritium is naturally occurring radioactive isotope of hydrogen that is anthropogenic, short-lived (half-life of 12.3 years) and can be used to identify relatively young (post-1952) groundwater. Tritium detected in groundwater can often be attributed to thermonuclear weapons testing from 1952 to 1962. Tritium was detected in only one of six wells, indicating that groundwater recharge in the study area is small or requires a long time to infiltrate through the unsaturated zone to the water table.
Carbon-14 is a naturally occurring radioactive isotope of carbon that is long-lived with a half-life of 5,730 years. It allows for identification of groundwater up to 30,000 years old. Results from the six monitoring wells indicate the water ranges in age from 2,200 to 13,400 years old, becoming progressively older with depth. This indicates that: (1) extensive chemical reactions alter carbon-14 activities, (2) groundwater recharge is limited (which is consistent with the absence of tritium), or (3) groundwater requires a long time to infiltrate to the groundwater table (USGS 2012, 10-11). The well with the youngest groundwater was
also the well with detected levels of tritium, which suggests more recent recharge. In order to confirm and augment the USGS study, CCWD prepared and implemented a groundwater sampling plan (Dunn Environmental 2012). The sampling effort had the following objectives:
Collect additional water quality data to substantiate past findings.
Collect additional age dating data to confirm and augment tritium and carbon-14 results from the USGS study.
Assess potential groundwater recharge throughout the County portion of the subbasin.
While there may be localized areas suitable for groundwater recharge in the Calaveras County portion of the Eastern San Joaquin Groundwater Subbasin, based on the USGS study, natural recharge opportunities are limited and additional groundwater storage may not be available. While the feasibility and effect of using injection wells for recharge has not been extensively studied in the ESJ basin, there may be potential for their use.
6
Groundwater in the Lower Watershed
Groundwater measurements taken in Eastern San Joaquin County dating back to the 1960s show a fairly continuous decline in groundwater levels, with elevations dropping as much as 100 feet in some areas. Based on land use and population, total agricultural and municipal groundwater pumping in Eastern San Joaquin County is estimated to have averaged 870,000 AFY since the 1970s, which has resulted in the groundwater subbasin being overdrafted and reducing the volume of water stored in the basin by as much as 2 million acre-feet (AF) (DWR 2006b, 3). Over the last century, irrigated agriculture in the Central Valley has grown from less than 1 million acres to an estimated 7 to 8 million acres. Water demand in San Joaquin County is approximately 1.6 million AFY. The County currently relies on groundwater for 60 percent of its supplies, with surface water meeting the remaining 40 percent of demands. The Eastern San Joaquin groundwater subbasin is currently overdrafted at a rate of 150,000 to 160,000 AFY (GBA 2004, 69). Between 140,000 and 160,000 AFY of water is anticipated to be needed by 2030 to reverse overdraft conditions and stabilize the groundwater basin at target levels, assuming an estimated 2030 level of development as specified in either adopted or draft general planning documents (GBA 2007, ES-27).
As shown in Figure 3, as of spring 2014, groundwater was significantly overdrafted throughout the subbasin, with the greatest depression east of the City of Stockton with elevations as low as 60 feet below ground surface. Long-term groundwater overdraft has dramatic effects on groundwater levels and water quality. Portions of the subbasin have exhibited groundwater levels declining by as much as 2 feet per year, up to 90 feet below sea level (GBA 2007, 1-2). Groundwater level declines have resulted in steep gradients from the west, causing intrusion of highly saline groundwater. Degradation of water quality due to saline migration threatens the long-term sustainability of the groundwater basin in the long term. In the near term, users face failing groundwater wells, reduced pumping rates, and poor water quality. Salt intrusion in the groundwater basin has rendered supplies unusable for urban drinking water needs and crop irrigation in some locations. Studies and monitoring to determine the potential sources and extent of the saline front are limited. Results of a USGS Joint Salinity Study (USGS 2006) indicated several possible sources of saline water including surface water infiltration, dissolution of salts near the Delta margin, contributions from underlying deposits, and possible irrigation return flow. Saline intrusion is discussed in more detail in the Desalination section. Even with conservation and recycled water programs in place, reversing groundwater overdraft will require a substantial amount of supplemental water (GBA 2007).
There are seven incorporated cities within San Joaquin County: Escalon, Lathrop, Lodi, Manteca, Ripon, Stockton, and Tracy. Escalon and Ripon are entirely dependent on groundwater for all potable and non-potable demands. However, these cities are taking steps to diversify supplies with surface water.
8
Figure 3: Spring 2014 Groundwater Levels in the Eastern San Joaquin Groundwater Subbasin
Recent studies suggest that while groundwater levels in some parts of the subbasin may have begun to recover, most areas continue to reflect declining conditions. Hydrographs from the spring 2014 Groundwater Report published by the San Joaquin County Flood Control and Water Conservation District (SJCFCWCD) indicate that groundwater surface elevations in many of the wells throughout San Joaquin County were in decline from the beginning of the period of record (~1958) through today. Fluctuations in levels have been observed throughout the years, with some wells exhibiting increasing levels in recent years or somewhat constant levels. However, most wells have exhibited a constant decline (SJCFCWCD 2014). The 2014 Groundwater Resources Management Report (Wagner & Bosignore 2014, 22) recommends identification and assessment of risks to the groundwater basin to determine the resiliency of existing wells and the potential to meet future groundwater demands. Risks include, but are not limited to:
Reduction of surface water supplies through regulatory actions;
Increased diversions upstream;
Reduced conservation storage in area reservoirs;
Prolonged and/or intense drought periods; and
Increased future demands.
The report recommends development of a Basin Conceptual Model and ultimately a numerical groundwater model, which would facilitate evaluation of the future risk of overdraft conditions and help aid in the development of water banking criteria, operational limitations for extraction, and the understanding of artificial and natural recharge (Wagner & Bosignore 2014).
As noted above, review of the spring 2014 Groundwater Report published by the SJCFCWD indicates that while the majority of the areas in the basin are declining, some areas of the basin are beginning to stabilize (SJCFCWD 2014). Table 1 provides the average groundwater level change over the previous year by jurisdictional monitoring area. That is, the change noted in Spring 2014 indicates the change in groundwater level from Spring 2013 to Spring 2014. Note that there are a number of wells within each monitoring area and the below numbers represent the average.
10
Table 1: Average Change in Groundwater Level over Previous Year (in feet to mean sea level)
Year
Central San Joaquin Water
Conservation District
North San Joaquin Water
Conservation District
Oakdale Irrigation
District
Stockton East Water
District
South San Joaquin Irrigation
District
Woodbridge Irrigation
District
Southwest County
Areas
Spring 2009 -1.5 -3.0 -2.6 -3.1 -2.7 -1.8 -1.0
Spring 2010 -1.2 -0.9 1.1 -1.2 -0.5 0.2 0.2
Spring 2011 1.8 0.1 0.2 1.9 1.0 1.8 1.3
Spring 2012 0.52 0.4 -0.15 -0.1 1.0 -0.3 0.2
Spring 2013 -4.37 -0.47 -3.53 -1.34 -2.11 -0.86 -0.73
Based on this analysis, it is assumed that no additional groundwater is available from the Eastern San Joaquin Groundwater Basin. However, recent studies including the Eastern San Joaquin Groundwater Basin GWMP (GBA 2004) have shown that the groundwater overdraft may have created an estimated 1 to 2 million AF of groundwater basin storage which could be used in a groundwater banking or conjunctive use development. Groundwater banking and conjunctive use are recognized as key water management options for water agencies to balance water needs. There is interest statewide in implementing a groundwater bank in Eastern San Joaquin County. Interested parties include DWR, United States Bureau of Reclamation (USBR), CALFED Storage, Metropolitan Water District of Southern California, State Water Contractors, East Bay Municipal Utility District (EBMUD), AWA, and CCWD. Recent legislature has the potential to greatly affect groundwater management within California. Senate Bill (SB) 1739 would require a groundwater sustainability agency to submit a groundwater sustainability plan and would grant that agency the ability to impose fees. SB 1168 would require that each groundwater basin be characterized with a priority and include consideration of adverse impacts on local habitat and local streamflows. SB 1319 would authorize the State Board to designate certain high- and medium-priority basins as probationary basins. Each of these bills has the potential to alter the groundwater landscape within the MokeWISE region. However, because each of these bills was recently signed by the Governor, this analysis cannot include a thorough analysis of their impact.
Summary of Potential Groundwater Supplies
Aside from the groundwater currently used and planned for use, groundwater is not a viable additional water supply in the upper watershed for the MokeWISE program because of limited yield. Based on water age findings, large-scale natural groundwater recharge is unlikely to be viable in the Calaveras County portion of Eastern San Joaquin subbasin. Total agricultural and municipal groundwater pumping in Eastern San Joaquin County is estimated to have averaged 870,000 AFY since the 1970s, which has contributed to overdraft conditions. Continuing current rates of groundwater extraction will further impact groundwater levels, and saline groundwater will continue to migrate east into the basin (GBA 2004, 77). This will continue to impact the availability of groundwater in the future. Conjunctive management strategies (i.e. management of groundwater and surface water resources) and groundwater recharge opportunities may help to mitigate groundwater overdraft conditions.
Challenges with Maximizing Groundwater Use
Challenges associated with maximizing the use of groundwater as a supply in the MokeWISE program are listed below. These challenges should be considered in conjunction with any groundwater projects resulting from the MokeWISE program.
Availability. In the Cosumnes Subbasin within the upper watershed, private wells pump groundwater for use; however, because groundwater availability is limited in
12 the upper watershed, the potential for expanded use of groundwater in the upper watershed is also limited. Additionally, widely, distributed, small capacity wells in fractured rock offer very limited opportunities for coordinated management.
Groundwater basin conditions. Groundwater from the Eastern San Joaquin Groundwater Subbasin is widely used in the lower watershed for agriculture and domestic supplies, but the basin, while recovering, has historically seen declining levels. Balancing the demands of users with the groundwater available is a challenging aspect of using groundwater as a supply.
Opportunities for Maximizing Groundwater Use
The following are potential opportunities for maximizing groundwater use. These examples can be considered when discussing potential MokeWISE projects and programs.
Direct/in-lieu banking. Low groundwater levels provide opportunities for potential banking and conjunctive use projects and programs. Water sources could include unused American, Sacramento, and/or Mokelumne River, stormwater, and/or recycled water supplies.
Direct injection. Water from a variety of sources, including the Mokelumne, stormwater, recycled water, and agricultural drainage water, could be used to stabilize groundwater basin levels through direct injection.
Agricultural Drainage Water
Agricultural drainage water is excess irrigation water collected from agricultural field drainage systems. Traditionally, agricultural drainage water may have been a significant supply source, but due to more efficient agricultural irrigation practices and water quality concerns, it is no longer considered a viable source. In the future, there may be a need to flush agricultural soils to reduce salt build-up, potentially creating agricultural drainage water. However, these practices are not currently being implemented and the quantity and quality of any potentially available water resulting from this use is unknown.
Agricultural drainage supplies were quantified by collecting data from the State Water Resources Control Board (SWRCB) and Regional Water Quality Control Board (RWQCB) to estimate the amount of agricultural drainage water and determine whether it is a viable potential source of supply for the future.
Potential Agricultural Drainage Supplies
Water discharge from agricultural irrigation and operations includes runoff, flows from tile drains, and stormwater runoff. Because these discharges can affect water quality by transporting pollutants such as pesticides, sediment, nutrients, and salts to surface water, the Irrigation Lands Regulatory Program (ILRP) regulates discharges from irrigated agricultural land. Waste discharge requirements (WDRs) or conventional waivers of WDRs (Orders) to growers require water quality monitoring of receiving waters and corrective actions when impairments are found. There are approximately 40,000 growers enrolled in the ILRP encompassing 6 million acres in California (SWRCB 2014a).
The San Joaquin County & Delta Water Quality Coalition was established in response to the ILRP to help meet agricultural water quality requirements in San Joaquin County, Calaveras County, the Delta portions of Alameda and Contra Costa Counties, a portion of Stanislaus County north of the Stanislaus River, and a small portion of Amador County that drains into the Mokelumne River. The ILRP requires growers that irrigate their land and have runoff from that irrigation or rainfall to belong to a coalition or apply for an individual discharge permit from the RWQCB. The Mokelumne River watershed is primarily within Zones 1, 2, 3, and portions of 4 and 5 of the Coalition (see Figure 4). Zones within the Coalition are established for areas with similar characteristics. Water quality monitoring occurs within the zones to identify areas that may be exceeding water quality standards. In March 2014, the Central Valley RWQCB approved a new General Order for the San Joaquin County and Delta Watershed area (San Joaquin County and Delta Water Quality Coalition 2014).
14
Figure 4: San Joaquin County and Delta Water Quality Coalition Area Zones
Source: San Joaquin County and Delta Water Quality Coalition 2014
Within the Coalition area, the lower reaches of the San Joaquin River drain the eastern and western areas of the Central Valley. Drainage water is exported to the San Francisco Bay through the Delta or conveyed south via the State Water Project and Delta Mendota Canal (San Joaquin County and Delta Water Quality Coalition 2008).
In 2007, the Central Valley RWQCB prepared the Revised Draft of the 2007 Review of
Monitoring Data for the Irrigated Lands Conditional Waiver Program to assess data collected
for the Irrigated Lands Program since its inception in 2003. For the purposes of the report, the Central Valley Region was divided into four zones. Zone 2 includes parts of the San
Joaquin, Contra Costa, Alameda and Calaveras Counties, and the Delta. Participants in Zone 2 include the San Joaquin and Delta Water Quality Coalition, Oakdale Irrigation District, and South San Joaquin Irrigation District. Many growers in Zone 2 utilize an intricate system of conveyance canals for the purpose of returning tail water back to upstream farms, allowing growers to transport and reuse runoff or tail water in upgradient areas (CVRWQCB 2007). Reports and data available from the SWRCB, RWQCB, and the San Joaquin County and Delta Water Quality Coalition provide water quality information, but do not quantify agricultural drainage water.
Summary of Potential Agricultural Drainage Water Supplies
While quantities of agricultural drainage are unknown, it is assumed that they are decreasing due to investments in agricultural irrigation efficiency practices and technologies. As such, it is not recommended that this source be relied upon as a significant source of water. Some local, small-scale applications may be viable for agricultural drainage, but it is not expected to contribute to a viable regional water supply. Additionally, it is important to consider the potential impacts associated with the capture of agricultural drainage, including reductions in water available for downstream environmental, agricultural, and urban uses. Furthermore, use of agricultural drainage water may reduce groundwater recharge. For these reasons, agricultural drainage water is not considered a viable source for the MokeWISE program.
Challenges of Maximizing Agricultural Drainage Water Use
While agricultural drainage water is assumed to be decreasing, its use has the potential to pose challenges for downstream water users. In many cases, downstream users divert agricultural drainage water that was discharged by upstream users. As agricultural efficiencies are realized, this source is naturally decreasing, while potentially increasing the concentrations of contaminants. Capture and reuse of agricultural drainage water would further decrease this source for downstream users, thereby potentially decreasing the supplies available for downstream water users and groundwater users. Additionally, treatment of agricultural drainage water for use would need to be identified and implemented. These challenges should be addressed when considering projects which use agricultural drainage water as a supply.
Opportunities for Maximizing Agricultural Drainage Water Use
The following are potential opportunities for maximizing agricultural drainage water use. These examples can be considered when discussing potential MokeWISE projects and programs.
Soil flushing. Soil flushing is an agricultural practice in which water is applied to decrease the concentration of salts and other constituents that can build up in the soil over time. While some soil flushing occurs now within San Joaquin County, this practice is limited, and the amount of water that could potentially be captured and
16 used is negligible. Additionally, any water that does result from flushing both recharges the groundwater and is potentially used by downstream users. However, water may be available in the future if soil flushing becomes a more common practice implemented at a larger scale.
Recycled Water
Potentially available recycled water was determined by quantifying treated wastewater within the watershed and the volume of recycled water that is currently used or planned for future use. The remaining amount, after considering constraints, may be available for reuse.
Wastewater Flows in the Watershed
Unless noted, all annual flows were converted from Average Dry Weather Flow (ADWF) reported in million gallons per day (MGD) to acre-feet per year (AFY). This results in a conservative estimate of available supply because it does not include wet weather flows, which are difficult to store for use during dry times. All cited flows are from current, published documents and are based on assumed rates of population growth and buildout population assumptions. It should be noted that there is significant uncertainty associated with projecting future population growth, and the growth rates projected in some of these documents are greater than the rates that have been experienced in the past. If population grows at a slower rate than projected, future wastewater flows will be less than what is cited in this document, thereby decreasing the amount of recycled water that could potentially be available. Conversely, if population growth increases at a rate faster than that assumed by these planning documents, wastewater flows would be expected to be greater than cited, and a greater amount of recycled water may potentially be available in future years.
Upper Watershed
The following agencies own and operate the major wastewater collection and treatment facilities within the upper watershed: AWA, Amador Regional Sanitation Authority (ARSA), City of Sutter Creek, City of Ione, City of Jackson, City of Plymouth, CCWD, EBMUD, Mokelumne Hill Sanitary District (MHSD), San Andreas Sanitation District (SASD), Valley Springs Public Utility District (VSPUD), and Wallace Community Services District (WCSD). Some of these agencies operate more than one facility and some share conveyance and discharge facilities.
The majority of the water treatment facilities in this region serve small, unincorporated areas with wastewater ADWF of less than 600 AFY. Only four wastewater treatment plants (WWTPs), including La Contenta WWTP, Castle Oaks Water Reclamation Plant (COWRP), City of Ione Secondary Treatment Plant, and City of Jackson WWTP, are projected to generate more than 1 MGD (1,120 AFY) at buildout, with a combined flow of approximately 9,000 AFY at buildout. Several agencies currently use recycled water to meet part of their water demands, as discussed in a subsequent section. Each of the agencies and the wastewater treatment facilities they operate are described in detail below. All flows associated with the upper watershed are captured in Table 2. Figure 5: Wastewater Treatment Facilities in the Upper Watershed identifies the location of each of the treatment plants discussed in the following sections.
18
Amador Water Agency
AWA owns and operates ten wastewater systems within the MAC region. The Lake Camanche WWTP and the Gayla Manor WWTP are the only two treatment plants and provide secondary treatment with disinfection and spray irrigation for disposal. The other eight systems are community leach fields that serve the communities of Eagles Nest, Fairway Pines, Jackson Pines, Mace Meadows, Pine Grove, Surrey Junction, Tiger Creek Estates, Viewpoint, and Wildwood Estates. These leach field systems dispose of primary treated wastewater through subsurface drains and produce such limited quantities of wastewater or are so geographically distant from potential users that reuse would be inefficient and cost-prohibitive (AWA 2011). In total, AWA collects and treats approximately 110 AFY of wastewater in the MAC region, but only the flows from the Lake Camanche WWTP and the Gayla Manor WWTP are feasible for recycled water use because these are the only two facilities which produce significant amounts of secondary treated water. The combined existing flow from these two treatment facilities is just over 60 AFY, with flows reaching a combined 132 AFY in the future.
Amador Regional Sanitation Authority: City of Sutter Creek/City of Amador City/Martell
The City of Sutter Creek owns and operates the Sutter Creek Wastewater Treatment Plant (SCWWTP), which serves the cities of Sutter Creek, Amador City, and the community of Martell (Aegis 2013, 4-9). SCWWTP expansion capacity is limited to approximately 1 MGD due to its location; however, an adjacent site has been identified for a future WWTP. Secondary effluent produced by the SCWWTP is chlorinated and discharged to the Amador Regional Sanitation Authority (ARSA) system for storage and reuse or disposal.
The ARSA Regional Outfall originates at the City of Sutter Creek WWTP, and allows effluent to be routed either to the City of Ione’s tertiary level COWRP, or to the City of Ione’s Secondary Treatment Plant (ponds) south of the Sutter Creek streambed. Along the ARSA pipeline, a portion of the treated effluent is used for pasture grass application at Bowers Ranch and Hoskins Ranch. The City of Ione accepts from ARSA and the California Department of Corrections and Rehabilitation (CDCR) a combined total of 650 AFY of secondary-treated wastewater for disposal (Aegis 2013, 4-3).
Buildout flows are planned to be 0.913 MGD or 1,023 AFY based on the ARSA Wastewater Master Plan (WWMP) (HydroScience 2012, 5). Other studies provide alternate projections of future buildout flows. Future recycled water use is anticipated to be roughly 1,000 AFY. Calaveras County Water District
CCWD operates five larger wastewater treatment facilities (>0.1 MGD) and nine smaller systems serving approximately 5,000 wastewater connections in total. The effluent produced by the treatment facilities is disposed of in three principal ways: community leach field systems, spray disposal, and irrigation. Three of the plants contain facilities to recycle wastewater for golf course irrigation (CCWD 2011, 5-1).
20 Wastewater treatment facilities treating less than 0.1 MGD are located in the following communities: Douglas Flat/Vallecito, West Point, Wilseyville Camp, Country Houses, Indian Rock, Millwoods, Sequoia Woods, and Southworth. The Country Houses, Sequoia Woods and Southworth communities are near buildout, and additional connections are not anticipated. Flows at the other facilities are gradually approaching capacity, and the agencies will need to begin making plans for treatment capacity expansions (Calaveras LAFCO 2012, 75). While the Arnold wastewater treatment facility treats 0.1 MGD or 118 AFY of wastewater, it currently only treats to primary standards and is therefore not discussed further below. Copper Cove, Forest Meadows, and Douglas Flat/Vallecito treatment plants, while owned by CCWD, are not hydrologically connected to the Mokelumne River. In other words, any recycled water use connected to these facilities would not offset Mokelumne River water. As such, these wastewater treatment facilities are also not discussed below
Tertiary-treated effluent from the La Contenta wastewater treatment facility is stored and used for golf course irrigation. The La Contenta Golf Course uses the plant effluent as its primary irrigation supply source, and uses raw water from New Hogan Reservoir to meet its supplemental water supply needs. CCWD intends to incorporate additional wastewater recycling programs in other areas, such as parks, landscape, and highway medians once effluent volumes exceed current irrigation demands. Without these alternatives, CCWD would dispose of additional effluent through dedicated land application (CCWD 2011, 5-3). Current wastewater flows are 225 AFY and are expected to increase to 1,636 AFY by 2040. East Bay Municipal Utility District
EBMUD operates two wastewater facilities that serve the Camanche North Shore Recreation Area and Pardee Recreation Area in Amador County, which treat a combined 3.3 AFY. EBMUD has discussed development of a regional wastewater treatment facility with local jurisdictions to treat wastewater from these two facilities (Amador County Municipal Service Review 2014).
City of Ione
The City of Ione operates the COWRP tertiary treatment facility and a secondary wastewater treatment plant. The City provides wastewater collection, treatment and disposal services to 1,715 connections, treatment for ARSA wastewater discharges, and recycled water to a local golf course.
City of Ione WWTP – The City of Ione owns and operates a WWTP that collects and treats wastewater for property within its corporate city limits. Wastewater is treated to secondary standards using treatment ponds and then disposed of through percolation/evaporation ponds (KSD 2012). The City needs to expand the storage and disposal capacity of its wastewater operations to accommodate future development beyond its existing commitments made through development agreements. Plans include modification of current pond systems and the addition of spray irrigation. ADWF for 2013 was 0.42 MGD or 471 AFY and is expected to expand
to 1.34 MGD or 1,505 AFY by 2025 (Amador LAFCO 2014, 75). The City anticipates that 436 AFY of recycled water from this facility will be used in the future, leaving 1,069 AFY of potentially available recycled water in the future.
Castle Oaks Water Reclamation Plant – The City also owns and operates COWRP, which accepts secondary effluent from ARSA and the Mule Creek State Prison and produces a disinfected tertiary Title 22 effluent suitable for unrestricted reuse to irrigate the golf course at the Castle Oaks residential development within the Ione city limits (RMC 2013). The Ione WWTP and COWRP are hydraulically connected with the Ione WWTP accepting backwash and drain water from COWRP and taking secondary effluent from ARSA and Mule Creek when this flow exceeds the irrigation demand of the golf course (Amador LAFCO 2014, 81). Annual wastewater flows for COWRP are currently 462 AFY and are projected to increase to 1,476 AFY in the future. The COWRP currently recycles and uses the entire 462 AFY and has plans to expand recycled water use with wastewater flow increases. As such, no additional recycled water is anticipated being available from this plant in the future.
City of Jackson
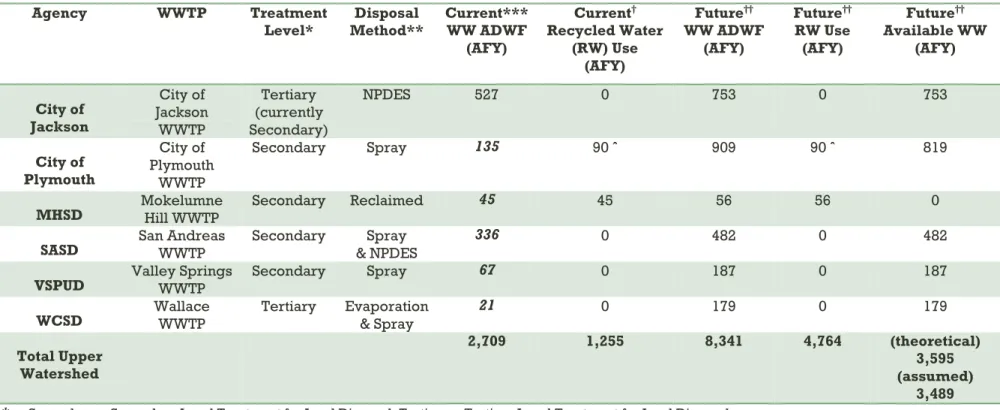
The City of Jackson owns and operates a WWTP which discharges secondary-treated effluent to Jackson Creek. The WWTP has a capacity of 796 AFY and currently treats 527 AFY of wastewater (Aegis 2013, 4-7). Development in the greater Jackson area is projected to result in a need to treat and dispose of 753 AFY of municipal wastewater by 2025, but flows are not expected to exceed plant design capacity before 2035 (Amador LAFCO 2014, 119). The City of Jackson does not currently use recycled water, nor does it have plans to in the future.
The WWTP, as noted above, discharges the treated effluent into Jackson Creek, which flows to Lake Amador, Jackson Valley Irrigation District’s (JVIDs) water supply reservoir. The Regional Water Quality Control Board and Department of Public Health have expressed concerns that this may result in concentrations of treated wastewater higher than 5 percent of flows in Jackson Creek (Jackson 2012). As a result, the City of Jackson has been directed to upgrade their WWTP to full tertiary status by March 2018 (Central Valley RWQCB 2013). While the capacity of the plant will not change, the increased treatment will allow for a wider variety of uses (Jackson 2012).
City of Plymouth
The City of Plymouth’s wastewater facility provides primary wastewater treatment prior to discharging the treated effluent through land disposal. Total current effluent flows at this facility are 135 AFY and are expected to grow to 909 AFY in the future. Plymouth is authorized to discharge the effluent to 125 acres of spray fields for disposal, of which 85 acres are usable for disposal (Amador LAFCO 2014, 161). It is estimated that this uses roughly 90 AFY of recycled water, which Plymouth will continue to use in the future. This leaves 819 AFY of potentially available recycled water in the future.
22 Currently, the City is working with Bella Victoria Family Vineyard on a program to supply recycled water to their vineyards adjacent to the City’s wastewater treatment facility. The first phase of the project, at a cost of roughly $1.6 million, will supply 200 acres with secondary treated recycled water (City of Plymouth 2014, personal communication). The second phase will serve an additional 200 acres and is anticipated to cost between $600,000-700,000. This program will require the City of Plymouth to upgrade its treatment plant to secondary standards and would absorb the effluent associated with growth for the next 40 years (City of Plymouth 2014, personal communication). As such, there is not anticipated to be any secondary treated recycled water available from the City of Plymouth in the future, beyond what it planned to be provided for local agricultural use.
Mokelumne Hill Sanitary District
MHSD provides wastewater collection, treatment and disposal services to the unincorporated community of Mokelumne Hill (RMC 2013). The MHSD wastewater treatment plant treats to secondary standards and has an ADWF of 0.04 MGD or approximately 45 AFY, with an expected 56 AFY by 2035 (MWH 2009, 43). Treated effluent is currently stored in the storage pond until summer, when it is used to irrigate the spray disposal field which is used for cattle grazing. Recycled water is expected to be used for irrigation purposes in the future, so no additional available recycled water is anticipated in the future.
San Andreas Sanitation District
SASD provides wastewater collection, treatment and disposal services to the community of San Andreas and neighboring areas. The plant treats wastewater to secondary levels and polishes the resulting effluent in three post-secondary treatment ponds. SASD is capable of discharging up to 1,681 AFY by land disposal and discharge into San Andreas Creek, which ultimately flows into the North Fork of the Calaveras River (MWH 2009, 42). SASD treats and discharges approximately 340 AFY of effluent, which is projected to reach 482 AFY in 2035 (MWH 2009). SASD does not currently use recycled water, nor does it have any plans to do so in the future.
Valley Springs Public Utility District
VSPUD provides wastewater collection, treatment and disposal services to the unincorporated Valley Springs. VSPUD’s treatment process includes the use of a treatment plant, pond processing, and disposal through evaporation and spray fields. The plant currently treats and discharges 67 AFY of wastewater to secondary standards, which is expected to expand to 187 AFY by 2025. Current discussions on future disposal methods include application for discharge permits and creation of a trench system for the spray fields (MWH 2009, 44-45). VSPUD does not currently use recycled water, nor does it anticipate using recycled water in the future.
Wallace Community Services District
WCSD provides wastewater collection, treatment and disposal services to the gated community of Wallace Lake Estates and the unincorporated town of Wallace, but contracted with CCWD in 2009 for operation and maintenance of WCSD wastewater facilities (RMC 2013). The WCSD’s wastewater treatment system operates at the tertiary treatment level treating an ADWF of 0.019 MGD or 21 AFY, reaching 179 AFY of wastewater treatment due to growth by 2035. WCSD does not currently use recycled water; currently, all treated effluent, which is roughly 20 AFY, evaporates, transports, or percolates into the soil from the storage reservoir (MWH 2009, 46). In the future, 179 AFY of recycled water is considered potentially available for use.
Overall Upper Watershed Wastewater Flows
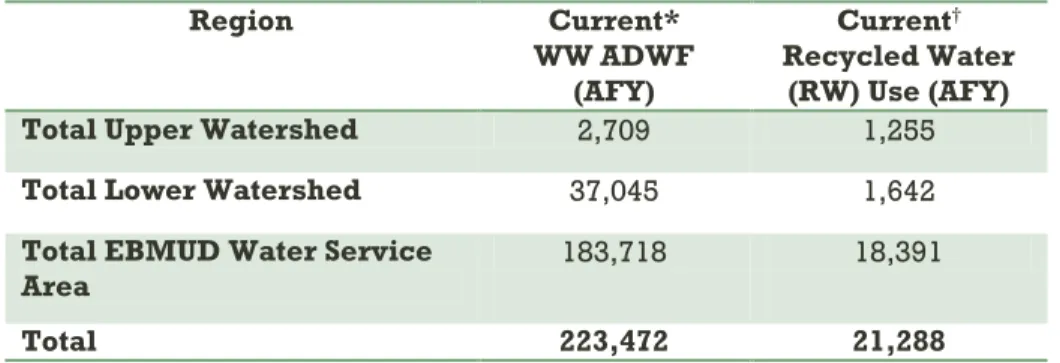
Based on the above data, the total amount of wastewater collected and treated currently by the agencies listed above is approximately 2,710 AFY. Of this, approximately 1,250 AFY is reclaimed and treated for use as an irrigation resource. The agencies above are projected to collect and treat approximately 8,300 AFY at build-out, which is around 2035 for most agencies, of which 4,745 AFY will be treated and utilized for irrigation and other recycled water uses. As shown in Table 2 below, this leaves approximately 3,600 AFY of recycled water that may be theoretically available in the future. Based on feasibility, cost, and other local considerations, roughly 3,500 AFY of recycled water is assumed to be available in the future, which includes 2,557 AFY of secondary treated effluent and 932 AFY of tertiary treated effluent. While small wastewater treatment plants are unable to provide the widespread benefits of larger wastewater treatment plants, they would provide opportunities for small scale projects through partnerships between local businesses and other local recycled water users.
24 Table 2: Wastewater Flows and Potential Recycled Water in the Upper Watershed
Agency WWTP Treatment
Level* Method** Disposal Current*** WW ADWF (AFY) Current† Recycled Water (RW) Use (AFY) Future†† WW ADWF (AFY) Future†† RW Use (AFY) Future†† Available WW (AFY)
AWA Camanche Lake
WWTP
Secondary Spray 56 56 110 110 0
AWA Gayla Manor WWTP Secondary Subsurface and Spray 5.5 0 22 0 (theoretical) 22
(assumed) 0
ARSA (City of Sutter
Creek)
City of Sutter Creek WWTP
Secondary ARSA 355 151 1,023 (650
to Ione)
968 (650 to Ione)
(theoretical) 55 (assumed)
0
CCWD La Contenta (Title 22) Tertiary Reclaimed 225 173 1,636 1,610 (theoretical) 26
(assumed) 0
EBMUD Camanche Lake
North Shore
Secondary Spray 1.6 0 1.6 ˆ 0 ˆ (theoretical)
1.6 (assumed)
0
EBMUD Recreation Pardee
Area
Secondary Spray 1.7 0 1.7 ˆ 0 ˆ (theoretical)
1.7 (assumed)
0
City of Ione Secondary Treatment
Plant
Secondary Ponds 471 278 1,505 436 1,069
City of Ione Reclamation Castle Oaks
Plant (COWRP)
Tertiary (Title 22)
Table 2: Wastewater Flows and Potential Recycled Water in the Upper Watershed
Agency WWTP Treatment
Level* Method** Disposal Current*** WW ADWF (AFY) Current† Recycled Water (RW) Use (AFY) Future†† WW ADWF (AFY) Future†† RW Use (AFY) Future†† Available WW (AFY) City of Jackson City of Jackson WWTP Tertiary (currently Secondary)
NPDES 527 0 753 0 753
City of Plymouth
City of Plymouth
WWTP
Secondary Spray 135 90 ˆ 909 90 ˆ 819
MHSD Mokelumne Hill WWTP Secondary Reclaimed 45 45 56 56 0
SASD San Andreas WWTP Secondary & NPDES Spray 336 0 482 0 482
VSPUD Valley Springs WWTP Secondary Spray 67 0 187 0 187
WCSD Wallace WWTP Tertiary Evaporation & Spray 21 0 179 0 179
Total Upper Watershed
2,709 1,255 8,341 4,764 (theoretical)
3,595 (assumed)
3,489 * Secondary = Secondary Level Treatment for Land Disposal, Tertiary = Tertiary Level Treatment for Land Disposal
** NPDES = Disposal to surface water via an NPDES permit, Reclaimed = Disposal of effluent via permitted reclaimed water uses, Spray = Disposal of effluent to above ground spray fields
*** Current volumes are from the year 2013. Italicized and bolded entries are from the years 2010 and 2011 or projected to 2013.
† Current volumes are based on the most recent available information. †† Future volumes vary among entities and range from the years 2025 to 2040.
9 January 2015
26 Lower Watershed
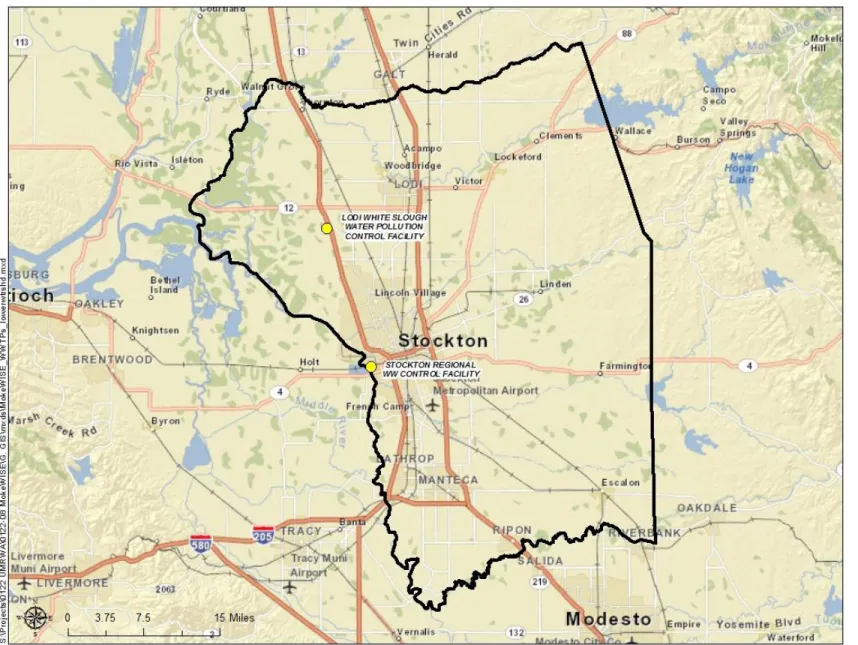
The following agencies own and operate the major wastewater collection and treatment facilities in the lower watershed: the City of Stockton and the City of Lodi. Both cities operate tertiary treatment facilities and discharge some, if not all, of the treated effluent to surface water. Together, the facilities collect and treat approximately 37,000 AFY of wastewater, which is projected to increase to 58,892 AFY in 2035. Total planned recycled water use is projected to amount to 2,842 AFY in 2035, with the remaining 56,050 AFY of tertiary-treated recycled water planned to be discharged to surface waters. The two wastewater treatment plants that lie within this area are described in greater detail below. All flows associated with the lower watershed are summarized in Table 3. Figure 6 identifies the location of each of the treatment plants discussed in the following sections.
9 January 2015
28 City of Lodi
The City of Lodi operates the White Slough Water Pollution Control Facility (WSWPCF) which currently treats approximately 7,100 AFY of wastewater, of which 1,642 AFY is used in the vicinity of WSWPCF for agricultural, aquacultural, and industrial uses. WSWPCF is capable of treating all wastewater flows to Title 22 tertiary standards and recently completed an upgrade which expanded capacity to 8.5 MGD (9,592 AFY) and allows the plant to meet future NPDES permit limits and long-term land management needs. The City currently discharges all wastewater effluent that is not used for recycled water into Dredger Cut, a slough flowing into the Delta (Lodi 2011, 23). It is anticipated that the City will use 2,842 AFY of recycled water in the future, which would theoretically leave 6,750 AFY of treated effluent available for reuse.
The City is considering an agricultural reuse project as part of its 2008 Reclaimed Water Master Plan. The project would provide approximately 3,700 AFY to agricultural and industrial customers adjacent to the WSWPCF (Lodi 2011,25). Therefore, of the 6,750 AFY of treated effluent that would theoretically be available in the future, 3,050 AFY is assumed to be available, after accounting for the agricultural reuse project.
City of Stockton
The City of Stockton owns and operates the Regional Wastewater Control Facility (RWCF), which provides tertiary treatment year round and was upgraded in May 2006. The RWCF currently treats 29,950 AFY of wastewater and until recently provided approximately 100 AFY of recycled water for agricultural purposes nearby. Future increases in wastewater flows are expected to approximately follow the population growth rate and projected water use of the City of Stockton Municipal Utilities Department (COSMUD) service area, reaching an estimated 49,300 AFY in 2035 (Stockton 2011, 4-15).
The City of Stockton holds a Section 1485 water right, which allows any municipality that disposes of treated wastewater into the San Joaquin River to seek a water right to divert a similar amount of water, less losses, from the San Joaquin River or the Delta, downstream of the wastewater discharge point. Because of this water right, the City’s water supply is connected to their wastewater discharge. While 49,300 AFY of treated effluent is theoretically available in the future, because this amount is being reused as part of the City’s water right, none would be available for use in a recycled water project.
Overall Lower Watershed Wastewater Flows
The total amount of wastewater collected and treated currently by the Cities of Lodi and Stockton is approximately 37,000 AFY. Of this, approximately 1,650 AFY is recycled for use. The cities are projected to collect and treat approximately 58,900 AFY at build-out, of which 2,842 is reasonably expected to be recycled. As shown in Table 3 below, this leaves approximately 56,050 theoretically available for recycling. However, based on currently planned projects and water right issues, 3,050 AFY of recycled water is assumed to be available in the future.
9 January 2015
30 Table 3: Wastewater Flows and Potential Recycled Water in the Lower Watershed
Agency WWTP TreatmentLevel* Method**Disposal Current***WW ADWF
(AFY)
Current†
Recycled Water (RW) Use
(AFY)
Future††
WW ADWF
(AFY)
Future††
RW Use (AFY)
Future††
Available WW (AFY) City of Lodi Pollution Control Facility White Slough Water
(WSWPCF)
Tertiary (Title 22)
Reclaimed & NPDES
7,095 1,642 9,592 2,842 (theoretical)
6,750 (assumed)
3,050
City of Stockton Control Facility (RWCF) Regional Wastewater (Title 22) Tertiary NPDES 29,950 0 49,300 0 (theoretical) 49,300
(assumed) 0
Total Lower Watershed
37,045 1,642 58,892 2,842 (theoretical)
56,050 (assumed)
3,050
* Secondary = Secondary Level Treatment for Land Disposal, Tertiary = Tertiary Level Treatment for Land Disposal
** NPDES = Disposal to surface water via an NPDES permit, Reclaimed = Disposal of effluent via permitted reclaimed water uses *** Current volumes are from the year 2013. Italicized and bolded entries are from the years 2010 and 2011 or projected to 2013.
† Current volumes are based on the most recent available information. †† Future volumes vary among entities and range from the years 2025 to 2040.