Benefit Realisation
Management
A Practical Guide to Achieving Benefits
Through Change
GeRald BRadley
Second edition
4
Overviewof
Benefit Realisation
Management (BRM)
‘Benefit realisation management is common sense but not common practice.’ (Gerald Bradley) ‘We need the courage to let go of the old world, to relinquish most of what we have cherished, to abandon our interpretations about what does and doesn’t work.’
(Margaret Wheatley)
4.1
Definitions and Scope
sigmadefines Benefit Realisation Management (BRM)as ‘the process of organising and managing, so that potential benefits, arising from investment in change, are actually achieved’.
In 1986 sigma originally named the processBenefit Management, but in 2003 switched to what was felt to be the more meaningful title of Benefit Realisation Management. MSP use both titles interchangeably, while others split the process into two parts – Benefit Management and Benefit Realisation, though it is difficult to see how this distinction works. Other terms used include Active Benefit Realisation (ABR).1
The OGC definition2 highlights that BRM is a continuous process running through the complete life-cycle. It should be the core process of any change initiative, the backbone of any programme, involving far more than a few benefit events early in the process. MSP 2007 highlights the centrality of BRM (see Figure 4.1), especially that it should be the driver for all change and programme activities including:
providing the mechanism for engaging stakeholders;
1 ABR is the term used by Dan Remenyi in Achieving Maximum Value from Information Systems. 2 ‘A continuous management process running throughout the programme’ (MSP 2003).
defining requirements and acceptance criteria; helping establish and maintain the Blueprint; determining project and programme boundaries; developing programme and project plans; identifying risks;
informing the Business Case; ongoing monitoring and reviews.
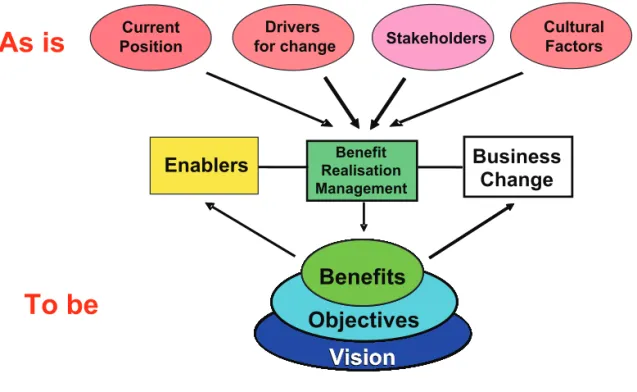
BRM recognises the starting position (current status, drivers for change, stakeholders and cultural factors); next through active engagement with the business, articulates and establishes the end point (vision supported by objectives and benefits). Then, and only then, BRM determines the changes required to achieve this goal – enablers and business changes (see Figure 4.2).
The BRM process can be applied to individual projects and programmes, portfolios of projects and programmes, or to business strategy. When we first started applying BRM, in the late 1980s, it was normally to specific projects, usually at a fairly late stage in their life-cycles, often subsequent to the implementation of some technology or a new system. While this remains a worthwhile activity, our involvement has gradually moved to
• • • • • • •
Figure 4.1 BRM – key driver for change Benefit Realisation Management Stakeholders Roles Reviews & Governance Delivery structures Blueprint Enablers & Business Changes Plans Risks Business Case Vision or End Goal Benefits Measures Engages Establishes Identifies & analyses Defines requirements Shapes Informs Determines,
tracks & reports Identifies Highlights dependencies Clarifies Qualifies Drives Benefit Realisation Management Stakeholders Roles Reviews & Governance Delivery structures Blueprint Enablers & Business Changes Plans Risks Business Case Vision or End Goal Benefits Measures Engages Establishes Identifies & analyses Defines requirements Shapes Informs Determines,
tracks & reports Identifies
Highlights
dependencies Clarifies
Qualifies Drives
earlier more strategic levels with strong focus on programmes, but embracing the whole spectrum from projects to business strategy.
Application of BRM should prove particularly fruitful in the area of ‘mergers and acquisitions’, where recent analysis3 has revealed that:
83 per cent of mergers fail to achieve announced expectations; nearly a half of all acquisitions are divested within five years.
The only valid reason for investing in change is to generate benefits. Benefits may be of value to the organisation making the investment, its staff, its customers, or even other parties; but without generation of benefits for at least one group of stakeholders, there is no justification for investing in change.
So benefits are the ultimate deliverable and BRM should be the central theme or core of any change initiative. It should lay the foundations for Project or Programme Management rather than being, as so often, the afterthought.
Sometimes people ask whether BRM is yet another new management fad. Their concern arises from the fact that their organisation is already overwhelmed with different approaches, such as European Foundation for Quality Management (EFQM), Balanced Business Scorecard (BBS), Prince 2, Best Value, Value Management, Lean Thinking and Programme Management. Although BRM is relatively new, elements are found in many
3 www.mapartners.net (August 2005).
• •
Figure 4.2 Focus on the real goal – the end point
As is
Business
Change
To be
Objectives
Benefits
Vision
Benefits
Objectives
Vision
Benefits
Objectives
Vision
Benefits
Objectives
Vision
Benefits
Objectives
Vision
Benefits
Objectives
Vision
Benefits
Objectives
Vision
Current PositionEnablers
Stakeholders Cultural Factors
Benefits
Objectives
Vision
Benefits
Objectives
Vision
Benefits
Objectives
Vision
Benefits
Objectives
Vision
Benefits
Objectives
Vision
Benefits
Objectives
Vision
Benefits
Objectives
Vision
Benefits
Vision
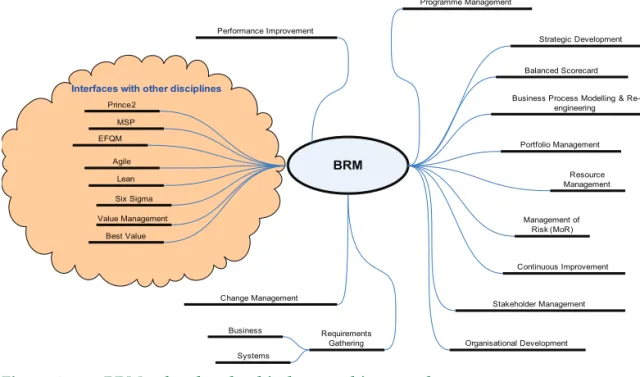
Drivers for change Benefit Realisation Managementother management approaches, and it is much more than a mere fad. It is probably the approach for which all the others have been waiting, bringing meaning and purpose to activities such as change management, requirements analysis, project management (for example, Prince 2) and programme management (for example, MSP). And as one manager rather succinctly put it, BRM is the glue that binds together all the other management techniques (see Figure 4.3).
BRM is also central to other recognised disciplines connected with change, as illustrated in Figure 4.4.
Figure 4.3 BRM – the glue that binds everything together BRM
Portfolio Management Programme Management
Business Process Modelling & Re-engineering Requirements Gathering Stakeholder Management Business Systems Balanced Scorecard Resource Management Change Management Performance Improvement Continuous Improvement Organisational Development Management of Risk (MoR) Strategic Development Six Sigma Lean MSP Agile Prince2 EFQM Best Value Value Management
Interfaces with other disciplines
Figure 4.4 The relationship between BRM and other management disciplines Stakeholder Management Change Management Programme Management Portfolio Management Project Management Performance Management
Benefit
Realisation
Management
(BRM)
Once, at the end of an executive briefing on BRM for directors of a UK high street bank, the MD, having asked his colleagues for their reactions, said in his summing up –‘this isn’t just about projects, it’s about everything that we do’. How right he was.
4.2
Why BRM is of Increasing Importance
There are many reasons why BRM is of increasing importance today. In the last few years there has been a noticeable increase in the attention given to benefit realisation by management at all levels. In particular the UK Government now puts a strong emphasis on benefits, which is being channelled directly to government departments, but also indirectly through the Treasury, the NAO and the OGC. In the private sector, chief executives, managing directors and other senior managers are mandating the application of BRM to programmes and projects, demanding increased quality and rigour in business cases – and more meaningful benefit tracking and reporting.
This top level drive has probably arisen as a consequence of two factors:
In an increasingly competitive global economy, organisations cannot afford to continue wasting costly investment. Organisations must expect benefits from change and ensure that these expectations are fulfilled.
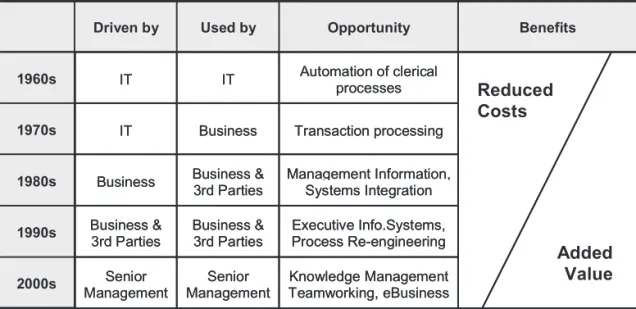
Business environments, both private and public, are increasingly complex and changing rapidly, making benefit realisation more difficult. This is evident from a historical perspective. The diagram below (Figure 4.5) traces the development of computing in business over five decades.
•
•
Figure 4.5 how the decades of computing have impacted benefit realisation Driven by Used by Opportunity Benefits
1960s IT IT Automation of clericalprocesses
1970s IT Business Transaction processing
1980s Business Business &3rd Parties Management Information,Systems Integration
1990s Business &3rd Parties Business &3rd Parties Process Re-engineeringExecutive Info.Systems,
2000s ManagementSenior ManagementSenior Teamworking, eBusinessKnowledge Management
Added Value Reduced
Costs
Driven by Used by Opportunity Benefits
1960s IT IT Automation of clericalprocesses
1970s IT Business Transaction processing
1980s Business Business &3rd Parties Management Information,Systems Integration
1990s Business &3rd Parties Business &3rd Parties Process Re-engineeringExecutive Info.Systems,
2000s ManagementSenior ManagementSenior Teamworking, eBusinessKnowledge Management
Added Value Reduced
Between 1960 and 1980, changes were largely initiated by IT functions, not by business units. This is still true in some organisations today. In the 1960s, benefits were predominantly ‘reduced costs’ from automating clerical processes, such as payroll and accounting, whereas today the majority of benefits are aspects of ‘added value’.
In many cases, the IT project team was made responsible for identifying the benefits, making the Business Case, and (if the organisation bothered to check whether they had been achieved) for tracking and reporting the benefits. I believe this responsibility was wrongly placed, though in the 1960s it was usually effective for the following reasons:
the nature of the benefits – reduced costs from automating clerical processes – could be analytically determined and IT people are good at analysis; since the majority of benefits were financial, the justification for inclusion in the Business Case was easy to construct;
the majority of benefits would have been realised soon after implementation, while the project team was still around to verify their realisation.
This is inadequate for many of the changes undertaken today, for example the move to eBusiness and eCommerce. In these situations:
benefits will not be fully identified without adequate engagement of the business community;
business cases will be more complex with justifications often dependent on non-financial benefits;
the majority of benefits will be realised after the project team has moved on. In the 1960s and 1970s, projects were frequently sponsored and funded by a single business department, within which the change occurred and where the benefits would be realised. In contrast, today’s change initiatives, especially the larger ones, involve a wide range of stakeholders, crossing functional and sometimes organisational boundaries.
A further complicating factor is the speed of change. In the 1960s, the internal and external environments would have been similar at the beginning and at the end of a two-year project, the goalposts remaining unmoved. Today these factors will have changed even during the life of a six-month project.
4.3
Common Issues Addressed by BRM
Many problem situations may be solved, or at least alleviated, by BRM. Some may appear to have little to do with benefits, and more to do with change or project management. But since the only meaningful reason for change and for projects is the realisation of benefits, BRM has a much wider impact than many people appreciate.
• • • • • •
The table in Figure 4.6 lists many of the problem situations addressed by BRM with a brief indication of how it helps, and the section/chapter(s) in which the issues are addressed:
4.4
How Different Stakeholders can Benefit from BRM
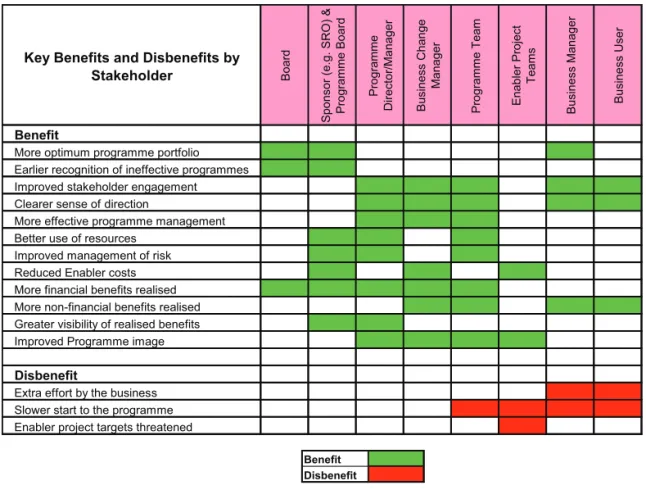
The many stakeholders are likely to be affected in different ways by BRM. The table in Figure 4.7 shows how the benefits and disbenefits of BRM relate to some of these stakeholders.
Figure 4.6 how BRM helps in 25 problem situations
Situation How BRM helps Section
1 Management are not committed to benefit realisation BRM is helping to change management attitudes, but it may take time 26 2 It is difficult to get the staff time for BRM activities BRM can show why this time investment is vital if historic bad performance is to be changed 4.5 3 The vision or end-goal is difficult to define BRM process includes structures techniques for moving from drivers to vision & objectives 8.6 4 Stakeholders do not own the vision Use of the workshop process and vision/objective setting techniques 2.6, 8.7 5 Stakeholders are not engaged effectively The BRM Methodology and the related workshop process facilitates stakeholder engagement 2.5, 2.6 6 Portfolio of programmes not aligned to organisation's mission BRM is strong on alignment but also prefers to start with the organisation's Mission or Strategy 8, 24 7 The dominant focus is on technology - enablers BRM is excellent at shifitng the focus from technology to business change and benefits 1.3-1.7 8 The life-cycle is long (e.g. greater than 4 years) BRM's use of maps with intermediate milestones enables progress to be steadily monitored 9.5, 15 9 There are dependencies between projects Mapping techniques can show dependencies and indicate programme boundaries 8.7 10 There are dependencies between programmes Benefit Profiles and Maps can register dependencies and create prompts to monitor dependent activity 13 11 Benefits are dependent on several projects BRM will treat these as programme benefits and manage accordingly 2 12 Business Cases are difficult to write BRM produces a Benefit Realisation Plan which is often one of the most difficult elements of a case 19 13 There is complexity or large-scale change BRM ensures that change is identified and managed with the same importance as enablers 5.1, 11, 12.3 14 Resources are scarce BRM helps to focus available resources on areas of greatest need or impact 14.6 15 Business change is not driven by benefits BRM's Maps and Investment Assessment Matrices use benefits to drive change 11, 13 16 There is resistance to change Through Benefit Distribution analysis BRM can help to anticipate and overcome resistance 9.4a,14.6 17 Communication is poor or difficult BRM's use of pictures, maps, matrices, charts and use of colour significantly aids communication 13 18 There is lack of trust BRM's maps make implicit assumptions explicit and so increases transparency and trust 9.6 19 There are many options for rolling-out the solution Benefit considerations should drive implementation and so maximise the overall investment return 14.5 20 Measuring benefits is difficult This can be for a variety of reasons but often because BRM has not been applied from the start 4.8 21 Benefits are intangible The Sigma Value Types framework shows that most benefit are in fact tangible 9.4d 22 It is difficult to attribute the benefits to the change Monitoring benefit achievement through a Benefits Map increases confidence in respect of attribution 15.2 23 The same benefit is claimed by more than 1 project Use Benefits Maps to avoid double counting and Measures Dictionary to apportion between projects 9.1 24 Benefits are not adequately tracked or reported Benefit measurement is an intrinsic part of BRM but BRM first lays the necessary foundations 15 25 Benefits are not being realised The whole BRM process works towards benefit realisation and can sometimes be applied retrospectively 23
This table, generally referred to as a Benefit Distribution Matrix, is a common deliverable from the early stages of the BRM Process.
4.5
The Return on Investment from BRM
The Return on Investment (ROI) generated by BRM stems from the following: elimination, or reduction in the number, of wasted investments; earlier realisation of benefits;
increased realisation of benefits; sustained realisation of benefits.
The ROI has two main components – an improved return from each investment (doing things right), and a contribution from an improved investment portfolio (doing the right things).
• • • •
Figure 4.7 Benefits and disbenefits of BRM by stakeholder
Benefit Disbenefit
Key Benefits and Disbenefits by Stakeholder Boar
d
Sponsor (e.g. SRO) & Pr
og ra m m e Bo ar d Pr og ra m m e Director/Manager Bus in es s C ha ng e M an ag er Pr og ra m m e Te am En ab le r P ro je ct Te am s B us in es s M an ag er B us in es s U se r Benefit
More optimum programme portfolio Earlier recognition of ineffective programmes Improved stakeholder engagement Clearer sense of direction
More effective programme management Better use of resources
Improved management of risk Reduced Enabler costs More financial benefits realised More non-financial benefits realised Greater visibility of realised benefits Improved Programme image
Disbenefit
Extra effort by the business Slower start to the programme Enabler project targets threatened
Bo
ar
d
Sponsor (e.g. SRO) & Pr
og ra m m e Bo ar d Pr og ra m m e Director/Manager Bus in es s C ha ng e M an ag er Pr og ra m m e Te am En ab le r P ro je ct Te am s B us in es s M an ag er B us in es s U se r
iMPRoVed RetuRn fRoM eaCh inVeStMent
Without a structured approach, such as BRM, most organisations probably achieve between 10 per cent and 25 per cent of potential benefits from any significant change initiative.4 With BRM these results can usually be trebled. Since the cost of BRM, for a
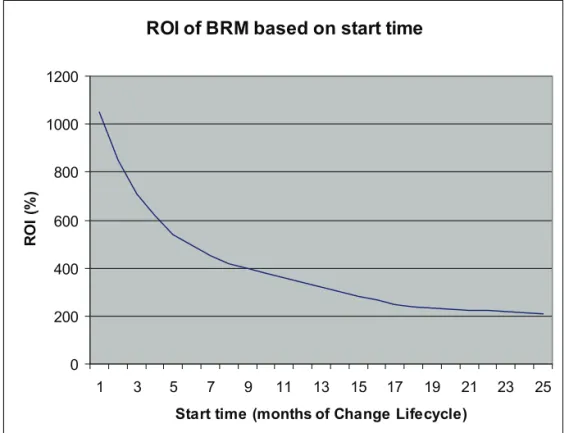
particular investment, is typically between 4 per cent and 6 per cent of total investment costs,5 the ROI from BRM is likely to exceed 1000 per cent, provided it is applied from
the earliest possible stage of the investment life-cycle. For example: an investment, of say £1000, where the benefits are expected to equal the costs (hopefully worse case scenario), is likely to realise benefits of less than £250 without BRM, and greater than £750 with BRM. If the cost of BRM is 5 per cent then the ROI is 1000 per cent; if it is only 4 per cent then the ROI from BRM is 1250 per cent.
If BRM is introduced late in the change life-cycle, the return, though much lower, is usually still good. The diagram below (Figure 4.8) illustrates how the ROI is likely to vary depending on when BRM is first applied.
4 This cannot be scientifically proved, but is based on sigma’s experience over 20 years. It has also been confirmed many times during the past six years, by the views of managers participating in sigma’s management seminars on BRM.
5 Based on sigma’s experience.
Figure 4.8 ROI of BRM based on start time
ROI of BRM based on start time
0 200 400 600 800 1000 1200 1 3 5 7 9 11 13 15 17 19 21 23 25
Start time (months of Change Lifecycle)
RO
I (
%
Note how the ROI of BRM falls significantly if it is not applied from the earliest point. A common nightmare is being asked to help with BRM in situations where the programme organisation is already set in stone and the poorly expressed Vision Statement is considered immutable!
iMPRoVed RetuRn fRoM an oPtiMiSed PoRtfolio
In addition to improving the return from each investment, BRM can be used to create and continuously refine the complete portfolio of investments in change. In this situation the potential improvement depends on the quality of the starting portfolio and the processes employed to improve and maintain the portfolio. Depending on the organisation’s success in these areas, the improvement from the application of BRM will vary, probably between 25 per cent and 100 per cent. Chapter 24 describes how BRM can be used to create and maintain a high value portfolio.
4.6
The Process for BRM
sigma’s approach to BRM puts particular emphasis on: identifying and engaging potential stakeholders;
establishing a clear vision and objectives which are owned by key stakeholders; identifying a comprehensive set of realistic benefits, which support the objectives and are owned by the relevant stakeholders;
relating these benefits in ‘cause and effect’ Benefits Maps, providing intermediate milestones and ensuring improvements in end benefits are attributed to the programme;
identifying the details of the required enablers and changes using Benefit Dependency Maps (BDMs);
prioritising paths in the maps in order to focus investment, resources and activities;
determining the most effective way to procure the enablers and implement the changes, either through existing initiatives or by creating new ones; justifying and establishing new initiatives such as projects and programmes; using Investment Assessment Matrices (IAM) to check alignment and balance, to manage expectations and to communicate significant messages;
using measures to track performance, throughout and beyond the programme life-cycle, to demonstrate success, and to take corrective action if intermediate targets are not fully achieved.
1. 2. 3. 4. 5. 6. 7. 8. 9. 10.
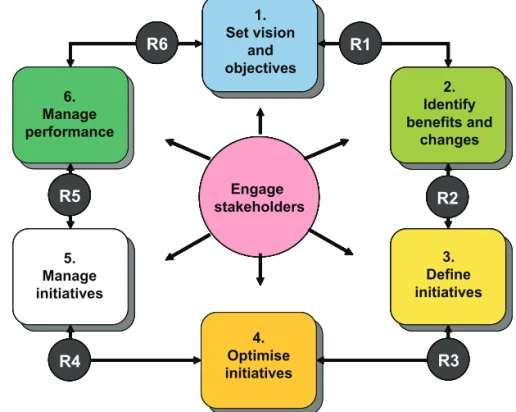
This approach can be organised in six consecutive phases as represented in Figure 4.9 below:
The process is cyclical – it can be entered at any phase – though starting at Phase 1, setting vision, would be the optimum entry point. This flexibility allows for the application of BRM to initiatives which are well under way. Engaging stakeholders throughout the change process is a critical success factor.
It is also iterative, enabling return to a previous point. This is useful since more detailed analysis frequently prompts refinement of earlier definitions and plans. A change in the external environment may also require a return to and re-work of earlier phases.
It is also applicable at any level within an organisation – for example at:
corporate or group level to determine business direction and strategy; divisional level to determine the optimum portfolio of change investments; programme level (within a single division or cross-divisional);
project level.
A slightly modified version of this diagram forms part of MSP guidance in MSP 2007 Figure 6.1.
• • • •
Figure 4.9 The high-level change process
1. Set vision and objectives 2. Identify benefits and changes 3. Define initiatives 4. Optimise initiatives 5. Manage initiatives 6. Manage performance R6 R5 R4 R3 R2 R1 Engage stakeholdersEngage stakeholders 1. Set vision and objectives 2. Identify benefits and changes 3. Define initiatives 4. Optimise initiatives 5. Manage initiatives 6. Manage performance R6 R5 R4 R3 R2 R1 Engage stakeholdersEngage stakeholders
4.7
Phases Within the BRM Process
PhaSe 1 – Set ViSion and oBjeCtiVeS
Initially a vision, followed by supporting objectives, should be established, ideally with no preconceived ideas about solution (enablers and business changes, or delivery mechanisms, such as programmes or projects). In this situation, no Programme or Project Managers having been nominated, the ideal person to facilitate this initial activity is a Benefit Facilitator (if such a role exists – see Chapter 6.13 for a definition) or a Business Change Manager with BRM skills and experience.
With continued stakeholder engagement, supporting objectives are then established, related in a Strategy Map, and then analysed to determine two or three primary or bounding objectives. Bounding objectives are end objectives for the programme, which bound its scope, and are ideal for communicating programme purpose to a wider audience. They also provide a solid basis for building Benefits Maps.
An example of an Strategy Map with three primary or bounding objectives (darker blue), linked to a vision, is given in Figure 4.10.
This phase must achieve four principal aims:
to clarify and capture the pressures and opportunities (drivers) which have triggered the need for change;
to determine or clarify a vision for the investment, which will successfully address all the drivers;
•
•
Figure 4.10 Strategy Map with vision and three bounding objectives
People living together peacefully and happily To reduce antisocial behaviour and disorder To reduce the causes of crime To bring more offenders to justice To reduce the number of crimes To reduce drug mis-use To improve cross-agency co-ordination To reduce the fear of crime To understand the causes of crime To spread best practice in crime reduction People living together peacefully and happily To reduce antisocial behaviour and disorder To reduce the causes of crime To bring more offenders to justice To reduce the number of crimes To reduce drug mis-use To improve cross-agency co-ordination To reduce the fear of crime To understand the causes of crime To spread best practice in crime reduction
to derive a set of objectives or measurable end goals, which fully support the vision, and then to select a sub-set of these objectives to bound a feasible change initiative;
to check that senior stakeholders have agreed to the vision and are committed to achieving the selected objectives.
In some situations, particularly at programme and project levels, a vision may not be considered necessary; however a set of clear objectives will always be required.
PhaSe 2 – identify BenefitS and ChanGeS
Working back from these primary objectives, from right to left, deriving routes to reach the agreed destination, first a set of end benefits, and later a whole network of intermediate benefits are determined. This is best undertaken in a workshop involving key stakeholders and facilitated by an experienced BRM practitioner.
The complete network is a Benefits Map, which should contain the full set of benefits, all linked to one of the primary objective(s), in cause-and-effect relationships. Sometimes it is helpful to have a separate Benefits Map for each primary objective; sometimes it is more useful to combine them in a single Map.
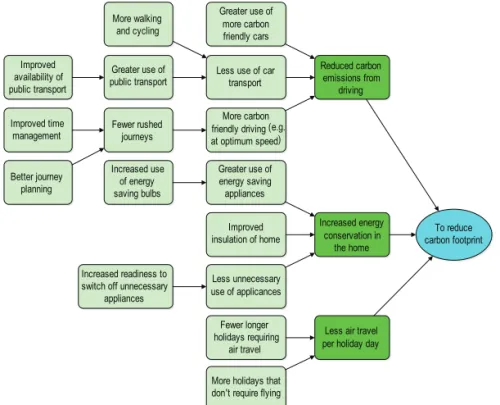
To illustrate the approach I have applied it in a domestic situation to the objective ‘to reduce carbon footprint’. The corresponding Benefits Map is given in Figure 4.11.
•
•
Figure 4.11 Benefits Map for ‘To reduce carbon footprint’
To reduce carbon footprint Reduced carbon emissions from driving Increased energy conservation in the home
Less air travel per holiday day Less use of car
transport Greater use of
more carbon friendly cars
More carbon friendly driving (e.g. at optimum speed) Greater use of public transport Improved availability of public transport Better journey planning Increased use of energy saving bulbs More walking and cycling Greater use of energy saving appliances Less unnecessary use of applicances Improved time management Improved insulation of home Fewer longer holidays requiring air travel More holidays that don't require flying Increased readiness to
switch off unnecessary appliances
Fewer rushed journeys
Once the Benefits Map(s) have been refined and agreed, benefits may be scored using a weighting algorithm, beginning with the primary objectives. Scoring processes are fully described in Section 9.7 and provide a structured process for capturing priorities. Subsequently the weighted paths and benefit scores can be used to prioritise investment in enablers and business changes.
The result of applying weights and then calculating scores, for the above Benefits Map, is given in Figure 4.12.
The Benefits Map, with or without the benefit scores and path weightings, is then used to identify required enablers and business changes, this time using a left to right process. The resulting map, referred to as a Benefit Dependency Map (BDM), is in effect an early component of the Blueprint for the Vision. Using the above example a partially developed BDM is shown in Figure 4.13.
Finally within this phase, one or more measures and a first estimate of target values are identified for each benefit.
Figure 4.12 Benefits Map for objective: ‘To reduce carbon footprint’ with weighted
paths and benefit scores
1,000 To reduce carbon footprint 500 Reduced carbon emissions from driving 150 Increased energy conservation in the home 350 Less air travel per
holiday day 150
Less use of car transport
150 Greater use of more carbon friendly cars
200 More carbon friendly
driving (e.g. at optimum speed) 112 Greater use of public transport 45 Improved availability of public transport 80 Better journey planning 24 Increased use of energy saving bulbs 38 More walking and
cycling 60 Greater use of energy saving appliances 60 Less unnecessary use of applicances 120 Improved time management 30 Improved insulation of home 175 Fewer longer holidays requiring air
travel
175 More holidays that don't require flying 60
Increased readiness to switch off unnecessary
appliances 200 Fewer rushed journeys 50% 15% 35% 30% 30% 40% 40% 20% 40% 50% 50% 25% 75% 40% 100% 60% 40% 40% 100% Intemediate Benefit End Benefit Primary / Bounding Objective Key Intemediate Benefit End Benefit Primary / Bounding Objective Key
PhaSe 3 – define initiatiVeS
The required enablers and changes, identified in Phase 2, are then processed and analysed including:
categorising them to facilitate the identification of duplicate changes, and consolidating those identified;
checking whether they are already planned as part of an existing project or programme;
determining likely costs, resource requirements and timescales for any changes not already planned;
relating these costs to the BDM, preferably with benefit scores and weighted paths, to prioritise and evaluate options and to commission potential change; •
•
•
•
Figure 4.13 BDM ‘To reduce carbon footprint’ with weighted paths and benefit
scores
Key
1,000 To reduce carbon footprint 500 Reduced carbon emissions from driving 150 Increased energy conservation in the home 350 Less air travel perholiday day 150
Less use of car transport
150 Greater use of more carbon friendly cars
200 More carbon friendly driving (eg at optimum
speed) 112 Greater use of public transport 45 Improved availability of public transport 80 Better journey planning 24 Increased use of energy saving bulbs
38 More walking and
cycling
60 Greater use of energy
saving appliances
60 Less unnecessary use
of applicances 120 Improved time management 30 Improved insulation of home 175 Fewer longer holidays
requiring air travel
175 More holidays that don 't
require flying 60
Increased readiness to switch off unnecessary
appliances 200 Fewer rushed journeys 50% 15% 35% 30% 30% 40% 40% 20% 40% 50% 50% 25% 75% 40% 100% 60% 40% 40% 100% Lobby national and
local government
New Bicycle
Delegate more
More efficient boiler
Check & remedy where insulation could be improved
Investigate UK & Eurpoean options Start working less
Enabler Business Change Intemediate Benefit End Benefit Bounding Primary / Objective
packaging changes together into projects and programmes, and securing the necessary resources and funding;
establishing the most appropriate organisation, management and governance structures.
PhaSe 4 – oPtiMiSe initiatiVeS
Irrespective of whether Phase 3 results in a single programme – including projects, a portfolio of projects or a portfolio of programmes – there are usually opportunities to optimise the combination in order to maximise benefit realisation.
One of the tools available to support this optimisation is the Investment Assessment Matrix (IAM) (see Section 13.3). It can also be valuable for checking alignment and balance and to test for serious gaps.
Earlier realisation of the higher-value benefits is often achieved by using benefits to plan, sequence and drive implementation and roll-out.
PhaSe 5 – ManaGe initiatiVeS
Programmes and projects commissioned in Phase 3 are then managed and monitored with particular attention to the management of business change, optimised roll-out and the overcoming of any stakeholder resistance.
The BDM remains useful for steering the overall activity.
Milestones, for a mixture of completed enabler and change activities and the realisation of early benefits, will be used to monitor progress.
PhaSe 6 – ManaGe PeRfoRManCe
In this phase benefit realisation is monitored and reported, contributions for multiple programmes and projects are consolidated, and appropriate actions to compensate for shortfalls in target achievement are initiated.
Although progress towards the vision is assessed in this phase, measuring and tracking benefits should have begun as soon as the measures were identified – in Phase 3 or possibly Phase 2.
StaRtinG Point
I have already indicated that the optimum entry point into this process is Phase 1 – Set Vision and Objectives, but because the process is flexible and scalable, it is possible to begin with another phase. The brief description given above assumes starting with a clean sheet and some clear drivers for change or an agreed or embryonic vision. If a programme has
•
already been set up and some projects are already in place, then the starting point may be Phase 3. In this case, some of Phase 1 and 2 activities should be undertaken in Phase 3.
4.8
Managing BRM Information – Key BRM Documents
A considerable amount of information is required to enable the programme team to manage benefit realisation and the dependent changes, some of which will be required by decision-making bodies involved in governance and review. A single repository for all this information is desirable, from which extracts can easily be made to satisfy particular needs; ideally this would be an integrated electronic database with a powerful reporting capacity (for the specification of such a system see Chapter 29). If an electronic system is not available, a set of Benefit Profiles might provide the appropriate repository.
There is a plethora of recommended documents for BRM, which relate either directly to benefit realisation or to the management of dependent changes, including programme, project and stakeholder management. Most methodologies specify as mandatory a large number (sometimes more than 20) of these documents, occasionally including several versions of the same document such as a Business Case.
Because in these circumstances a programme manager may feel overwhelmed, separation may develop between the documents used for governance and those used for managing the programme, with the consequent risk that governance and management are based on different sets of information. sigma has therefore sought to rationalise the number of documents around five themes, as described in Chapters 18–22, resulting in the following key documents:
A Benefit Realisation Plan (BRP) describing all the benefits with their measures and targets, including how, when and where their realisation is expected; Stakeholder Management Plan describing how stakeholders are to be engaged throughout the life-cycle;
Blueprint or business model describing the planned integration of enablers and business changes;
Business case;
Programme Management Strategy.
4.9
Is There an Alternative to BRM?
Some Frequently Asked Questions:Is it important to apply the whole BRM process? • • • • • •
Can we just use a few of the techniques? Is it important to start at the beginning?
For effective benefit realisation, I believe it is essential to apply all steps of the BRM process. But since it is a scalable process, the particular tools and techniques, employed at each stage, may depend on the size and nature of the proposed change, and on the type and culture of the organisation.
Most organisations already apply some of the suggestions made in this book. But unless these are applied as part of a sequential and comprehensive process, their effects are likely to be limited, possibly even negligible. This is borne out by the fact that many organisations seem dissatisfied with their current benefit realisation performance. People often say that they particularly want help with the measurement of benefits, as it is this that they find most difficult. Measurement may be difficult and there are many factors to consider (see Chapters 10 and 15), but investigation often reveals that difficulty with measurement is largely a symptom of deeper problems. If solid foundations have been laid, construction of the finishing touches is inevitably easier and potentially more valuable.
When I have probed this particular concern about measurement, the responses have often followed a similar pattern, ultimately leading to the root cause that BRM has been applied either not at all or too late. The diagram below (Figure 4.14) illustrates the pattern of analysis which often emerges.
• •
Figure 4.14 Why measurement can be difficult
Measurement is difficult Can’t find suitable measures People are unwilling to measure
Not sure how to satisfy management Benefits are too vague Benefits are not owned Context for benefits is unclear There are no Benefit Maps Stakeholders have not been
involved It is difficult to attribute the benefits Managers are only interested in cash benefits Not sure what
is a good measure
Benefit distribution has not been
agreed Vision and objectives
have not been agreed, documented and shared There is no Measures Dictionary There is no Benefit Facilitation Role Concerns about double counting Unsure about the value of measurement BRM has not been applied
Apply BRM and make common sense common practice. Map a clear path to bridge the gap from where you are to your vision of where you want to be.
Therefore there is no sensible alternative to BRM! This is a conclusion supported by the diagram’s logic and illustrated by the following Benefit Management fable, used by sigma
in its marketing literature for several years:
A farmer once planted a vineyard. He prepared the ground with care, and devoted much time to choosing the best vines, planting and nurturing them lovingly, using the best methods available. As the grapes began to form he worked long and hard trimming the bunches to the most beautiful shapes and sizes.
Then he sat back pleased that his work was done.
He made no plan for harvesting or processing his crop. Although a few bunches
were picked and eaten and a neighbour made good wine with a few that overhung
his fence, most of the grapes rotted on the vines, and disease set in which reduced their fruitfulness next year.