A b s t r a c t. An apparatus developed for measurement of dynamic friction coefficient is presented. The dynamic friction coefficient of paddy grains was determined and studied in three varieties (Alikazemy, Hashemi and Khazar), at two levels of moisture content (12 and 23% w.b.), three levels of peripheral speed (0.5, 3.5 and 6.5 cm s-1) and on three contact surfaces (black, mild and galvanized sheets). The experiments were arranged as a split-split plot fitted into randomized complete block. The results of variance analysis revealed that the effects of grain moisture content, variety, contact surface, peripheral speed and their inter-actions were significant (p<0.01) on dynamic friction coefficient. With increase in the moisture content of grain and peripheral speed of disc, dynamic friction coefficient increased. Among the contact surfaces, the highest and lowest values of dynamic friction coeffi-cient were 0.567 and 0.314 and belonged to the black and galvani-zed sheets, respectively. Also, among the varieties, Alikazemi and Khazar varieties had the maximum and minimum mean values, respectively.
K e y w o r d s: physical properties, paddy, contact surface, dynamic friction coefficient
INTRODUCTION
Cereals are the most important food products in the world. Among cereals, after wheat, rice is cultivated on the most extensive area of cultivated lands in the word. Today in Iran, the cultivated area of rice is about 615 000 ha (Askari Asli-Ardeh and Abbaspour-Gilandeh, 2008). Among ce-reals, rice constitutes the basic food for great numbers of human beings.
Static and dynamic friction coefficients of grains on various surfaces are needed for designing agricultural crop storage structures, handling and transporting equipments, such as belt and screw conveyers, and also needed in order to determine yield milling and post harvesting equipments (Bickert and Buelow, 1966; Mohsenin, 1980; Sitkei, 1986).
The effect of various factors on coefficient of friction has been investigated by several workers (Ghasemi Varnam-khastiet al., 2007; Joshiet al., 1993; Molendaet al., 2000; Shepherd and Bhardwaj, 1986; Synderet al., 1967). Many re-searchers, determining the static and dynamic friction coef-ficients of agricultural materials, have observed an increase in dynamic friction coefficients with an increase in moisture content (Coskoner and Karababa, 2006; Kappuswamy and Wratten, 1970; Kashaninejad and Rezaghah, 2007). Gupta and Das (1998) reported that dynamic friction coefficients of sun flower seed increased linearly with increase in the moisture content, irrespective of the nature of the surfaces. Chung and Verma (1998) reported that the effect of moisture content was found to be more pronounced on coefficient of static friction than coefficient of dynamic friction for soy bean, red kidney bean and peanut. The results of this re-search showed that the surface material has a greater effect on dynamic friction coefficient than on the coefficient of static friction. Kappuswamy and Wratten (1970) in their ex-periments aimed at determination of static and dynamic friction coefficients of paddy grains observed that the coeffi-cient of dynamic friction increased generally with increase in velocity at all moisture content.
The effect of grain moisture content, contact surface and peripheral speed of the sample grains on dynamic friction coefficient of paddy grains was investigated using the de-signed apparatus.
MATERIALS AND METHODS
An apparatus was designed and constructed to determine the dynamic friction coefficient of paddy grains. It consisted of a sample holder that was supported by a solid aluminium rod of 13 mm diameter. The aluminium rod maintained the
Determination of dynamic friction coefficient of paddy grains on different surfaces
E. Askari Asli-Ardeh, Y. Abbaspour-Gilandeh, and S. Shojaei
Department of Agricultural Machinery, University of Mohaghegh Ardabili, Ardabil, Iran Received February 26, 2009; accepted July 17, 2009
© 2010 Institute of Agrophysics, Polish Academy of Sciences
*Corresponding author’s e-mail: [email protected]
A
A
Agggrrroooppphhyhyysssiiicccsss
sample holder in a horizontal position above and parallel to a rotating disc. The disc was rotated by an electro- motor. A inverter was applied to verify the peripheral speed of rotating disc. The end of the aluminium rod was bolted to a supporting frame. The sample holder was made of two PVC cylinders with inner diameters of 110 and 200 mm. The height of the cylinders was 56 mm. The space between the two cylinders was equally divided by three baffle plates. These plates prevented the grain sample from rotation with the rotating disc. Different contact surfaces were fixed on the disc. The clearance between the rotating disc and the bottom of the cylinders (0.3-0.5 mm) was adjusted with vertical movement of the sample holder and the fastening of the bolts. This was arranged such that the sample holder had no contact with the test surfaces. The rotational movement of the disc imparted torque motion to the sample holder and then to the aluminium rod via the sample. While a normal force acted between the sample and the test surface, the vertical plates resisted any tendency of the sample to rotate with the disc. Thus the net force exerted a torque on the supporting aluminium rod. For determining the torsion torque, four strain gauges, each with a resistance of 120 and gauge factor of 2, were attached on the aluminium rod and aligned at 45° with the central axis. The strain gauges were connected to a Wheatstone-bridge circuit and data were re-corded by a DT800 data logger which was connected to a per-sonal computer. The frequency of data taking was 1 datum in each 5 s and data were recorded online within 1.5 min. The apparatus was calibrated by applying known forces to the aluminium rod through a torque arm with known length. In order to prevent device vibration, weights were used on the frame of the apparatus.
Three varieties of paddy grain (Alikazemi, Hashemi and Khazar) were used (obtained from the Rice Research Insti-tute, Gilan, Iran). The grains were manually cleaned to remo-ve all foreign matter such as dust, chaff, immature and bro-ken grains. The initial moisture content of the grains was determined with a digital moisture meter model GMK-303.
In order to obtain samples with desired moisture con-tent, immediately after harvesting (with moisture content of 25% w.b.), the amount of water (distilled) required to pro-vide the needed moisture content of grain was calculated by the following equations, and then added to the grain and mixed thoroughly. The equations used are (Chakraverty and Singh, 2002):
wi mi wf m
f 1
100 1 100
-æ è
ç ö
ø
÷= æ -è ç ç
ö ø ÷
÷, (1)
ww=wf -wi, (2)
where:mi– initial moisture content of sample (%, w.b.), mf – final moisture content of sample (%, w.b.),wi– initial mass of sample (g),wf – final mass of sample (g),ww– mass of water added to sample (g).
The samples were then poured into separate polyethy-lene bags and the bags were sealed tightly. The samples were kept at 10°C in a refrigerator for 2 days to enable the moistu-re to distribute uniformly throughout the sample (Reddy and Chakraverty, 2004). For accomplishing the tests, 350 g of the grains were evenly distributed in each division compart-ment of the sample holder.
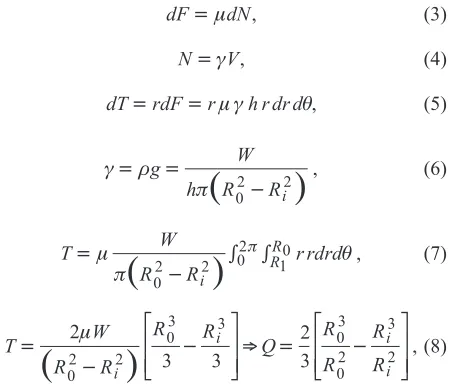
The torque which was transferred to the aluminium rod due to the effect of friction force between paddy grains and contact surface was calculated by the following equations and the free diagram (Fig. 1):
dF= mdN, (3)
N= gV, (4)
dT=rdF= m gr h r dr dq, (5)
(
)
g r p
= =
-g W
h R02 Ri2
, (6)
(
)
T W
R R
r rdrd i
R R
=
- ò ò
m
p q
p
0
2 2 1
0
02 , (7)
(
)
T W
R R
R R
Q R
R R
R i
i i
i
=
-
-é
ë ê ê
ù
û ú
úÞ =
-é
ë ê
2
3 3
2 3 0
2 2
0
3 3
0 3
0 2
3 2
m
ê
ù
û ú ú, (8)
where:m– coefficient of friction (-),T– measured torque (N m), W– total sample weight on the rotating surface (N),Q– ef-fective torque arm (m), R0 – inner radius of the outer cylinder of the sample holder (m),Ri– inner radius of small cylinder of the sample holder (m),h– height of cylinder of the sample holder (m),g– specific weight of paddy grain (N m-3),V– volume of cylinder of the sample holder (m3), N– vertical force on rotating disc (N), g = 9.81 (m s-2),r – mass of a unit volume of paddy grain (kg m-3).
Finally, the coefficient of dynamic friction was obtained by using an average of 18 recorded data by data logger within 1.5 min and the following equation:
m= T
WQ . (9)
The experiments were accomplished in three replica-tions. Thus, by attention to the level of moisture (2 levels), the number of varieties (3 varieties), the number of levels of peripheral speed (3 levels) and the number of contact surfaces (3 surfaces), 162 experiments were performed. The obtained data were analyzed by split-split plot test based on complete randomized block. The mean effects were compa-red by using Duncan's Multiple Rang Test with (p<0.05). For analysing the variance of data, the MSTATC package was applied.
RESULTS AND DISCISSION
A summary of the results of the dynamic friction coeffi-cient (DFC) determination is displayed in Table 1. The re-sults showed that the main effects of moisture content, varie-ty, contact surface, velocity and also their interactions on
dynamic friction coefficient were significant (p<0.01). This was because of the various qualities of grains in various varieties and also of the different quality of the contact surfaces. Also with increase in moisture content of grains, because of increasing adhe- sion force, the dynamic friction coefficient was increased significantly.
The results of mean comparison of main effects on dy-namic friction coefficient are displayed in Table 2. The re-sults showed that with increase in moisture content of grains and surface velocity, the dynamic friction coefficient increased significantly. Among the contact surfaces, the highest (0.567) and lowest (0.314) of dynamic friction coefficient mean values belong to black and galvanized sheets, respectively. Also, among varieties, the maximum (0.441) and minimum (0.408) of dynamic friction coefficient mean values were deter- mined for Alikazemi and Khazar, respectively (p<0.05).
Source Degree of freedom Sum of squares Mean square F value
Replication
Moisture content (M) Error
Variety (V) (M. C. × V) Error
Contact Surface (C.S.) (M. C. × C. S.) (V× C. S.) (M. C. × V× C. S.) Surface Velocity (S.V.) (M. C. × S. V.) (V× S. V.) (M.C. × V. × S. V.) (C. S. × S. V.) (M.C. × C. S. × S. V.) (V × C. S. × S. V.) (M. C. × V. × C. S. × S. V.) Error
2 1 2 2 2 8 2 2 4 4 2 2 4 4 4 4 8 8 96
0.001 0.347 0.000 0.030 0.087 0.004 1.803 0.032 0.398 0.083 1.264 0.014 0.032 0.014 0.015 0.005 0.067 0.026 0.077
0.000 0.347 0.000 0.015 0.043 0.001 0.902 0.016 0.099 0.021 0.632 0.007 0.008 0.004 0.004 0.001 0.008 0.003 0.001
4.3038ns 3457.2749** 27.0293** 77.0541** 1118.6155** 19.9689** 123.3033** 25.6335** 748.1186** 7.8085** 9.8369** 4.4576** 4.6530** 1.6155ns 10.3723** 3.9883**
Total 161 4.300
**Significant at less than 1% probability level, ns – not significant. T a b l e 1.Results of variance analysis
Moisture content Variety Contact surface Surface velocity
23 (% w.b.) 0.472 a* Alikazemi 0.441 a Galvanized 0.314 c 0.5 cm s-1 0.315 c
12 (% w.b.) 0.380 b Hashemi 0.429 a Mild 0.396 b 3.5 cm s-1 0.431 b
Khazar 0.408 b Black 0.567 a 6.5 cm s-1 0. 531 a
*Different letters show significant differences at probability level of 5%.
The results of the mean comparison of the interaction effects of moisture content and contact surface (Fig. 2) show-ed that for all surfaces the dynamic friction coefficient in-creased significantly with increase in moisture content. This result was similar to the results obtained by Kappuswamy and Wratten (1970) and also Gupta and Das (1998). The obtained highest mean value (0.631) of the dynamic friction coefficient belonged to black sheet surface at a moisture content of 23% w.b.
The results of mean comparison of the interaction effects of moisture content and variety (Fig. 3) showed that in all varieties the dynamic friction coefficient was increa-sed significantly with increase in the moisture content. The highest mean value of the dynamic friction coefficient (0.508) among the varieties was obtained for the Hashemy variety at moisture content of 23% w.b.
The results of mean comparison of interaction effects of variety and contact surface (Fig. 4) showed that the lowest (0.236) and highest (0.637) mean values of dynamic friction coefficient were those of the Alikazemi variety on galvani-zed sheet and black sheet contact surface, respectively. And also, for the Hashemi and Khazar varieties there were no significant differences in the dynamic friction coefficient mean values on galvanized and mild surfaces.
The results of mean comparison of the interaction effects of moisture content and surface velocity on dynamic coefficient of friction are shown in Fig. 5. The results show-ed that with increasing velocity, at each two levels of grain moisture content, dynamic friction coefficient increased significantly. And also, the results showed that the highest mean value of dynamic friction coefficient (0.569) was ob-tained for surface velocity of 6.5 cm s-1at moisture content of 23% w.b.
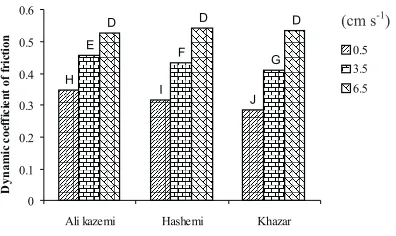
The results of mean comparison of interaction effects of variety and surface velocity on dynamic friction coefficient are shown in Fig. 6. The results showed that in all varieties the dynamic friction coefficient values increased signifi-cantly with increasing surface velocity. Among the varieties the highest mean value of the dynamic friction coefficient (0.542) belongs to Hashemi variety.
The results of mean comparison of interaction effects of contact surface and surface velocity (Fig. 7) showed that on all contact surfaces the dynamic friction coefficient increased significantly with increase in surface velocity. The highest value of the dynamic friction coefficient (0.661) was record-ed for the black sheet surface at surface velocity of 6.5 cm s-1.
a
c e
b
d
f
0 0.1 0.2 0.3 0.4 0.5 0.6 0.7
galvanized sheet Mild sheet Black sheet
cotact surface
D
y
n
a
m
ic
c
o
ef
fi
ci
e
n
t
o
f
fr
ic
ti
o
n
23% w.b. 12% w.b.
Fig. 2.Results of mean comparison of interaction effects of moistu-re content and contact surface. Explanations as in Table 2.
b
a
c c
e d
0 0.1 0.2 0.3 0.4 0.5 0.6
Ali kazemi Hashemi Khazar
Variety
D
y
n
am
ic
co
ef
fi
ci
en
t
o
f
fr
ic
ti
on
23% w.b.
12% w.b.
Fig. 3.Results of mean comparison of interaction effects of moistu-re content and variety on dynamic coefficient of friction. Expla-nations as in Table 2 and Fig. 1.
a
c
e
b
d
f
0 0.1 0.2 0.3 0.4 0.5 0.6
0.5 3.5 6.5
surface ve locity(cm/s)
D
y
n
a
m
ic
c
o
e
ff
ic
ie
n
t
o
f
fr
ic
ti
o
n
23% w.b. 12% w.b. 0
Fig. 5. Results of mean comparison of interaction effects of moisture content and surface velocity on dynamic coefficient of friction. Explanations as in Table 2 and Fig. 1.
e
f
e e
d
e
c a
b
0 0.1 0.2 0.3 0.4 0.5 0.6 0.7
Alikazemi Hashemi Khazar
variety
D
y
n
a
m
ic
co
ef
fi
ci
en
t
o
f
fr
ic
ti
o
n
galvanized sheet Mild sheet Black sheet
0
Fig. 4.Results of mean comparison of interaction effects of variety and contact surface on dynamic coefficient of friction. Explana-tions as in Table 2.
CONCLUSIONS
1. With increase in moisture content of paddy grain from 12 to 23% w.b., dynamic friction coefficient increased significantly from 0.380 to 0.472.
2. Among tested varieties, the lowest (0.408) and the highest (0.441) mean values of dynamic friction coefficient were obtained for the Khazar and Alikasemi varieties, respectively.
3. Among the tested contact surfaces, the lowest (0.314) and the highest (0.567) mean values of dynamic friction coefficient were recorded for the galvanized and black sheets, respectively.
4. With the peripheral speed of contact surfaces varying from 0.5 to 6.5 cm s-1, dynamic friction coefficient increased significantly from 0.315 to 0.531.
REFERENCES
Askari Asli-Ardeh E. and Abbaspour-Gilandeh Y., 2008.
Investigation of the effective factors on threshing loss, dama-ged grains percent and material other than grain to grain ratio on an auto head feed threshing unit. Am. J. Agric. Biol. Sci., 3(4), 699-705.
Bickert W.G. and Buelow F.H., 1966.Kinetic friction of grains on surfaces. Trans. ASAE, 9(1), 129-131.
Chakraverty A. and Singh R. P., 2002.Postharvest Technology: Cereals, Pulses, Fruits and Vegetables. Science Press, Enfield-New Hampshire-Plymouth, UK.
Chung J. and Verma R., 1998.Determination of friction coeffi-cient of beans and peanuts. Trans. ASAE, 32(30), 745-750.
Coskoner Y. and Karababa E., 2006.Physical properties of corian-der seed (Corianderum sativumL.). J. Food Eng., 80, 408-416. Ghasemi Varnamkhasti M., Mobli H., Jafari A., Keyhani A.R.,
Heidari Soltanabadi M., Rafiee S., and Khaeiralipour K., 2007.Some physical properties of rough rice (Oryza sativaL.) grain. J. Cereal Sci., 47(3), 496-501.
Gupta R.K. and Das S.K., 1998.Friction coefficient of sunflower seed and kernel on various structural surfaces. J. Agric. Eng. Res., 71, 175-180.
Joshi D.C., Das S.K., and Mukherjee R.K., 1993.Physical pro-perties of pumpkin seeds. J. Agric. Eng. Res., 54, 219-229. Kappuswamy M. and Wratten F.T., 1970.Static and dynamic coefficients of friction of rough rice on sheet steel. Proc. SW Regional Meeting of the ASAE, April 4-7, Hot Springs, AR, USA.
Kashaninejad M. and Rezaghah M., 2007.Effect of moisture content on some engineering properties of two varieties of safflower seed. Int. Agric. Eng. J., 16(3-4), 97-113.
Mohsenin N.N., 1980.Physical Properties of Plant and Animal Materials. Gordon and Breach Press, New York, USA. Molenda M.S., Thompson A., and Ross I.J., 2000.Friction of
wheat on corrugated and smooth galvanized steel surfaces. J. Agric. Eng. Res., 77(2), 209-219.
Reddy B.S. and Chakravertty A., 2004.Physical properties of raw and parboiled paddy. Biosys. Eng., 88(4), 461-466. Shepherd H. and Bhardwaj R.K., 1986. Moisture dependent
physical properties of pigeon pea. J. Agric. Eng. Res., 35, 227-234.
Sitkei G., 1986.Mechanics of Agricultural Materials. Elsevier Press, Amsterdam, the Netherlands.
SynderL.N., Roller W.L., and Hall G.E., 1967.Coefficients of kinematic friction of wheat on various metal surfaces. Trans. ASAE, 10(3), 411-419.
e
g
i
c
f
h
a
b d
0 0.1 0.2 0.3 0.4 0.5 0.6 0.7
galvanized sheet Mild sheet Black sheet
contact surface
D
y
n
a
m
c
c
o
e
ff
ic
ie
n
t
o
f
fr
ic
ti
o
n
0.5 cm/s 3.5 cm/s 6.5 cm/s
Fig. 7.Results of mean comparison of interaction effects of contact surface and surface velocity on dynamic coefficient of friction. Explanations as in Table 2 and Fig. 5.
H
I
J E
F G
D D D
0 0.1 0.2 0.3 0.4 0.5 0.6
Ali kazemi Hashemi Khazar
variety
D
y
n
a
m
ic
c
o
ef
fi
c
ie
n
t
o
f
fr
ic
ti
o
n
0.5 cm/s
3.5 cm/s
6.5 cm/s
Fig. 6.Results of mean comparison of interaction effects of variety and surface velocity on dynamic coefficient of friction. Expla-nations as in Table 2.