RESEARCH NOTE
A NEW ALGORITHM FOR VOICE ACTIVITY DETECTION
BASED ON WAVELET PACKETS
M.R. Karami Mollaei* and M. Eshaghi
Department of Electrical and Computer Engineering, Babol University of Technology P.O. Box 47135-484, Babol, Iran
[email protected] – [email protected]
*Corresponding Author
(Received: September 22, 2007 – Accepted in Revised Form: December 11, 2008)
Abstract Speech constitutes much of the communicated information; most other perceived audio signals do not carry nearly as much information. Indeed, much of the non-speech signals maybe classified as ‘noise’ in human communication. The process of separating conversational speech and noise is termed voice activity detection (VAD). This paper describes a new approach to VAD which is based on the Wavelet Packet Transform (WPT). Our algorithm utilizes the differences between spectral distribution of human speech (voice) and general noise. First, the algorithm performs wavelet transform on the signal resulting in its decomposition into subbands using coefficients of WPT, and then it detects the voice within the signal by comparing the subband energy of components between detail and approximation coefficients. Computer simulation results are given to illustrate the effectiveness of our new VAD algorithms.
Keywords Speech Processing; Voice Activity Detector; Wavelet Packet Transform (WPT)
ﻩﺪﻴﮑﭼ
ﺳ ﻴ ﻪﺑ ﺭﺎﺘﻔﮔ ﻝﺎﻨﮕ ﻟﺩ
ﻴ ﺎﺟ ﺕﺎﻋﻼﻃﺍ ﻝﺎﻘﺘﻧﺍ ﻞ ﻳ ﻭ ﻩﺎﮕ ﻳ ﻩﮋ ﺍ ﻱ ﺭﺩ ﺑﻴ ﺳ ﻦ ﻴ ﻝﺎﻨﮕ ﺎﻫ ﻱ ﻨﺷ ﻴ ﺭﺍﺪ ﻱ ﺩﺭﺍﺩ . ﺑﻴ ﺮﺘﺸ ﺳ ﻴ ﻝﺎﻨﮕ ﺎﻫ ﻱ ﺭﺎﺘﻔﮔ ﻱ ﻭﺎﺣ ﻱ ﺕﺎﻋﻼﻃﺍ ؛ﺪﻧﺍ ﺍﺮﺑﺎﻨﺑ ﻳ ﺯﺎﺳﺍﺪﺟ ﻦ ﻱ ﻳ ﺳ ﮏ ﻴ ﻮﻧ ﺯﺍ ﺭﺎﺘﻔﮔ ﻝﺎﻨﮕ ﻳ ﻤﻫﺍ ﺰ ﻴ ﺯ ﺖ ﻳ ﺩﺎ ﻱ ﺩﺭﺍﺩ . ﺭﺎﮑﺷﺁ ﺯﺎﺳ ﺭﺎﺘﻔﮔ ﺍﺮﺑ ﻱ ﺯﺎﺳﺍﺪﺟ ﻱ ﺳ ﻴ ﻝﺎﻨﮕ ﺭﺎﺘﻔﮔ ﻱ ﻮﻧ ﺯﺍ ﻳ ﺰ ﻣﺭﺎﮐ ﻪﺑ ﻲ ﺩﻭﺭ ﻔﻟﺆﻣﻭ ﺔ ﻠﺻﺍ ﻲ ﺳ ﻴ ﻢﺘﺴ ﺎﻫ ﻱ ﺵﺯﺍﺩﺮﭘ ﻘﻠﺗﺕﻮﺻ ﻲ ﻣ ﻲ ﺩﻮﺷ . ﺍﺭﺩ ﻳ ﺭﻮﮕﻟﺍ ﺶﻫﻭﮋﭘﻦ ﻳ ﺪﺟ ﻢﺘ ﻳﺪ ﻱ ﺎﻨﺒﻣﺮﺑ ﻱ ﺪﺒﺗ ﻳ ﻞ ﻪﺘﺴﺑ ﺍ ﻱ ﺕﻭﺎﻔﺗ ﻭ ﮏﺟﻮﻣ ﺎﻫ ﻱ ﻃ ﻴﻔ ﻲ ﺑﺩﻮﺟﻮﻣ ﻴ ﻦ ﺭﺎﺘﻔﮔ ﻮﻧ ﻭ ﻳﺰ ، ﺍﺮﺑ ﻱ ﺭﺎﮑﺷﺁ ﺯﺎﺳ ﺭﺎﺘﻔﮔ ﺖﺳﺍ ﻩﺪﺷﻪﺋﺍﺭﺍ
.
ﺭﺩ ﺳﺍﺪﺘﺑﺍ ﻴ ﺪﺒﺗ ﺎﺑﻝﺎﻨﮕ ﻳ ﻪﺘﺴﺑ ﻞ ﺍ ﻱ ﻪﺑ ﮏﺟﻮﻣ ﺯﻳ ﺎﻫﺪﻧﺎﺑﺮ ﻲﻳ ﺰﺠﺗ ﻳ ﻣﻪ ﻲ ﻘﻣﺎﺑﺲﭙﺳ،ﺩﻮﺷ ﺎﻳ ﺴ ﺔ ﮊﺮﻧﺍ ﻱ ﺳ ﻴ ﻠﺻﺍﻝﺎﻨﮕ ﻲ ﻪﻔﻟﺆﻣﺎﺑ ﺎﻫ ﻱ ﺋﺰﺟ ﻲ ، ﺺﺨﺸﻣﺭﺍﺩﺍﺪﺻﺖﻤﺴﻗ
ﻣ ﻲ ﺩﻮﺷ . ﺎﺘﻧ ﻳ ﺒﺷﺞ ﻴﻪ ﺯﺎﺳ ﻱ ﭙﻣﺎﮐ ﻴ ﺮﺗﻮ ﻱ ﻻﺎﺑﺖﻋﺮﺳﻭﺖﻗﺩ ﻱ
ﺍ ﻳ ﺭﻮﮕﻟﺍﻦ ﻳ ﺯﺎﺳﺍﺪﺟﺭﺩﻢﺘ ﻱ ﺖﻤﺴﻗ ﺎﻫ ﻱ ﺗﻮﺻ ﻲ ﻮﻧﺯﺍ ﻳﺰ ﺍﺭ ﻣﻥﺎﺸﻧ ﻲ ﺪﻫﺩ . 1. INTRODUCTION
Voice activity detection (VAD) which refers to the ability of distinguishing speech from noise is an integral part of a variety of speech communication systems. Speech coding, speech recognition, hands-free telephony, and echo cancellation are some examples of these systems. In the GSM-based communication system, a VAD scheme is used to reduce batty power consumption through discontinuous transmission when speech-pause is detected [1]. Moreover, a variable bit rate VAD algorithm maybe used in speech encoding systems
Additionally, Nemer, et al [6] designed a robust algorithm based on higher order statistics (HOS) in the residual domain of the linear prediction coding coefficients (LPC) and the International Telecommunication Union-Telecommunications Sector (ITU-T) designed G. 729B VAD [7], which consists of a set of metrics, including line spectral frequencies (LSF), low band energy, zero-crossing rate (ZCR), and full-band energy. A common parameter of all above mentioned approaches is based on averaging over windows of fixed length or is derived through analysis based on a uniform time-frequency resolution. For example, it is well known that speech signals contain many transient components and exhibit non-stationary properties. The classical Fourier Transform (FT) works well for wide sense stationary signals but fails in the case of non-stationary signals since it applies only a uniform-resolution analysis. Conversely, if the multi-resolution analysis (MRA) property of DWT [8,15,16] is employed, the classification of speech into voiced, unvoiced or transient components can be accomplished. Here we describe a new approach to VAD which is based on the Wavelet Packet Transform (WPT). The algorithm performs wavelet transform to the signal and decomposes it into sub bands using coefficients feature of WPT, then it detects the voice in the signal by comparing the sub band energy of components between detail and approximation coefficients.
This paper is organized as follows. Section 2 describes WPT. The proposed algorithm based on WPT is discussed in Section 3. Section 4 evaluates the performance of the proposed algorithm. Section 5 presents conclusions.
2. DISCRETE WAVELET TRANSFORM
Wavelet transform (WT) is based on time-frequency signal analysis. It adopts a windowing technique with variable-sized regions. It allows the use of long time intervals when more precise low-frequency information is desired and shorter regions where the high-frequency information is important. It is well known that speech signals contain many transient components and exhibit non-stationary properties. [1,2,5]. When we make use of the MRA property of the WT, high levels
of time-resolution in the high frequency range is needed to detect signals’ rapid changing transient components. Conversely, a better frequency resolution is needed in the low frequency range to track slowly varying formants more precisely. Through MRA analysis, the classification of speech into voiced, unvoiced or transient components can be accomplished. An efficient way to implement this DWT using filter banks was developed in 1988 by Mallat [9]. In Mallat’s algorithm, the j-level approximations Aj and details Dj of the input signal are determined by using quadrature mirror filters (QMF). Figure 1 shows that the decomposed sub band signals A and D are the approximation and detailed parts of the input speech signal obtained by using a high-pass filter and a low-pass filter, implemented with the Daubechies family wavelet, where the symbol ↓2 denotes a down sampling operator of 2. In fact, a voiced or vowel speech sound has more energy than an unvoiced sound in a noise signal. Thus, the energy of a sub band signal can be exploited to accurately extract speech activity as described next.
The energy of the speech signals is concentrated in low frequency bands for the most part. Therefore, we may allow high resolutions for the low frequency bands to enhance the energy property by decomposing only low bands in each level. Figure 2 presents the structure of three -level wavelet decomposition. Through DWT, we can divide the speech signal into four non-uniform sub bands. The wavelet decomposition structure is then used to obtain the most energy in each sub band domain [10,11,15,17].
2.1. Wavelet Packet Analysis
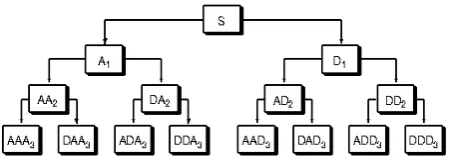
The waveletpacket method is a generalization of wavelet decomposition that offers a richer range of possibilities for signal analysis. In wavelet analysis, a signal is split into an approximation and a detail. The approximation is then itself split into a second-level approximation and detail, and the process is repeated. For n-level decomposition, there are n+1 possible ways to decompose or encode the signal, Figure 3.
For instance, wavelet packet analysis allows the signal S to be represented as A1 + AAD3 + DAD3
+ DD2. This is an example of a representation that is not possible with ordinary wavelet analysis.
3. THE PROPOSED ALGORITHM BASED ON WPT
Assume that s(n) is a clear speech and w(n) is the additive noise. The speech with noise can be written as
) n ( w ) n ( s ) n (
y = + (1)
Taking discrete wavelet packet transform on both sides of Equation 1, we have:
) n ( w A ) n ( s A ) n ( y
A = + (2)
) n ( W D ) n ( s D ) n ( y
D = + (3)
Where Ay(n), As(n) and Aw(n) denote approximation components of noisy speech, clear speech and noise respectively. Dy(n), Ds(n) and
) n (
Dw are the detail components of noisy speech, clear speech and noise.
Approximations are the high-scale, low-frequency components of a signal while details represent the low-scale, high-frequency components. For many signals, the low-frequency contents are the most important part. The high-frequency content, on the other hand, imparts flavor or nuance. As an example we may consider the human voice; the quality of voice changes markedly if the high-frequency components are removed. Nevertheless, the speech remains intelligible. However, removing enough of the low-frequency components turns the speech into gibberish. As a result WT of speech results in small detail coefficients (D) mainly consisting of high-frequency noise, while the approximation coefficients (A) contain much less noise than the original signal [14].
In general, the energy distribution of speech and noise are not the same. In fact, approximation components of voiced or vowel segments have more energy than detail components. Conversely, in a noisy frame, the energy distribution of detail components is more than approximation components. Figure 1. Discrete wavelets transform (DWT) using filter
banks.
Figure 2. Structure of three-level wavelet decomposition.
Figure 3. Structure of three-level wavelet decomposition.
But, in an unvoice frame, the energy distribution of approximation and detail components are the same. So we can introduce the suivants equations.
i 2 M 1 n ) n ( j y D M 1 i 2 M 1 n ) n ( j y A M 1 ∑ = ⎥⎦ ⎤ ⎢⎣ ⎡ >>> ∑ = ⎥⎦ ⎤ ⎢⎣
⎡ (4)
i 2 M 1 n ) n ( j y D M 1 i 2 M 1 n ) n ( j y A M 1 ∑ = ⎥⎦ ⎤ ⎢⎣ ⎡ <<< ∑ = ⎥⎦ ⎤ ⎢⎣
⎡ (5)
i 2 M 1 n ) n ( j y D M 1 i 2 M 1 n ) n ( j y A M 1 ∑ = ⎥⎦ ⎤ ⎢⎣ ⎡ ≈ ∑ = ⎥⎦ ⎤ ⎢⎣
⎡ (6)
Where M denotes the frame length of speech, j denotes the level of wavelet transform, i denote the frame index.
As presented in Figure 5, after the incoming raw speech signal X(t) from a microphone or other source was divided into many time frames, the DWT was firstly applied to separate the sub bands Y(n), in the current frame. The parameter ‘j’ represents the index of the sub-bands. At later stage, accounted of the mean energy of approximation and detail component values in current frame and at final after the thresholding stage take VAD output.
3.1. Thresholding
In order to accurately determine the boundary of voice activity, VAD decision is usually made through thresholding.This threshold is adopted to determine whether or not the speech signal is active. VAD decision process determines the threshold by using the mean energy of approximation and detail component values. We compute the thresholds for speech and
noise signals as follows.
) M 1 n i 2 ) n ( j y A M 1 ( i mean A m ∑ = ⎥⎦ ⎤ ⎢⎣ ⎡
= (7)
) M 1 n i 2 ) n ( j y D M 1 ( i mean D m ∑ = ⎥⎦ ⎤ ⎢⎣ ⎡
= (8)
as described above.
The VAD decision rule is defined as follows:
voice out VAD ) D m A m ( i 2 M 1 n ) n ( j y D i 2 M 1 n ) n ( j y A If = ⇒ + > ∑ = ⎥⎦ ⎤ ⎢⎣ ⎡ − ∑ = ⎥⎦ ⎤ ⎢⎣ ⎡ unvoice out VAD ) D m A m ( i 2 M 1
n (n)
j y D i 2 M 1
n (n)
j y A D m 0001 . 0 if Else = ⇒ + < ∑ = ⎥⎦ ⎤ ⎢⎣ ⎡ − ∑ = ⎥⎦ ⎤ ⎢⎣ ⎡ < ⎟ ⎠ ⎞ ⎜ ⎝ ⎛ × − noise out VAD ) D m 0001 . 0 ( i 2 M 1 n ) n ( j y D i 2 M 1 n ) n ( j y A Else = ⇒ × − < ∑ = ⎥⎦ ⎤ ⎢⎣ ⎡ − ∑ = ⎥⎦ ⎤ ⎢⎣ ⎡
Unvoiced frames occur before or after voiced or vowel segments, so in detecting unvoiced segments above we consider this matter.
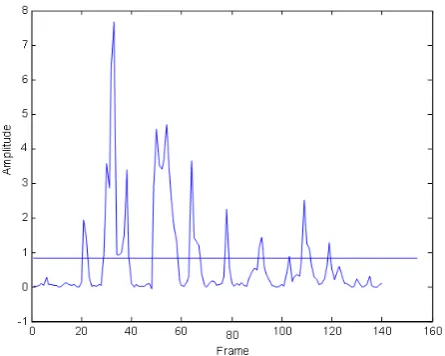
Figure 6 displays the VAD decision, based on threshold strategy. It is clearly seen that the boundary of voice activity has been extracted accurately.
4. SIMULATION RESULTS
control signal-to-noise ratio (SNR). We fluctuated the level of background noise and set the SNR value to 0 dB.
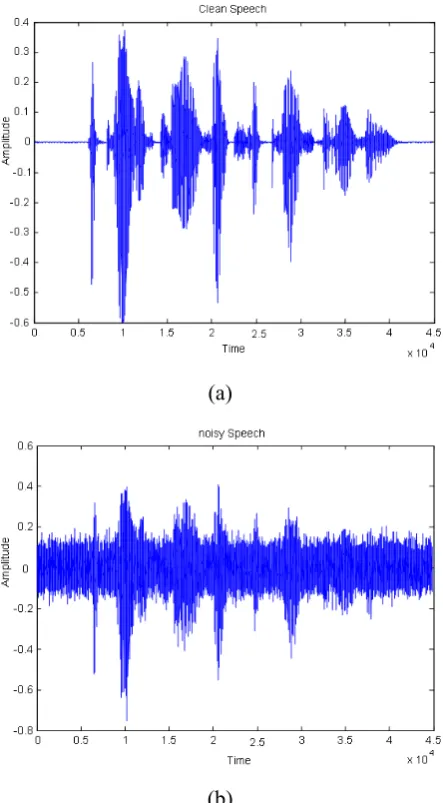
Figure 7 presents clear speech and speech mixed with white noise signals. The speech and noise signals are mixed with an SNR of 0 dB. Figure 8 plots the frequency responses of the clear signal. There, the unvoiced sounds occur before and after the voiced sounds. A comparison of Figure 9 with Figure 7b illustrates that the unvoiced parts are unclear. Figure 10 displays the thresholding strategy for extracting the boundary of voice. The horizontal line in Figure 9 plots the threshold for VAD. Figure 10 shows the VAD result of the proposed algorithm, if the VADout = 2 the output is
voiced, VADout = 1 the output is unvoiced, otherwise
the output is noise. Figures 11-14 display the results of a different test pattern. Figure 11a presents the raw signal which is the same as Figure 7a. The noise signal in Figure 11b is mixed with the raw signal. As for the first test pattern, the unvoiced parts in Figure 11b which corresponds to the mixed signal are not apparent. Figure 14 shows the VAD result of the proposed algorithm. If the VADout = 2 output is voiced, VADout = 1 the output
is unvoiced, otherwise the output is noise.
All tests were performed on PCs with Intel Pentium(R) 2.8GHz using MATLAB (Mathworks, MA). The architecture of the testing program was written as a real-time structure.
Table 1 compares the performance of the proposed wavelet-based VAD, the wavelet-based VAD proposed by Chen, et al [15], and the ITU standard G.729B [7] under three specific SNR values: 30, 10, and-5dB. From this table, it can be seen that in term of the average correct speech detection probability, the proposed wavelet-based VAD is superior to Chen’s VAD algorithm and G.729B VAD.
The test platform was an Intel Pentium(R) 2.8G with Matlab. The architecture of the testing program was written as a real-time structure.
5. CONCLUSION
Original means proposed method, is comparing energy of the detail and approximate component. In the more before methods, because the unvoiced
Figure 6. Thresholding strategy for extracting the boundary of
voice activity detection.
(a)
(b)
Figure 7. The raw signal of speech and the mixing noise (a)
Time
F
re
que
nc
y
spectrogram cleanSpeech
0.5 1 1.5 2
x 104
0 0.05 0.1 0.15 0.2 0.25 0.3 0.35 0.4 0.45 0.5
-100 -80 -60 -40 -20 0
Figure 8. Frequency response of clear speech.
0 20 40 60 80
Frame
100 120 140 160 -1
0 1 2 3 4
Am
pli
tu
de
6 7 8 9
5
Figure 9. The threshold for VAD.
Figure 10. The VAD result of the proposed algorithm.
(a)
(b)
Figure 11. The raw signal of speech and the mixing noise (a)
The clear speech and (b) The noisy speech.
Time
F
req
uenc
y
spectrogram cleanSpeech
0.5 1 1.5 2 2.5 3 3.5 4
x 104
0 0.05 0.1 0.15 0.2 0.25 0.3 0.35 0.4 0.45 0.5
-140 -120 -100 -80 -60 -40 -20 0
is similar the noise, the unvoiced part distinguish noisy part or the noisy part recognize unvoiced part, but this method don’t happened because more accuracy thresholding separate the noisy and unvoiced part.
Therefore, the VAD information can use in the other speech processing systems. This method is useful. Because it has few account, simple algorithm in little time, we can take the most careful that it use of in usages. Furthermore, the computer simulation results show that our proposed wavelet-based VAD algorithm is effective in the situation with low SNR. Due to the low calculation cost of the algorithm, it is suitable for real-time processing.
6. REFERENCES
1. Freeman, D.K., Cosier, G., Southcott, C.B. and Boyd, I., “The Voice Activity Detector for the Pan European Digital Cellular Mobile Telephone Service”, International Conference on Acoustics, Speech, and Signal Processing,
(1989), 369-372.
2. Kondoz, A.M., “Digital Speech Coding for Low Bit
Rate Communications Systems”, John Wiley and Sons Ltd., New York, U.S.A., (1994).
3. Sohn, J. and Sung, W., “A Voice Activity Detector Employing Soft Decision Based Noise Spectrum Adaptation”, International Conference on Acoustics, Speech, and Signal Processing, (1998), 365-368. 4. Cho, Y.D. and Kondoz, A., “Analysis and Improvement
of a Statistical Model-Based Voice Activity Detector”,
IEEE Signal Processing Letters, Vol. 8, No. 10,
(2001), 276-278.
5. Beritelli, F., Casale, S. and Cavallaro, A., “A Robust Voice Activity Detector for Wireless Communications using Soft Computing”, IEEE Journal on Selected Areas in Communications, Vol. 16, No. 9, (1998),
1818-1829.
6. Nemer, E., Goubran, R. and Mahmoud, S., “Robust
Voice Activity Detection using Higher-Order Statistics in the LPC Residual Domain”, IEEE Transactions on Speech and Audio Processing, Vol. 9 No. 3, (2001),
217-231.
7. Benyassine, A., Shlomot, E., Su, H.Y., Massaloux, D., Lamblin, C. and Petit, J.P., “ITU-T Recommendation G.729 Annex B: A Silence Compression Scheme for use with G.729 Optimized for V.70 Digital Simultaneous Voice and Data Applications”, IEEE Communications Magazine, Vol. 35 No 9, (1997), 64-73.
8. Strang, G., and Nquyen T., “Wavelet and Filter Banks”, Wellesley-Cambridge Press, U.K., (1996).
9. Mallat, S., “A Theory for Multiresolution Signal Decomposition: The Wavelet Representation”, IEEE Transactions on Pattern Analysis and Machine Intelligence, Vol. 11, No. 7, (1989), 674-693.
Figure 13. Threshold for VAD.
Figure 14. The VAD result of the proposed algorithm.
TABLE 1. Performance of the Proposed Wavelet-Based Approach, Chen’s Wavelet-Based Approach and G.729B VAD.
SNR=-5 SNR=10
SNR=30
CS CS
CS VAD
93 % 99 %
99.5 % Proposed
VAD
92.9 % 98.1 %
97.2 % Chen’s
VAD
60.5 % 86.3 %
98.4 % G.729B
10. Strang, G. and Nguyen, T., “Wavelets and Filter Banks, Wellesley-Cambridge Press”, Hardcover, U.K., (October 1996).
11. Cohen, A., Daubechies, I., Jawerth, B. and Vial, P., “Multiresolution Analysis, Wavelets and fast Wavelet Transform on an Interval”, CRAS Paris, Vol. 316,
(1993), 417-421.
12. Coifman, R.R. and Wickerhauser, M.V., “Entropy-Based Algorithms for Best Basis Selection”, IEEE Trans. on Inf. Theory, Vol. 38, No. 2, (1992), 713-718.
13. Wickerhauser, M.V., “INRIA Lectures on Wavelet Packet Algorithms”, Proceedings Ondelettes ET Paquets D'ondes, Rocquencourt France, (17-21 June, 1991), 31-99.
14. Shaujan, J., Haitao, G. and Fuliang, Y., “A New Algorithm for Voice Activity Detection Based on
Wavelet Transform”, Intelligent Multimedia, Video and Speech Processing, (2004), 222-225.
15. Fei, B. and Wang, K.C., “Voice Activity Detection Based on Auto-Correlation Function using Wavelet Transform and Teager Energy Operator”, Computational Linguistics and Chinese Language Processing, Vol.
11, No. 1, (2006), 87-100.
16. Moshiri, B., Eslambolch, P. and HoseinNezhad, R., “Fuzzy Clustering Approach using Data Fusion Theory and its Application to Automatic Isolated Word Recognition”,
International Journal of Engineering, Transactions B:
Applications, Vol. 16, No. 4, (December 2003), 329-336. 17. Alipour, F. and Patel, V.C., “Steady Flow through
Modeled Glottal Constriction”, International Journal