R E S E A R C H
Open Access
Predicting effects of blood flow rate and size of
vessels in a vasculature on hyperthermia
treatments using computer simulation
Huang-Wen Huang
1*, Tzu-Ching Shih
2, Chihng-Tsung Liauh
3* Correspondence: hhw402@mail. tku.edu.tw
1Department of Innovative Information and Technology, Software Engineering Group, Langyang Campus, Tamkang University, I-lan County 26247, Taiwan
Abstract
Background:Pennes Bio Heat Transfer Equation (PBHTE) has been widely used to
approximate the overall temperature distribution in tissue using a perfusion parameter term in the equation during hyperthermia treatment. In the similar modeling, effective thermal conductivity (Keff) model uses thermal conductivity as a
parameter to predict temperatures. However the equations do not describe the thermal contribution of blood vessels. A countercurrent vascular network model which represents a more fundamental approach to modeling temperatures in tissue than do the generally used approximate equations such as the Pennes BHTE or effective thermal conductivity equations was presented in 1996. This type of model is capable of calculating the blood temperature in vessels and describing a vasculature in the tissue regions.
Methods:In this paper, a countercurrent blood vessel network (CBVN) model for calculating tissue temperatures has been developed for studying hyperthermia cancer treatment. We use a systematic approach to reveal the impact of a vasculature of blood vessels against a single vessel which most studies have presented. A vasculature illustrates branching vessels at the periphery of the tumor volume. The general trends present in this vascular model are similar to those shown for physiological systems in Green and Whitmore. The 3-D temperature distributions are obtained by solving the conduction equation in the tissue and the convective energy equation with specified Nusselt number in the vessels.
Results:This paper investigates effects of size of blood vessels in the CBVN model on total absorbed power in the treated region and blood flow rates (or perfusion rate) in the CBVN on temperature distributions during hyperthermia cancer treatment. Also, the same optimized power distribution during hyperthermia treatment is used to illustrate the differences between PBHTE and CBVN models. Keff
(effective thermal conductivity model) delivers the same difference as compared to the CBVN model. The optimization used here is adjusting power based on the local temperature in the treated region in an attempt to reach the ideal therapeutic temperature of 43°C. The scheme can be used (or adapted) in a non-invasive power supply application such as high-intensity focused ultrasound (HIFU). Results show that, for low perfusion rates in CBVN model vessels, impacts on tissue temperature becomes insignificant. Uniform temperature in the treated region is obtained. Conclusion:Therefore, any method that could decrease or prevent blood flow rates into the tumorous region is recommended as a pre-process to hyperthermia cancer treatment. Second, the size of vessels in vasculatures does not significantly affect on
total power consumption during hyperthermia therapy when the total blood flow rate is constant. It is about 0.8% decreasing in total optimized absorbed power in the heated region as g(the ratio of diameters of successive vessel generations) increases from 0.6 to 0.7, or from 0.7 to 0.8, or from 0.8 to 0.9. Last, in hyperthermia
treatments, when the heated region consists of thermally significant vessels, much of absorbed power is required to heat the region and (provided that finer spatial power deposition exists) to heat vessels which could lead to higher blood temperatures than tissue temperatures when modeled them using PBHTE.
Background
Hyperthermia is used to raise tissue temperatures in a range of 40-43°C for a long per-iod of time to kill tumorous cells. Within the past 20 years, it has gained much of attention for combining direct thermal toxicity and enhancements of the efficacy of some drugs [1-3]. The application of hyperthermia has been integrated in multimodal treatment strategies in several forms of tumors. Experimental and clinical evidence has indicated that the combination of cytotoxic drugs with localized hyperthermia in the cancer treatment increases the killing of tumor cells [4]. As well as other treatment modalities, they also showed an increasing efficiency in treatments [5].
The Pennes [6] bio-heat transfer equation (PBHTE) has been a standard model for predicting temperature distributions in living tissues for more than half a century now. The equation was established through conducting a sequence of experiments of tem-perature measurements of tissue and arterial blood temtem-peratures in the resting human forearm. The equation includes a special term that describes the heat exchange between blood flow and solid tissues. The blood temperature is assumed to be con-stant arterial blood temperature. Some researchers [7-11] also developed alternative equations having the same goal, attempting to formulate a single, general field equation that could predict the overall characteristics of temperature distributions in tissues. For example, Keffmodel (effective thermal conductivity model) [9,11] is a field equation
using thermal conductivity as a key parameter to replace blood perfusion term in PBHTE. However, this has been challenged by many research groups internationally when trying to predict temperature distribution in regions which involve isolated large vessels.
on the positions of the large vessels in an individual hyperthermia patient will be rewarded with a more accurate prediction of the temperature distribution. Finally, a few studies have modeled the effect of collections of a large number of parallel vessels or of networks of vessels [23-26].
The present paper describes effects of, blood flow rates and size of vessels in a vascu-lature, on 3-D temperature distributions and absorbed power distributions using a model [24] comprising a network of blood vessels applied with an optimization to reach the ideal therapeutic temperature distribution of uniform 43°C during hyperther-mia cancer treatment. This paper uses a rather simple, generic vessel network model in order to develop and illustrate the basic approach of the thermal model, and to illustrate the types of applications possible for such a model.
Methods
Vessel Network Geometry and Fully Conjugated Blood VesselNetwork Model
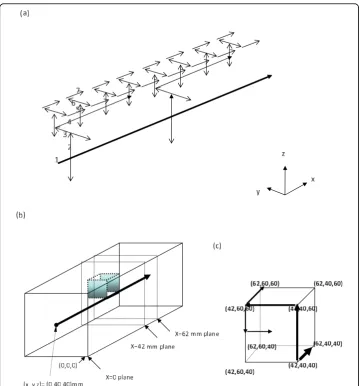
The geometry used consists of a regular, branching vessel network, as partially shown in (only schematic of the partial arterial vessel network) Figure 1(a), that is embedded in a control volume which is an (approximate) cube of dimensions L= 82 mm and W=H= 80 mm in thex, y, andzdirections, respectively. All seven vessel levels (level 1 to level 7) are shown. The venous network is parallel to the arterial network. All ves-sels are straight-line segments parallel to one of the three Cartesian axes. There are up to seven levels of arteries, beginning with the main artery (level one) which lies along the central, lengthwise (x) axis of the cube. Table one of [24] listed the basic vessel network properties used in these studies. The diameters of the arteries decrease by a constant ratio gbetween successive levels of branched vessels (the ratio of diameters of successive vessel generations) i.e.
= D Di
i+1 (1)
whereDiandDi+1are the diameters of two successive levels of branching arteries.
(62,60,60)), the level 5 vessel segment (from (42,60,60) to (42,60,50)) and the level 6 vessel segment (from (42,60,50) to (42,50,50)). The locations (42, 60, 50) and (42, 50, 50) are not corners of the heated tumor volume and they are not shown in Figure 1(c). The level 1 vessel branching point at (42, 40, 40) and all its subsequent branching ves-sels to lower level vesves-sels present identical pattern for the branching point at (2, 40, 40) and all its subsequent branching vessels to lower level vessels. In other words, the tumor cell resides on the location ranging from (42 to 62, 40 to 60, 40 to 60) of (x, y, z) coordinates and all other vessels (arterial part) around the cell are highlighted in Figure 1(a).
Figure 1(a) Schematic of the partial arterial vessel network. All seven vessel levels (level 1 to level 7) are shown. The venous network is parallel to the arterial network. (b) A transparent view of a
The geometric arrangement of the counter current veins is essentially identical to that of the arteries, with all of the veins offset from the arteries by one finite difference node in x, y, and z as appropriate to avoid intersections of vessels. Each of terminal arteries is assumed to supply all of the blood to a defined subvolume of tissue and tumor regions which subvolume was defined according to Figure 2(a) of Huang et al [24].
To better comprehend the results of temperature and optimized power fields with complicated branching artery and vein vessels, five detailed vasculature cross-section planes are shown in Figures 2(a)-2(c) to illustrate countercurrent artery-vein vessels pathways and locations. Figure 2(a) shows arterial branching vessels at the x = 42 mm cross-section plane. Red dash-dot square lines indicate the heated region, and Figure 2 (b) shows arterial branching vessels at the x = 52 mm and 62 mm cross-section planes. Figure 2(c) shows branching countercurrent artery-vein pair vessels running in the x direction at the x = 38 mm and 66 mm cross-section planes which are not in the heated region.
CBVN is a fully conjugated blood vessel network model formulation which describes the solid tissue matrix having thermally significant vessel generations (seven levels). The effects of all vessels smaller than the terminal (level seven) vessels are not expli-citly modeled in CBVN. Thus, those smaller vessels (connected to the terminal arteries and the terminal veins in the network) are implicitly assumed to be thermally insignifi-cant in the CBVN. Details of the model were described in Huang et al [24].
Mathematical equations for the thermal model
The governing equations for both tissues and vessels are described below, the PBHTE for calculating tissue temperatures is:.
∇ ∇(k T x y z( , , ))−w c T x y zb b( ( , , )−Ta)+qs =0 (2)
where k, cb, wb, andqsare thermal conductivity of soft tissue, specific heat of blood, blood perfusion rate and absorbed thermal power density, respectively. The metabo-lism effect is neglected in Eqn. (2) due to its limited effect on temperature distribution during hyperthermia. The convective energy equation is solved for blood temperatures of vessels in the CBVN model. That is:.
m c dTb x y z
dsi Nu k T x y z T x y z q R
b i b, b w b s bv i,
( , , )
( ( , , ) ( , , ))
= ⋅ − + 2
(3)
wheremb, i is the blood mass flow rate at the level i vessel segment and siis a coor-dinate along the axis of the level i vessel segment.Nu, kb,Rbv, i and Tw are Nusselt number, thermal conductivity in blood, radius of blood vessel at level i and blood ves-sel wall temperature, respectively. A total of 682 vesves-sels in the model need to be calcu-lated using Eqn. (3). Special treatments of perfusion and collecting blood (to and from subvolumes) on terminal ends (arteries and veins) are added to Eqn. (3) for level 7 ves-sel calculations. In all cases studied in the present paper, the true tissue perfusion (P ) was assumed to be uniform everywhere, i.e., P P
tsv i
Additionally, a simple Keffmodel is described in Eqn. (4). That is,
∇(Keff∇ +T) qs =0 (4)
where Keffis an effective conductivity tenor, T is temperature field and qsis absorbed
thermal power.
Optimization scheme
The procedure to continuously adjust power deposition in hyperthermia cancer treat-ment in order to reach ideal temperature (uniform temperature of 43°C throughout the volume of the tumorous region) is described below.
1. Set initial power field equal to 105W/m3 uniform in the treated region.
2. Solve governing equations in tissue and blood temperature distributions with given boundary conditions and inlet temperatures of vessels, which are all set to be 37°C.
3. Compare predicted temperature field with ideal temperature field (which is uni-form temperature throughout the tumor volume) and calculate criteria value expressed below in Eqn. (5).
4. If criterion value does not meet the condition described in Eqn. (5), power is updated according local temperature as it is described below in Eqn. (6). Go to step 2 and continue the loop.
5. If the criterion meets the condition, the optimal power and temperature distribu-tions are obtained.
The criterion of power deposition theoretically is described in Eq. (5), which states that the root mean square of difference of ideal temperature (which is set to be 43°C) and calculated temperature in treated region of all heated target nodes divided by (43-37)°C reaches less than the criterion value (is set to be 10% of the temperature differ-ence of (43-37)°C). If the criterion is met, we have obtained the optimization of absorbed power such that the estimated temperature distribution is close to the ideal temperature distribution. Otherwise, power deposition will be adjusted according to local temperature, i.e. it is a function of position and temperature. The readjusted power deposition (Pn+ 1) is described in Eqn. (6). Its unit is the same asqswhich are used in Eqns. (2), (3) and (4).
( )
( )
.
Δ ∑
− ° ≤
T
C
2
43 37
0 1
all target nodes
Total number of target nodes (5)
Pn+1( , , )x y z =P x y zn( , , )+ Δp x y z( , , ) (6)
where Δp(x,y,z) = Coef ·ΔT(x,y, z),Coefis 10000, n is the iteration number and
reach ideal temperature distribution. In other words, much more time is required to process the optimization. If the power deposited on a site that causes temperature in tissue raised over 43°C, the power will readjust its power deposition to a smaller one in the scheme for an ideal temperature distribution.
Numerical Methods
The numerical scheme used to calculate the temperatures was a black and red finite dif-ference SOR method [27], with upwind differencing used for the vessels. The numerical details are described by Chen [28] and Huang [14]. Special algorithms were used to account for the vessel corners where arteries and veins change direction, and where two or more arteries divide, or two or more veins join. The thermal resistances around the circular vessels were calculated using the logarithmic resistance approach as described by Chen and Roemer [29]. The property values used in treated tumorous and non-trea-ted normal tissues werekt= 0.5W/m3/°C, c =cb= 4000J/kg/°Candr= 1000 kg/m3. The vessel heat transfer coefficient (h) was calculated using a constant Nusselt number of four (4) for all vessel levels. In all cases, a finite difference nodal spacing of 2 mm was used. Test results with a nodal spacing of 1 mm for test cases using either the arterial vessel network (when no veins are present) or the counter current vessel network showed no significant differences with the results of the comparable 2-mm nodal spacing models. This 2-mm spacing gives an inter-vessel centerline-to-centerline diagonal spa-cing of 2.8 mm for the counter current vessels due to the 2-mm offsets inx,y, andz. The blood temperature in vessels was calculated using a steady uniform velocity profile for blood flow that has been used widely and accepted in many investigations. Recently Horng et al [30] reconfirmed it. The boundary condition for temperature in the control volume is 37°C for all surfaces of the parallelepiped. So are the inlet temperatures for level 1 artery and vein.
Results
Testing of this vascular network model has been done by several means [14] including: a check of the single-vessel numerical results (all vessels removed except the level one artery) against an analytical solution; a verification that all temperatures vary linearly with the applied power; and a check that for all results presented in this paper that the overall energy balance on the control volume was accurate to within 0.1 percent. Fig-ure 3 of [24] shows the vessel diameters, total surface areas, and velocity distributions (for P = 0.5) as a function of the vessel level. The general trends present in that figure are similar to those shown for physiological systems in Green [31] and Whitmore [32].
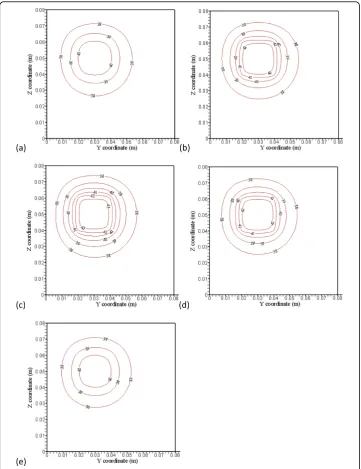
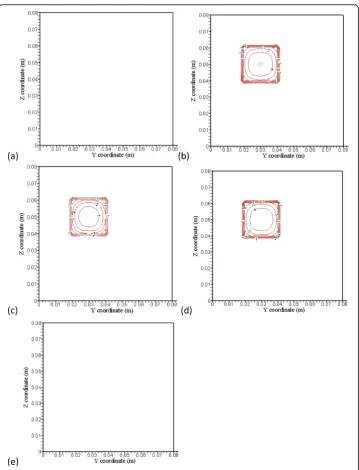
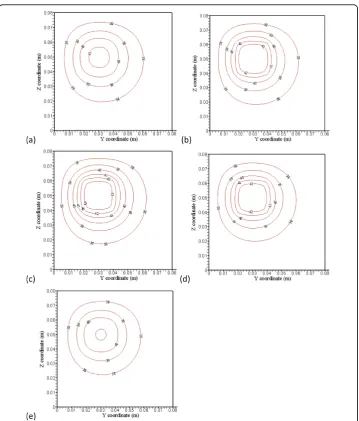
at this plane. The ideal temperature is set to be 43°C. Figures 4(a) and 4(e) indicate no power absorbed at the two planes.
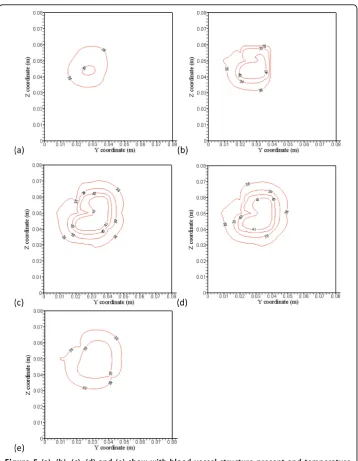
Figures 5(a), (b), (c), (d) and 5(e) show temperature predictions using CBVN. That is, with blood vessels structure present and temperature distributions at the x= 38 mm (4 mm away from the front boundary), x= 42 mm (the front boundary),x = 52 mm (middle of the treated region),x= 62 mm (the back boundary), andx= 66 mm (4 mm away from the back boundary) planes, respectively, with perfusion rate of 0.5 kg· m-3s-1 and applied identical absorbed power shown in Figures 4(a), (b), (c), (d) and 4(e). To Figure 5 (a), (b), (c), (d) and (e) show with blood vessel structure present and temperature distributions at the x = 38 mm (4 mm away from the front boundary), x = 42 mm (the front
illustrate the discrepancy of the three models (PBHTE, CBVN and Keff), the
tempera-ture prediction at those identical locations using a simple Keff model with optimized absorbed power (similar to those graphs shown in Figures 4(a), (b), (c), (d) and 4(e)) are shown in Figures 6(a), (b), (c), (d) and 6(e). In present study, a simple scalar Keff
(effective conductivity model) is used. The value of effective conductivity is 0.5 W/m3/°C which is the same as thermal conductivity of tissue (Keff/Kt= 1), and it also is the same as thermal conductivity of blood.
of mass flow rate by vessels at the periphery of the tumor volume present vital charac-teristics in the model. These are consistent with many clinical and experimental phe-nomena. Unsuccessful hyperthermia treatments lead to survival of cancerous tissues. Insufficient net absorbed thermal energy in localized tissue area is one of the major problems. Figures 6(a), (b), (c), (d) and 6(e) display similar temperature distributions of PBHTE using Keffmodel approach which shows a uniform and smooth temperature
field.
Figure 7(a) shows more than double the power is needed for the CBVN model as compared to PBHTE model for the total power absorption in treated tumor region after optimization. PBHTE is the case with no blood vessels present. Both cases have the same blood perfusion rate, however CBVN presents a vasculature that carries blood flow from a main vessel (level 1) into branching vessels and, at the terminal ends, perfused blood to tissues. Therefore, a blood flow rate of about 320 mm/sec in level 1 artery and vein vessels enables the blood to perfuse into tissues with a rate of 0.5 kg· m-3s-1. The perfusion rate of 0.5 kg· m-3s-1 in tissues is a perfusion term para-meter which is used for PBHTE. Figure 7(b) shows the comparison of optimal tem-peratures along level 5 and level 6 vessel segments at middle plane of the heated region (arterial route: from 0 to 0.02 m; veinous route: from 0.02 to 0) in case of CBVN model (level5-6a represents arterial path consists of level 5 and level 6 vessels; level5-6v represents veinous path consists of level 5 and level 6 vessels) and those tem-peratures in case of PBHTE model (level5-6a PBHTE represents those arterial path locations which are calculated via PBHTE instead of CBVN; level5-6v PBHTE repre-sents those veinous path locations which are calculated via PBHTE instead of CBVN). Figure 9Total optimized absorbed power in the heated region versus the ratio of diameters of successive vessel generations (g) in the vasculature, when the region’s perfusion rate
Figure 7(c) shows lengthwise axis (indicated by a dash line) from the intersection of level 3-4-5 vessels to the level 6-7 intersection at the middle plane of heated region shown in Figure 2(a).
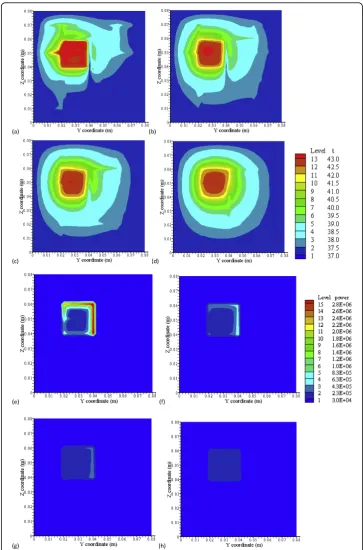
Figure 8 shows (a), (b), (c) and (d), the temperature distributions by CBVN at x = 42 mm, the front boundary plane (Figure 2(a)), for low perfusion rates of 0.5, 0.1, 0.05 and 0.01 kg· m-3s-1, respectively. Figures 8(e), (f), (g) and 8(h) are their optimized absorbed power distributions, respectively. Higher magnitudes of absorbed power are located on or near vessels. As perfusion decreases, magnitude of optimized power on vessels decreases. Figure 8(h) shows very small and uniform power distribution in the heated region as perfusion reaches 0.01 kg· m-3s-1. As shown in Figures 8(f) and 8(g), an increase of perfusion rate in the heated region makes level 2 vessels significant, because vessels gain higher blood speeds and require more power to heat the fluid. On the other hand, strong temperature perturbation caused by vessels’ convection effect has significantly dampened as blood perfusion decreases. In Figure 8, the legend from low to high levels, the temperature (°C) 13-level set is 37, 37.5, 38, 38.5, 39, 39.5, 40, 40.5, 41, 41.5, 42, 42.5 and 43} and the power (Wm-3) 15-level set is {3.0e4, 2.3e5, 4.3e5, 6.3e5, 8.3e5, 1.0e6, 1.2e6, 1.4e6, 1.6e6, 1.8e6, 2.0e6, 2.2e6, 2.4e6, 2.6e6 and 2.8e6}. Figure 9 shows total optimized absorbed power in the heated region versus the ratio of diameters of successive vessel generations (g) in the vasculature of the region with perfusion rate of 0.5 kg· m-3s-1. Asgincreases from 0.6 to 0.7, it indicates diameters of successive vessel generations are bigger. The total power required to heat the tumor volume decreases from 2.387 to 2.366. This is about 0.8% decrease in total optimized absorbed power in the region. There is approximately the same trend for g that increases from 0.7 to 0.8, and from 0.8 to 0.9.
Discussion
As PBHTE has been widely used in predicting overall temperature behaviors in tissue for many studies, mistaken prediction occurs, when in practicality, a vasculature with thermally significant vessels exists in or near the treated region. As shown in Figures 3 and 4, considering the treated region to be homogenous and without any vascular effect, we modeled it as a PBHTE (or Keff model) with some perfusion rate parameter.
We then obtained the prediction of optimal absorbed power field for the assumed trea-ted region. However, if in fact the region has a vasculature with thermally significant vessels, we clinically or experimentally applied the predicted optimal power field in the treated region. Therefore undercooling effect by vessels to the ideal temperature results as illustrated in Figure 5(a). In present results, cold strips, heterogeneous temperature spots and significant cooling effects by vessels in the treated region present vital char-acteristics in the CBVN model. These phenomena reveal the similar critical situations during treatments. Mostly, unsuccessful hyperthermia treatments lead to survival of cancerous tissues. Thus, insufficient net absorbed thermal energy in localized tissue area is one of the major problems. Furthermore, the presented results indicated an ideal case of complete absorbed thermal power in blood which usually generates attenuation in absorbing power (e. g. ultrasound power).
to reach the ideal therapeutic temperature due to vessels entering with lower inlet (to treated volume) temperatures. The required absorbed power is about twice of the value of that in the PBTHE case. To reveal detailed temperature discrepancy in the two models, the lengthwise vessel locations containing level 5 and level 6 vessel seg-ments at middle plane of heated region are chosen to compare those locations when using PBHTE model, that is shown in Figure 7(b). All temperatures in both models after optimization are in the range of 42-44°C. In CBVN model, blood (i.e. in arterial vessel) has higher temperatures than those (i.e. tissue) locations when using PBHTE in some locations, since blood has gained significant absorbed power during treatment. On the other hand, veinous case does not have large temperature difference than arterial one. One of reasons is that veinous vessels collecting blood from surrounding tissue temperatures which were well heated under treatment.
Additionally from Figures 8(e) and 8(f), they indicated that much of the power absorbed in the treated region after optimization is focused on (or near) blood vessels or dense vessel area. This power optimization scheme offers finer spatial power resolu-tion. A non-invasive heat transducer such as high-intensity focused ultrasound (HIFU) has great potential to perform the optimization scheme. Therefore, uniform ideal tem-perature is possibly reached throughout the treated region except for some cold spots due to significant vessels near the tumor boundary.
As the perfusion in the treated region decreases, the hyperthermia treatment improves significantly, as shown in the temperature distributions (Figures 8(a)-(d)). Temperature fields show more uniformity in the region as blood flow rate becomes smaller. That is, less temperature perturbation caused by vessels. These results show a systematic approach to reveal the impact of a vasculature of blood vessels against a single vessel which most studies have presented. Cold strips and cold spots are signifi-cantly reduced and/or disappear. Given those low perfusion rates of 0.5, 0.1, 0.05 and 0.01 kg· m-3s-1(Figure 8(a)-(d)) in the region with a vasculature, the blood flow speeds of level 1 branching vessel are calculated, and they are approximately 320, 64, 32 and 6 mm/s for those perfusion rates, respectively. This result suggests that reducing or preventing blood flow rate flowing into vasculature(s) of the tumorous treated region is helpful to the treatment. The magnitude of power is reduced as well when perfusion rate decreases.
As the results show in Figure 9, total optimized absorbed power in the heated region does not significantly change total power as the ratio of diameters of successive vessel generations increases from 0.6 to 0.9. Every increment of 0.1 ofgin the range of 0.6 to 0.9 only causes about 0.8% decrease of total absorbed power. Thus, it suggests the size of vessels in vasculature does not significantly affect total power consumption during treatments provided that constant perfusion rate at the region. For example, several thermally significant vessels and their blood flow rates are identified in the treated region; the size of diameters of vessels does not affect much the total absorbed power in the treatment thereafter. This helps in simplifying hyperthermia treatment process once the locations and blood flow rates of thermally significant vessels are identified.
Conclusion
to hyperthermia cancer treatment or thermal surgery. Second, the size of vessels in vasculatures does not significantly affect on total power consumption during hyperthermia therapy when the total blood flow rate is constant. Also, for the presence of thermally significant vessels in the treated region, particularly with high perfusion rate (i.e. greater than 0.5 kg· m-3s-1), PBHTE is not a suitable model to predict the temperature distribution. Last, in hyperthermia treatments, when the heated region consists of thermally significant vessels, much of absorbed power is required to heat the region and (provided that finer spatial power deposition exists) to heat vessels which could lead to higher blood temperatures than tissue temperatures when modeled them using PBHTE.
Future efforts should be aimed at developing more accurate and tissue-specific fully conjugated models which can better predict actual tissue temperatures in in-vivo situations.
Acknowledgements
The authors would like to thank the National Science Council of Taiwan for partially supporting this research under no. NSC 98-2221-E-032 -033.
Author details
1Department of Innovative Information and Technology, Software Engineering Group, Langyang Campus, Tamkang
University, I-lan County 26247, Taiwan.2Department of Biomedical Imaging and Radiological Science, China Medical University and Department of Radiology, China Medical University Hospital, Taichung 40402, Taiwan.3Department of Mechanical Engineering, Kun-shan University, Tainan 71003, Taiwan.
Authors’contributions
HWH developed the idea of an optimization scheme of temperature distributions during hyperthermia treatments and a vasculature of vessel network surrounding the periphery of tumorous tissue volume in which vessels tend to be sources of hot or cold spots (or stripes). HWH drafted the manuscript. TCS suggested some directions about the manuscript. TCS and CTL reviewed and analyzed mathematical models in the draft. All authors have read and approved the final manuscript.
Competing interests
The authors declare that they have no competing interests.
Received: 11 August 2009 Accepted: 26 March 2010 Published: 26 March 2010
References
1. Chilkoti A, Dreher MR, Meyer DE, Raucher D:Targeted drug delivery by thermally responsive polymers.Adv Drug
Deliv Rev2002,54:613-30.
2. Meyer DE, Kong GA, Dewhirst MW, Zalutsky MR, Chilkoti A:Targeting a genetically engineered elastin-like polypeptide to solid tumors by local hyperthermia.CancerRes2001,61:1548-54.
3. Dreher MR, Liu W, Michelich CR, Dewhirst MW, Chilkoti A:Thermal cycling enhances the accumulation of a temperature-sensitive biopolymer in solid tumors.CancerRes2007,67:4418-24.
4. Aluri S, Janib SM, Mackay JA:Environmentally responsive peptides as anticancer drug carriers.Adv DrugDeliv Rev 2009,61:940-52.
5. Franckena M, Fatehi D, de Bruijne M, Canters RA, van Norden Y, Mens JW, van Rhoon GC, Zee van der J:Hyperthermia dose-effect relationship in 420 patients with cervical cancer treated with combined radiotherapy
andhyperthermia.Eur J Cancer2009,45:1969-78.
6. Pennes HH:Analysis of tissue and arterial blood temperature in the resting human forearm.J Appl Phys1948, 1:93-122.
7. Chen MM, Holmes KR:Microvascular contributions in tissue heat transfer.Ann NY Acad Sci1980,335:137-50. 8. Lagendijk JJW, Schellekens M, Schipper J, Linden van der PM:A three-dimensional description of heating patterns in
vascularised tissues during hyperthermia treatment.Phys Med Biol1984,29:495-507.
9. Weinbaum S, Jiji LM:A new simplified bioheat equation for the effect of blood flow on local average tissue temperature.ASME J Biomech Eng1985,107:131-9.
10. Lagendijk JJW, Mooibroek J:Hyperthermia treatment planning.Recent Results Cancer Res1986,101:119-31. 11. Jiji LM, Weinbaum S, lemons DE:Theory and experiment for the effect of vascular microstructure on surface tissue
heat transfer - part ii: model formulation and solution.ASME J Biomech Eng1984,106:331-341. 12. Chato JC:Heat transfer to blood vessels.ASME J Biomech Eng1980,110:110-18.
13. Huang HW, Chan CL, Roemer RB:Analytical solutions of Pennes bio-heat transfer equation with a blood vessel.
ASME J Biomech Eng1994,116:208-12.
15. Baish JW:Heat transport by counter current blood vessels in the presence of an arbitrary temperature gradient.
ASME J Biomech Eng1990,112:207-211.
16. Baish JW, Ayyaswamy PS, Foster KR:Small-scale temperature fluctuations in perfused tissue during local hyperthermia.ASME J Biomech Eng1986,108:246-260.
17. Baish JW, Ayyaswamy PS, Foster KR:Heat transport mechanisms in vascular tissues: a model comparison.ASME J
Biomech Eng1986,108:324-330.
18. Baish JW, Foster KR, Ayyaswamy PS:Perfused phantom models of microwave irradiated tissue.ASME J Biomech Eng 1986,108:239-245.
19. Charney CK, Levin RC:Heat transfer normal to paired arterioles and venules embedded in perfused tissue during hyperthermia.ASME J Biomech Eng1988,110:277-282.
20. Chen ZP, Roemer RB:The effects of large blood vessels on temperature distributions during simulated hyperthermia.ASME J Biomech Eng1992,114:473-481.
21. Crezee J, Lagendijk JJW:Experimental verification of bio-heat transfer theories: measurement of temperature profiles around large artificial vessels in perfused tissues.Phys Med Biol1990,35:905-923.
22. Rawnsley R, Roemer RB, Dutton A:The simulation of large vessel effects in experimental hyperthermia.ASME J
Biomech Eng1994,116:256-262.
23. Leeuwen GMJV, Kotte ANTJ, Raaymakers BW, Lagendijk JJW:Temperature simulations in tissue with a realistic computer generated vessel network.Phys Med Biol2000,45:1035-1049.
24. Huang HW, Chen ZP, Roemer RB:A countercurrent vascular network model of heat transfer in tissues.ASME J
Biomech Eng1996,118:120-129.
25. Devashish Shrivastava, Roemer RB:Readdressing the issue of thermally significant blood vessels using a countercurrent vessel network.ASME J Biomech Eng2006,128:210-216.
26. Baish JW:Formulation of a statistical model of heat transfer in perfused tissue.J Biomech Eng ASME1994,116:521-7. 27. Lapidus L, Pinder GF:Numerical solution of partial differential equations in science and engineerinWiley-Interscience
Publication, New York 1982.
28. Chen ZP:A three dimensional treatment planning program for hyperthermia.Ph.D. dissertationUniversity of Arizona, Department of Mechanical and Aerospace Engineering 1989.
29. Chen ZP, Roemer RB:Improved cartesian coordinate finite difference simulations of small cylindrical objects.ASME
J Biomech Eng1993,115:119-122.
30. Horng TL, Lin WL, Liauh CT, Shih TC:Effects of pulsatile blood flow in large vessels on thermal dose distribution during thermal therapy.Med Phys2007,34(4):1312-20.
31. Green HD:Circulation, physical principles.Medical PhysicsThe Year Book Publishers, Inc., Chicago, ILGlasser O 1944, 208-252.
32. Whitmore RL:Rheology of the Circulation.Pergamon Press, New York, NY 1968. doi:10.1186/1475-925X-9-18
Cite this article as:Huanget al.:Predicting effects of blood flow rate and size of vessels in a vasculature on
hyperthermia treatments using computer simulation.BioMedical Engineering OnLine20109:18.
Submit your next manuscript to BioMed Central and take full advantage of:
• Convenient online submission
• Thorough peer review
• No space constraints or color figure charges
• Immediate publication on acceptance
• Inclusion in PubMed, CAS, Scopus and Google Scholar
• Research which is freely available for redistribution