R E S E A R C H A R T I C L E
Open Access
Prognostic models for complete recovery in
ischemic stroke: a systematic review and
meta-analysis
Nampet Jampathong, Malinee Laopaiboon
*, Siwanon Rattanakanokchai and Porjai Pattanittum
Abstract
Background:Prognostic models have been increasingly developed to predict complete recovery in ischemic stroke. However, questions arise about the performance characteristics of these models. The aim of this study was to systematically review and synthesize performance of existing prognostic models for complete recovery in ischemic stroke.
Methods:We searched journal publications indexed in PUBMED, SCOPUS, CENTRAL, ISI Web of Science and OVID MEDLINE from inception until 4 December, 2017, for studies designed to develop and/or validate prognostic models for predicting complete recovery in ischemic stroke patients. Two reviewers independently examined titles and abstracts, and assessed whether each study met the pre-defined inclusion criteria and also independently extracted information about model development and performance. We evaluated validation of the models by medians of the area under the receiver operating characteristic curve (AUC) or c-statistic and calibration performance. We used a random-effects meta-analysis to pool AUC values.
Results:We included 10 studies with 23 models developed from elderly patients with a moderately severe ischemic stroke, mainly in three high income countries. Sample sizes for each study ranged from 75 to 4441. Logistic regression was the only analytical strategy used to develop the models. The number of various predictors varied from one to 11. Internal validation was performed in 12 models with a median AUC of 0.80 (95% CI 0.73 to 0.84). One model reported good calibration. Nine models reported external validation with a median AUC of 0.80 (95% CI 0.76 to 0.82). Four models showed good discrimination and calibration on external validation. The pooled AUC of the two validation models of the same developed model was 0.78 (95% CI 0.71 to 0.85).
Conclusions:The performance of the 23 models found in the systematic review varied from fair to good in terms of internal and external validation. Further models should be developed with internal and external validation in low and middle income countries.
Keywords:Stroke, Cerebral ischemia, Prognosis, Ischemic stroke, Prognostic model, Systematic review
Background
Globally, stroke is the second leading cause of death following ischemic heart disease and the third leading cause of disability [1,2]. In 2013, 6.5 million deaths from stroke (51% died from ischemic stroke), 113 million disability-adjusted life years were lost because of stroke (58% due to ischemic stroke) and 10.3 million of people with new strokes (67% were ischemic stroke) [1]. In
2015, prevalence of stroke was 42.4 million people, which included ischemic stroke for 24.9 million. There were 6.3 million stroke deaths worldwide, and 3.0 million individuals died of ischemic stroke [2].
Minimizing the time to treatment for stroke is the important key to improving chances of an excellent outcome (time lost is brain lost) [3]. It is also important to be able to predict the outcomes of diseases or treat-ments. Most physicians use their own clinical experience in predicting their patients’ outcomes for making deci-sions in patient care management. The accuracy of these informal predictions is unclear. Care management might
* Correspondence:[email protected];[email protected] Department of Epidemiology and Biostatistics, Faculty of Public Health, Khon Kaen University, 123 Mittraphap Road, Nai-Muang, Muang District, Khon Kaen 40002, Thailand
be improved if the physicians combined their clinical forecasts with the formal predictions provided by statistical models. This may be more accurate than relying simply on clinical experience. Prognostic models are statistical tools to assist physicians in making decisions which may affect their patients’outcomes [4].
Accurate prognostic models of the functional outcome of a complete recovery in patients after ischemic stroke could be beneficial to neurological care practices for a number of reasons. Firstly, the information of developed prognostic model could be used to select appropriate treatments and action plans in individual patient manage-ment, including patient counseling. Secondly, they could be used to improve rehabilitation and discharge planning. Lastly, in light of a weakening economy, prognostic models could be used to make the best clinical choices for patients with regard to specific clinical scenarios which may reduce health care costs [5].
To date, several studies have developed prognostic models to predict functional outcomes after ischemic stroke, and each model has different strengths and weak-nesses. Since models do not always work well in practice, it is recommended that, before a prognostic model is used in clinical practice, the performance of the model should be properly evaluated. This process is known as model validation and involves an assessment of calibration (the agreement between the observed and predicted outcomes) and discrimination (the model’s ability to discriminate between those patients who are likely or unlikely to ex-perience a particular prognostic event). A poor calibration usually reflects over-fitting of the model in the develop-ment sample. At least the models should be determined the internal validity (for example, using ‘bootstrap sam-pling’) to assess validity for the setting where the develop-ment data originated from. Another aspect is the external validity (using patient data not used for the development model) to assess generalizability [6,7].
There may be danger in moving too quickly to use these models without appropriate validation and understanding of their limitations. The purpose of this study was to systematically review and synthesize performance of exist-ing prognostic models which have been used to predict the probability of complete recovery in ischemic stroke and to investigate their quality.
Methods Selection criteria
We included studies predicting the outcome of complete recovery after ischemic stroke and in which complete recovery was assessed by scores on at least one of the following instruments: the Barthel Index (BI)≥95/100 or 19/20, the Glasgow Outcome Scale (GOS) score = 1, the Oxford Handicap Scale (OHS) score≤2, and the Modified Rankin Scale (mRS) score≤1. A further criterion was that
the studies reported model performance by the use of the concordance statistic, area under the receiver operating characteristic curve (AUC) or calibration performance. There were no restrictions on timing of the outcome evalu-ation, age of the patients, or type/severity of ischemic stroke.
Search strategy
We searched PUBMED, SCOPUS, CENTRAL, ISI Web of Science and OVID MEDLINE for prognostic models published from inception until 4 December, 2017, using the search terms listed in the Additional file 1 without restrictions on publication language. We also reviewed the reference lists of relevant studies.
Study selection and data extraction
Study titles and abstracts were independently screened and selected by two reviewers (NJ and SR) using the specified criteria. If a decision could not be made based on the abstracts, we then considered their full texts. Dis-agreement was resolved through discussion with a third reviewer (ML). We extracted the performance measures (concordance statistics, AUCs and performance calibra-tions) of both types of prediction model: development models and validation models. We also extracted study characteristics: author(s), publication year, setting, study design, definition of outcome, number of subjects, num-ber of outcome events, age, ischemic stroke severity and duration of follow-up.
Quality assessment
We assessed the study quality based on an adaptation of the tool developed by D’Amico et al. [8]. We showed how each study performed according to each of various major methodological requirements for prognosis research studies. The assessment items were as follows:
Did the prognostic study use a cohort design? Were the predictors clearly defined and details
provided of how they were measured? Were the missing data handled appropriately
with statistical imputation?
Was some form of stepwise analysis used for selecting predictors in a multivariable analysis? Was the sample size adequate as defined by an
events-per-variable ratio of 10 or more? Was the final model validated on the patients
who were used to generate the model (internal validation)?
Statistical analysis
We qualitatively synthesized model performances because each separate model had a different combination of pre-dictor variables. We used frequencies and medians with 95% confidence intervals to describe the model perform-ance which included its calibration (how closely predicted values agree with the observed values) and discrimination (the model’s ability to discriminate between patients developing and not developing an outcome event, e.g., complete recovery cases and non-complete recovery cases among ischemic patients). The assessment of calibration was performed using either the Hosmer-Lemshow chi-square test or a calibration curve. The assessment of discrimination was conducted using either the AUC or the concordance statistic (C-statistic) along with a 95% CI. The discrimination of each model was evaluated in ac-cordance with the suggestions by Hosmer and Lemeshow: excellent (AUC≥0.90), good (AUC≥0.80 and˂0.90), fair (AUC≥0.70 and˂0.80), and poor (AUC˂0.70). Calibra-tion was judged as good when a calibraCalibra-tion curve closely resembled the line representing perfect calibration (the pre-specified acceptable absolute mean error for the cali-bration curve was ˂0.4) or when the Hosmer-Lemshow
chi-square test was non-significant [9, 10]. We estimated the 95% CIs for AUCs using Hanley’s method for a study which presented only AUCs. The estimation required three quantities: total sample size, number of events and an AUC [11]. If two or more models assessed discrimin-ation performance in terms of validdiscrimin-ation, we performed a random-effects inverse-variance meta-analysis using Stata version 10.1 [12].
Results
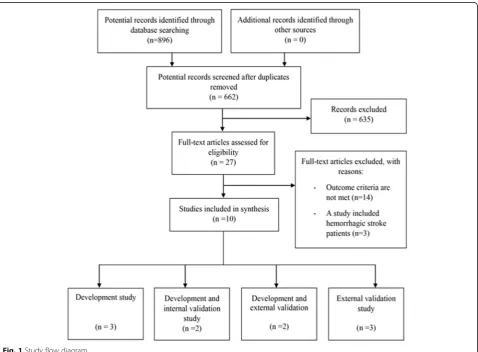
A total of 896 articles were found by searching the elec-tronic databases, and 10 studies were eligible [13–22]. Seven studies were development studies; while three were validation studies (see Fig.1). Twenty three differ-ent models were iddiffer-entified.
Patient characteristics of included models
All included models were developed from elderly patients in high income countries: five studies from the United States of America [13–16, 22], three from Germany [17–19] and one from the Netherlands [21]. One study [20] did not report study setting but used data from the Virtual International Stroke Trials
Archive (VISTA) which included patients from many different countries.
Twenty models were developed from patients with a moderately severe ischemic stroke based on the NIHSS score [23], but for three models ischemic stroke severity was not reported. The sample sizes from which the
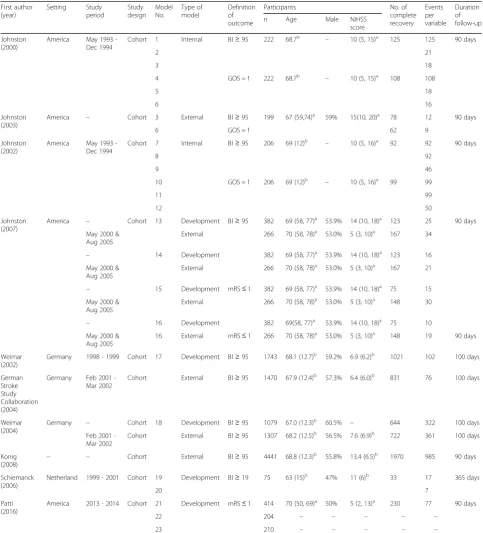
models were developed ranged from 75 to 4441, the complete recovery cases ranged from 33 to 1970 and were measured at around 90 days after ischemic stroke diagnosed in six studies [13–16, 20, 22], at 100 days in three studies [17–19], and at 365 days in one study [21]. Table1presents the characteristics of the models.
Table 1Characteristics of prognostic models
First author (year) Setting Study period Study design Model No. Type of model Definition of outcome
Participants No. of
complete recovery Events per variable Duration of follow-up
n Age Male NIHSS
score
Johnston (2000)
America May 1993 -Dec 1994
Cohort 1 Internal BI≥95 222 68.7b
– 10 (5, 15)a
125 125 90 days
2 21
3 18
4 GOS = 1 222 68.7b – 10 (5, 15)a 108 108
5 18
6 16
Johnston (2003)
America – Cohort 3 External BI≥95 199 67 (59,74)a
59% 15(10, 20)a
78 12 90 days
6 GOS = 1 62 9
Johnston (2002)
America May 1993 -Dec 1994
Cohort 7 Internal BI≥95 206 69 (12)b
– 10 (5, 16)a
92 92 90 days
8 92
9 46
10 GOS = 1 206 69 (12)b – 10 (5, 16)a 99 99
11 99
12 50
Johnston (2007)
America – Cohort 13 Development BI≥95 382 69 (58, 77)a
53.9% 14 (10, 18)a
123 25 90 days
May 2000 & Aug 2005
External 266 70 (58, 78)a 53.0% 5 (3, 10)a 167 34
– 14 Development 382 69 (58, 77)a
53.9% 14 (10, 18)a
123 16
May 2000 & Aug 2005
External 266 70 (58, 78)a 53.0% 5 (3, 10)a 167 21
– 15 Development mRS≤1 382 69 (58, 77)a
53.9% 14 (10, 18)a
75 15
May 2000 & Aug 2005
External 266 70 (58, 78)a 53.0% 5 (3, 10)a 148 30
– 16 Development 382 69(58, 77)a
53.9% 14 (10, 18)a
75 10
May 2000 & Aug 2005
16 External mRS≤1 266 70 (58, 78)a 53.0% 5 (3, 10)a 148 19 90 days
Weimar (2002)
Germany 1998 - 1999 Cohort 17 Development BI≥95 1743 68.1 (12.7)b
59.2% 6.9 (6.2)b
1021 102 100 days
German Stroke Study Collaboration (2004)
Germany Feb 2001 -Mar 2002
Cohort External BI≥95 1470 67.9 (12.4)b 57.3% 6.4 (6.0)b 831 76 100 days
Weimar (2004)
Germany – Cohort 18 Development BI≥95 1079 67.0 (12.3)b
60.5% – 644 322 100 days
Feb 2001 -Mar 2002
Cohort External BI≥95 1307 68.2 (12.5)b 56.5% 7.6 (6.9)b 722 361 100 days
Konig
(2008) – –
Cohort External BI≥95 4441 68.8 (12.3)b
55.8% 13.4 (6.5)b
1970 985 90 days
Schiemanck (2006)
Netherland 1999 - 2001 Cohort 19 Development BI≥19 75 63 (15)b 47% 11 (6)b 33 17 365 days
20 7
Patti (2016)
America 2013 - 2014 Cohort 21 Development mRS≤1 414 70 (50, 69)a 50% 5 (2, 13)a 230 77 90 days
22 204 – – – – –
23 210 – – – – –
a
Model predictors
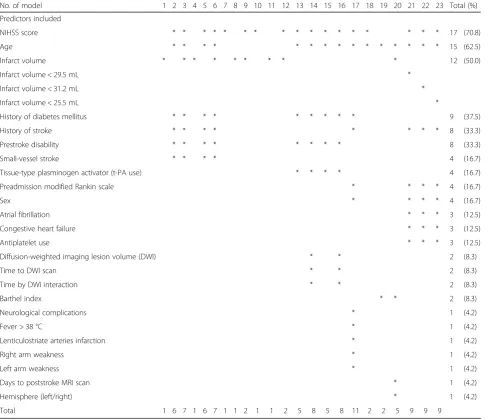
A total of 24 different variables were included in the 23 models. The number of variables included in each model ranged from 1 to 11. The National Institutes of Health Stroke Scale (NIHSS) was the most common predictor (70.8%) followed by age (62.5%) and infarct volume (50.0%). Table2presents details of predictor variables.
Quality of prognostic models
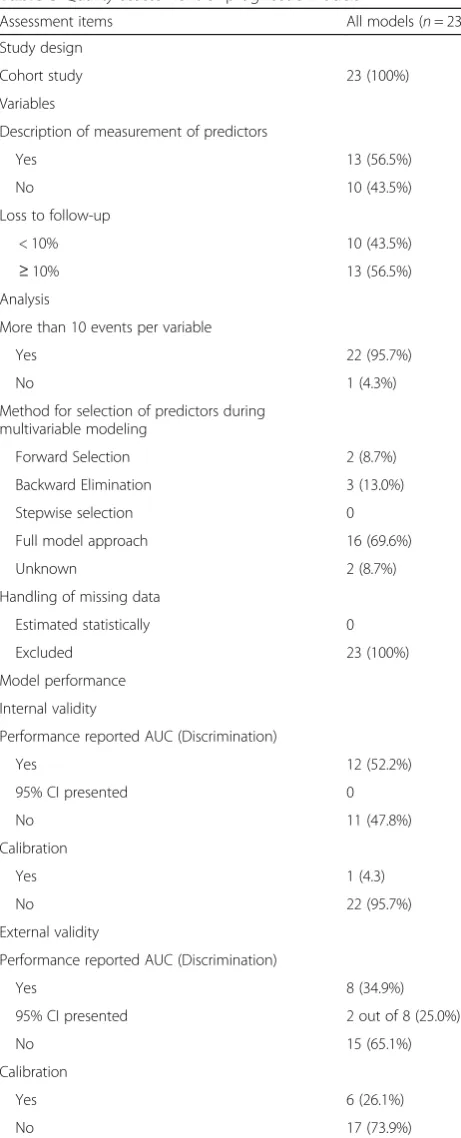
All 10 studies used a cohort design. Details about the meas-urement of predictors were presented for 13 of the 23 models (56.5%). All of the 10 studies handled missing data by excluding subjects from the analyses. The full model approach (all the candidate predictors included in the multivariable analysis) was the most common method used (69.6%) for selection of predictors by multivariable
modeling [13, 14, 16]. Two studies [13, 14] reported 12 development models (model No.1-12) but provided no in-formation on their discrimination performances. However, they did report their discrimination performances on in-ternal validation, but for only one model (model No. 9) was calibration performance reported in the internal validation. Five studies [15,16, 18–20] reported external validation in nine models (model No.3, 6 and 13-18). Calibration perfor-mances were reported for six of these nine models, and four of them (model No. 3, 6, 13 and 15) showed good calibra-tion. There was only one study which provided a 95% confi-dence interval for the AUC [21]; those of the other nine studies [13–20, 22] were estimated using Hanley’s method (see Table4). There were only two models (model No.3 and No.6) which were validated both internally and externally. Table3presents details of quality of prognostic models.
Table 2Predictors included in final model
No. of model 1 2 3 4 5 6 7 8 9 10 11 12 13 14 15 16 17 18 19 20 21 22 23 Total (%)
Predictors included
NIHSS score * * * * * * * * * * * * * * * * * 17 (70.8)
Age * * * * * * * * * * * * * * * 15 (62.5)
Infarct volume * * * * * * * * * 12 (50.0)
Infarct volume < 29.5 mL *
Infarct volume < 31.2 mL *
Infarct volume < 25.5 mL *
History of diabetes mellitus * * * * * * * * * 9 (37.5)
History of stroke * * * * * * * * 8 (33.3)
Prestroke disability * * * * * * * * 8 (33.3)
Small-vessel stroke * * * * 4 (16.7)
Tissue-type plasminogen activator (t-PA use) * * * * 4 (16.7)
Preadmission modified Rankin scale * * * * 4 (16.7)
Sex * * * * 4 (16.7)
Atrial fibrillation * * * 3 (12.5)
Congestive heart failure * * * 3 (12.5)
Antiplatelet use * * * 3 (12.5)
Diffusion-weighted imaging lesion volume (DWI) * * 2 (8.3)
Time to DWI scan * * 2 (8.3)
Time by DWI interaction * * 2 (8.3)
Barthel index * * 2 (8.3)
Neurological complications * 1 (4.2)
Fever > 38 °C * 1 (4.2)
Lenticulostriate arteries infarction * 1 (4.2)
Right arm weakness * 1 (4.2)
Left arm weakness * 1 (4.2)
Days to poststroke MRI scan * 1 (4.2)
Hemisphere (left/right) * 1 (4.2)
Total 1 6 7 1 6 7 1 1 2 1 1 2 5 8 5 8 11 2 2 5 9 9 9
Model performances
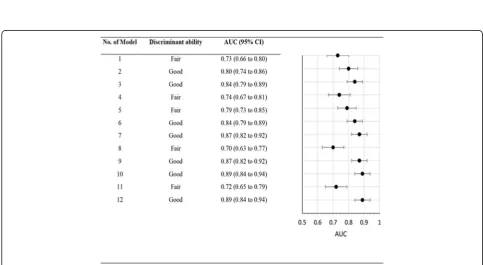
There were 11 development models which reported AUC values. The median AUC was 0.80 (95% CI 0.77 to 0.85) (see Table4and Fig.2).
Internal validation
Model performance was evaluated using internal valid-ation by bootstrapping methods in 12 models (model No.1-12). The models were validated in samples of 222 [13] and 206 [14] elderly patients with a moderately severe ischemic stroke. The number of events ranged from 92 to 125 (see Table 1). The median AUC for discrimination performance on internal validation was 0.82 (95% CI 0.73 to 0.87); there was only model No. 9 which was reported to have good calibration (see Table4and Fig.3).
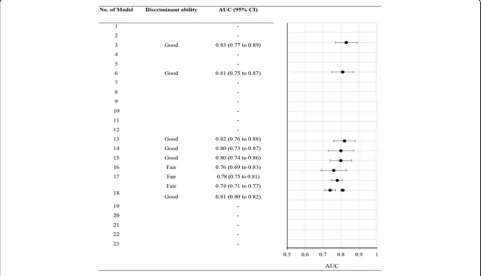
External validation
Two studies [16,19] reported external validation in their five developed models (model No.13-16 and 18). Model No.18 was validated in two different samples in two studies [19, 20]; one study included patients from Germany [19] and another study included patients from many countries [20]. Three other studies [15, 18, 20] reported external validation of four pre-existing models (model No 3, 6, 17 and 18).
On external validation discrimination and calibration performance were reported in six models (model No. 3, 6 and 13-16). Four of the six models had good discrimin-ation with a median AUC of 0.81 (95% CI 0.80 to 0.83), and good calibration (model No. 3, 6, 13 and 15). Three other models (model No.17, model No.18 reported in two external populations) reported only discrimination per-formance. The pooled AUC value for model No. 18 was 0.78 (95% CI 0.71 to 0.85; two studies) (see Fig. 4). The median AUC of these nine validation models was 0.80 (95% CI 0.76 to 0.82) (see Table4and Fig.5).
Discussion
This systematic review identified 23 prognostic models from ten studies for complete recovery in ischemic stroke. None of these models provided complete information about the model performance which included both internal and external validation. While most prognostic models (18/ 23) were validated and half of the models (12/23) reported fair to good discrimination on internal validation, only one model showed good calibration. Nearly one third of the models (9/23) were externally validated, and reported fair to good discrimination performance, but only a quarter of the models (6/23) reported nearly perfect calibration. Only two models were validated both internally and externally but not in complete process of the model performance. There was only one model in which a meta-analysis could be performed, and the pooled AUC was fair.
The models were developed and validated in elderly patients mainly with a moderately severe stroke and mainly from high income countries. In addition, most of the developed models were not externally validated. These factors are likely to limit the application of the models to other populations and settings.
Table 3Quality assessment of prognostic models
Assessment items All models (n= 23)
Study design
Cohort study 23 (100%)
Variables
Description of measurement of predictors
Yes 13 (56.5%)
No 10 (43.5%)
Loss to follow-up
< 10% 10 (43.5%)
≥10% 13 (56.5%)
Analysis
More than 10 events per variable
Yes 22 (95.7%)
No 1 (4.3%)
Method for selection of predictors during multivariable modeling
Forward Selection 2 (8.7%)
Backward Elimination 3 (13.0%)
Stepwise selection 0
Full model approach 16 (69.6%)
Unknown 2 (8.7%)
Handling of missing data
Estimated statistically 0
Excluded 23 (100%)
Model performance
Internal validity
Performance reported AUC (Discrimination)
Yes 12 (52.2%)
95% CI presented 0
No 11 (47.8%)
Calibration
Yes 1 (4.3)
No 22 (95.7%)
External validity
Performance reported AUC (Discrimination)
Yes 8 (34.9%)
95% CI presented 2 out of 8 (25.0%)
No 15 (65.1%)
Calibration
Yes 6 (26.1%)
In our review, we conducted a systematic search of several electronic databases. All of the included studies used a cohort design. For half of all the identified models more than 10% of their subjects’data was miss-ing. The model performance analyses were handled by excluding the subjects with missing data. This strategy could lead to biased conclusions if the reasons for miss-ing data were related to the important prognostic indi-cators or outcomes.
There are some issues related to the assessed quality of the prognostic models. Firstly, our search was performed up to 4 December, 2017. No attempt was made to search unpublished studies. Studies were selected and extracted independently by two reviewers. We did not assess publi-cation bias by any statistical tests or funnel plot asym-metry due to insufficient data. However, we assessed and presented the quality of all the 10 selected studies for each important quality features listed in our methods section.
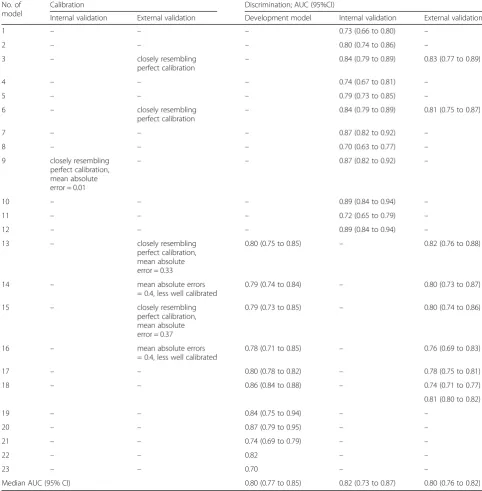
Table 4Model performances
No. of model
Calibration Discrimination; AUC (95%CI)
Internal validation External validation Development model Internal validation External validation
1 – – – 0.73 (0.66 to 0.80) –
2 – – – 0.80 (0.74 to 0.86) –
3 – closely resembling
perfect calibration
– 0.84 (0.79 to 0.89) 0.83 (0.77 to 0.89)
4 – – – 0.74 (0.67 to 0.81) –
5 – – – 0.79 (0.73 to 0.85) –
6 – closely resembling
perfect calibration –
0.84 (0.79 to 0.89) 0.81 (0.75 to 0.87)
7 – – – 0.87 (0.82 to 0.92) –
8 – – – 0.70 (0.63 to 0.77) –
9 closely resembling perfect calibration, mean absolute error = 0.01
– – 0.87 (0.82 to 0.92) –
10 – – – 0.89 (0.84 to 0.94) –
11 – – – 0.72 (0.65 to 0.79) –
12 – – – 0.89 (0.84 to 0.94) –
13 – closely resembling
perfect calibration, mean absolute error = 0.33
0.80 (0.75 to 0.85) – 0.82 (0.76 to 0.88)
14 – mean absolute errors
= 0.4, less well calibrated
0.79 (0.74 to 0.84) – 0.80 (0.73 to 0.87)
15 – closely resembling
perfect calibration, mean absolute error = 0.37
0.79 (0.73 to 0.85) – 0.80 (0.74 to 0.86)
16 – mean absolute errors
= 0.4, less well calibrated
0.78 (0.71 to 0.85) – 0.76 (0.69 to 0.83)
17 – – 0.80 (0.78 to 0.82) – 0.78 (0.75 to 0.81)
18 – – 0.86 (0.84 to 0.88) – 0.74 (0.71 to 0.77)
0.81 (0.80 to 0.82)
19 – – 0.84 (0.75 to 0.94) – –
20 – – 0.87 (0.79 to 0.95) – –
21 – – 0.74 (0.69 to 0.79) – –
22 – – 0.82 – –
23 – – 0.70 – –
Fig. 3Discrimination performance in internal validation models
Secondly, about 70% (16/23) of the models used the full model approach in predictor selection (all the candidate pre-dictors included in the multivariable analysis) [13, 14, 16]. This approach could reduce the risk of predictor selection bias and over-fitting. However, this technique is difficult to apply if the number of events is limited [6]. In our review, all of the models with the full model approach to predictor selection had fulfilled the requirement of more than 10 patients with complete recovery per predictor. Finally, incomplete measures of the prognostic model performances were reported in all included models. The 95% confidence intervals of the estimated performance indices were rarely reported. The 95% confidence intervals for AUCs which we estimated using Hanley’s method may be slightly inaccurate, but this approach has been accepted in estimating the preci-sion of AUCs when their standard errors are not reported. In addition, calibration performance was often ignored.
Calibration is the important performance measure for appli-cation of the model in practice. A poor calibration reflects over-fitting of a model and can also be interpreted as reflecting a need for shrinkage of regression coefficients in a prognostic model [10].
To our knowledge, there are three previous systematic reviews of prognostic models in stroke, but their out-comes of interest were different from ours: for example, mortality in hemorrhagic stroke, recurrent stroke and survival outcome of stroke patients. Therefore, our results were not able to be compared directly to the results of previous reviews. However, while the discrimination per-formance of their prognostic models varied from poor to good, calibration performance was not considered. The first study was a systematic review of prognostic tools for early mortality in hemorrhagic stroke [24]. The authors selected 11 articles (12 prognostic tools), but validation
Fig. 4Meta-analysis of the areas under the receiver operating characteristic curve (AUC) for previous prognostic models
data were reported for only one of the prognostic tools. The Hemphill-intracerebral hemorrhage (ICH) model had the largest number of validation cohorts (nine articles) and showed good performance with a pooled AUC of 0.80 (95%CI 0.77 to 0.85). The second study was a systematic review of prognostic models to predict survival in patients with acute stroke. The authors found 83 models, but only three models were externally validated and showed fair to good discrimination [25]. The final study was a systematic review of prediction models for recurrent stroke and myocardial infarction after stroke. The authors showed that the models for recurrent stroke discriminate poorly between patients with and without a recurrent stroke with the pooled AUCs of 0.60 (95% CI 0.59 to 0.62) for the Essen Stroke Risk Score (ESRS) and 0.62 (95% CI 0.60 to 0.64) for the Stroke Prognosis Instrument II (SPI-II) [26].
Our findings suggest that some of the current prognos-tic models for predicting complete recovery from ischemic stroke may be clinically useful when applied to patients from high income countries who have experi-enced moderately severe ischemic stroke. Model No. 9 which was developed by Johnston et al. [14] suggests that the model was not over-fitted to the data set and is likely to be useful in predicting complete recovery from ische-mic stroke in a similar population. Models No.3, 6, 13 and 15 involving eight predictors, including NIHSS score, age, infarct volume, history of diabetes mellitus and stroke, prestroke disability, small-vessel stroke and tissue-type plasminogen activator (t-PA use). Some were overlapped among the models as shown in Table2. These models ful-filled the majority of the methodological requirements and showed acceptable performances in the external valid-ation for both discriminvalid-ation and calibrvalid-ation. We recom-mend that these models should be used in other settings.
Conclusions
This systematic review has shown that, while many prognostic models have been published, they are rarely validated in external populations, and most of the models were developed from elderly patients with moderately severe ischemic stroke, mainly in high in-come countries. There is a need for the development of models in other settings, especially in low and middle income populations. All models should be val-idated, and performance measures should be reported which address the two key issues of discrimination and calibration.
Additional file
Additional file 1:The databases and search strategies use in the systematic review. (PDF 134 kb)
Abbreviations
AUC:Area under a receiver operating characteristic (ROC) curve; BI: Barthel Index; C-statistics: Concordance statistics; CT: Computerized tomography; ESRS: Essen Stroke Risk Score; GOS: Glasgow Outcome Scale; MRI: Magnetic resonance imaging; mRS: Modified Rankin Scale; NIHSS: National Institutes of Health Stroke Scale; OHS: Oxford Handicap Scale; SPI-II: Stroke Prognosis Instrument II
Acknowledgments
The authors wish to thank a native English language speaker, Peter Bradshaw, for line and copy editing drafts of the manuscript. The funding organization had no role in this research.
Funding
Not applicable.
Availability of data and materials
We do not hold any original data as this is a review article.
Authors’contributions
NJ, ML and PP developed the protocol. NJ conducted the systematic review. NJ and SR conducted the literature search and the data extraction. NJ and ML drafted the manuscript. All authors read and approved the final manuscript.
Ethics approval and consent to participate
Not applicable. This study is a systematic review of published papers and as such did not require ethical approval or any consent.
Consent for publication
Not applicable. This study is a systematic review of published papers and does not contain any individual person’s data.
Competing interests
The authors declare that they have no competing interests.
Publisher’s Note
Springer Nature remains neutral with regard to jurisdictional claims in published maps and institutional affiliations.
Received: 15 January 2018 Accepted: 28 February 2018
References
1. Feigin VL, Norrving B, Mensah GA. Global burden of stroke. Circ Res. 2017;120:439–48.
2. Benjamin EJ, Virani SS, Callaway CW, Chang AR, Cheng S, Chiuve SE, et al. Heart disease and stroke statistics-2018 update: a report from the American Heart Association. Circulation. 2018;137:1–442.
3. Moser DK, Kimble LP, Alberts MJ, Alonzo A, Croft JB, Dracup K, Evenson KR, Go AS, Hand MM, Kothari RU, Mensah GA. Reducing delay in seeking treatment by patients with acute coronary syndrome and stroke: a scientific statement from the American Heart Association Council on cardiovascular nursing and stroke council. J Cardiovasc Nurs. 2007;22:326–43.
4. Steyerberg E, Moons KGM, van der Windt D, Hayden J, Perel P, Schroter S, et al. Prognosis research strategy (PROGRESS) series 3: prognostic model research. PLoS Med. 2013;10:e1001381.
5. Vogenberg FR. Predictive and prognostic Models: implications for healthcare decision-making in a modern recession. American health & drug benefits. 2009;2:218.
6. Pavlou M, Ambler G, Seaman SR, Guttmann O, Elliott P, King M, et al. How to develop a more accurate risk prediction model when there are few events relative to the number of predictors. BMJ (Clinical research ed). 2015;351:h3868. 7. Justice AC, Covinsky KE, Berlin JA. Assessing the generalizability of
prognostic information. Ann Intern Med. 1999;130:515–24.
8. D’Amico G, Malizia G, D’Amico M. Prognosis research and risk of bias. Intern Emerg Med. 2016;11:251–60.
9. Kleinbaum D, Klein M. Logistic regression: a self- learning text. 3rd ed. New York: Springer; 2010.
framework for some traditional and novel measures. Epidemiology (Cambridge, Mass). 2010;21:128.
11. Hanley A, Mcneil J, Hanley JA, BJ MN. The meaning and use of the area under a receiver operating characteristic (ROC) curve. Radiology. 1982;143:29–36.
12. StataCorp. Stata statistical software,Release 10. College Station: StataCorp LP; 2007. 13. Johnston KC, Connors AF, Wagner DP, Knaus WA, Wang X, Haley EC. A
predictive risk model for outcomes of ischemic stroke. Stroke. 2000;31:448–55. 14. Johnston KC, Wagner DP, Haley EC, Connors AF. Combined clinical
and imaging information as an early stroke outcome measure. Stroke. 2002;33:466–72.
15. Johnston KC, Connors AF Jr, Wagner DP, Haley EC Jr. Predicting outcome in ischemic stroke: external validation of predictive risk models. 2003;34:200–2. 16. Johnston KC, Wagner DP, Wang X-Q, Newman GC, Thijs V, Sen S, et al.
Validation of an acute ischemic stroke model: does diffusion-weighted imaging lesion volume offer a clinically significant improvement in prediction of outcome? Stroke. 2007;38:1820–5.
17. Weimar C, Ziegler A, König IR, Diener HC. Predicting functional outcome and survival after acute ischemic stroke. J Neurol. 2002;249:888–95. 18. German Stroke Study Collaboration. Predicting outcome after acute
ischemic stroke: an external validation of prognostic models. Neurology. 2004;62:581–5.
19. Weimar C, König IR, Kraywinkel K, Ziegler A, Diener HC. Age and National Institutes of Health stroke scale score within 6 hours after onset are accurate predictors of outcome after cerebral ischemia. Stroke. 2004;35:158–62. 20. König IR, Ziegler A, Bluhmki E, Hacke W, Bath PM, Sacco RL, Diener HC,
Weimar C. Predicting long-term outcome after acute ischemic stroke. Stroke. 2008;39:1821–6.
21. Schiemanck SK, Kwakkel G, Post MW, Kappelle LJ, Prevo AJ. Predicting long-term independency in activities of daily living after middle cerebral artery stroke. Stroke. 2006;37:1050–4.
22. Patti J, Helenius J, Puri AS, Henninger N. White matter Hyperintensity– adjusted critical infarct thresholds to predict a favorable 90-day outcome. Stroke. 2016;47:2526–33.
23. Hage V. The NIH stroke scale: a window into neurological status. NurseCom Nursing Spectrum (Greater Chicago). 2011;24:44–9.
24. Mattishent K, Kwok CS, Ashkir L, Pelpola K, Myint PK, Loke YK. Prognostic tools for early mortality in hemorrhagic stroke: systematic review and meta-analysis. J Clin Neurol. 2015;11:339–48.
25. Counsell C, Dennis M. Systematic review of prognostic models in patients with acute stroke. Cerebrovasc Dis. 2001;12:159–70.
26. Thompson DD, Murray GD, Dennis M, Sudlow CL, Whiteley WN. Formal and informal prediction of recurrent stroke and myocardial infarction after stroke: a systematic review and evaluation of clinical prediction models in a new cohort. BMC Med. 2014;12:58.
• We accept pre-submission inquiries
• Our selector tool helps you to find the most relevant journal
• We provide round the clock customer support
• Convenient online submission
• Thorough peer review
• Inclusion in PubMed and all major indexing services
• Maximum visibility for your research
Submit your manuscript at www.biomedcentral.com/submit