Open Access
Methodology
A rapid method of fruit cell isolation for cell size and shape
measurements
Peter A McAtee, Ian C Hallett, Jason W Johnston and Robert J Schaffer*
Address: The New Zealand Institute for Plant & Food Research, Private Bag 92169, Auckland 1142, New Zealand
Email: Peter A McAtee - [email protected]; Ian C Hallett - [email protected]; Jason W Johnston - [email protected]; Robert J Schaffer* - [email protected] * Corresponding author
Abstract
Background: Cell size is a structural component of fleshy fruit, contributing to important traits such as fruit size and texture. There are currently a number of methods for measuring cell size; most rely either on tissue sectioning or digestion of the tissue with cell wall degrading enzymes or chemicals to release single cells. Neither of these approaches is ideal for assaying large fruit numbers as both require a considerable time to prepare the tissue, with current methods of cell wall digestions taking 24 to 48 hours. Additionally, sectioning can lead to a measurement of a plane that does not represent the widest point of the cell.
Results: To develop a more rapid way of measuring fruit cell size we have developed a protocol that solubilises pectin in the middle lamella of the plant cell wall releasing single cells into a buffered solution. Gently boiling small fruit samples in a 0.05 M Na2CO3 solution, osmotically balanced with 0.3 M mannitol, produced good cell separation with little cellular damage in less than 30 minutes. The advantage of combining a chemical treatment with boiling is that the cells are rapidly killed. This stopped cell shape changes that could potentially occur during separation. With this method both the rounded and angular cells of the apple cultivars SciRos 'Pacific Rose' and SciFresh 'Jazz'™ were observed in the separated cells. Using this technique, an in-depth analysis was performed measuring cell size from 5 different apple cultivars. Cell size was measured using the public domain ImageJ software. For each cultivar a minimum of 1000 cells were measured and it was found that each cultivar displayed a different distribution of cell size. Cell size within cultivars was similar and there was no correlation between flesh firmness and cell size. This protocol was tested on tissue from other fleshy fruit including tomato, rock melon and kiwifruit. It was found that good cell separation was achieved with flesh tissue from all these fruit types, showing a broad utility to this protocol.
Conclusion: We have developed a method for isolating single cells from fleshy fruit that reduces the time needed for fruit cell separation. This method was used to demonstrate differences in cell size and shape for 5 different apple cultivars. While firmness between the different cultivars is independent of cell size, apples with more angular cells appear to be firmer.
Published: 29 April 2009
Plant Methods 2009, 5:5 doi:10.1186/1746-4811-5-5
Received: 29 January 2009 Accepted: 29 April 2009
This article is available from: http://www.plantmethods.com/content/5/1/5
© 2009 McAtee et al; licensee BioMed Central Ltd.
Background
Cell shape and size are important determinants of fruit size and texture. Recent reports investigating these links include Solanum lycopersicum (tomato) [1]Malus × domes-tica (apples) [2], Prunus avium (Sweet cherry) [3,4] Diospy-ros species (Persimmon) [5], Prunus persica (peach) [6] and
Musa species (banana) [7]. In these cases, cell number or cell size was either estimated from fixed tissue that had then undergone sectioning, or cell maceration using chemical or enzymic digestions over 12 to 48 hours. How-ever, the labour, chemical and time intensive nature of these techniques limits the number of samples and treat-ments that can analysed. There is increasing demand from fruit physiologists and breeders for more rapid techniques that allow analysis of larger numbers of fruits so that more robust conclusions can be derived about the importance of cell size and packing in fruit quality.
In apple fruit, texture is a primary consumer preference, making this a principle target for apple fruit breeders and pomologists. Texture is a complex trait, determined by the interaction of many factors such as cell wall chemistry, cell size and shape, cell packing and cell turgor [8]. Cell size has been shown to be one of the critical components for textural differences in apple, with juiciness being associ-ated with larger cells [9,10]. Microscopy studies of bite action have shown that high levels of juiciness are achieved when cells are broken open, whereas when the fracture occurs between cells low levels of juiciness are found [11]. Apples have an extensive breeding history which has lead to the availability of many of cultivars dis-playing a wide range of fruit characters for size and tex-ture.
Apple fruit flesh or cortex comprises of homogeneous parenchyma-type cells. There is a variation of cell sizes across the apple fruit with cells under the skin being smaller (70 uM), increasing in size (to approx 250 uM) towards the centre of the flesh [12,13]. Towards the inner cortex, the apple cells become more elongated, spreading out in a radial pattern, lying alongside air gaps [14]. Growth within the apple fruit varies according to position, with more rapid growth occurring at the calyx than at the stalk [15]. Growth in apple fruit is achieved through a combination of cell division and cell expansion and, unlike other fruit, enlargement of air gaps between cells [16,17]. Apple fruit continue to increase in size right up to harvest, albeit at a reduced rate once maturity has been reached [12,18]. Fruit size can be altered by crop load or environmental effects, and results from changes in both number and size of cells [19]. While there can be a consid-erable range of cell size within a cultivar, cell size is also genetically determined with apples like 'Bramley's Seed-ling' having particularly large cells [13,18,20].
One of the main issues with measuring cell size using fix-ing and sectionfix-ing is that often the cells are not spherical, and so the plane of sectioning will determine the size measurement. Additionally, there is no guarantee that you are viewing from the widest point of the cell. One solution to address this is to separate the individual cells of the tis-sue. The intercellular adhesion of plant cells is dependent on pectin, which is the major constituent of the middle lamella and, to a lesser extent, also found in plant cell walls, [21]. Pectinate polysaccharides are complex carbo-hydrates that consist of a backbone of 1,4 linked alpha-galacturonic acid subunits otherwise known as homoga-lacturonan, with occasionally 1,2 linked rhamnose subu-nits. The rhamnogalacturonan I facilitate the linkage of neutral sugar side chains, consisting of arabinans, galactans and arabinogalactans, which give pectin its adhesive properties by allowing pectin to bond with vari-ous other cell wall components. The strength of binding between the side chains of the pectic acid backbone is dependent on the presence of calcium and magnesium, which are involved in the cross-linking of pectic polymers. These cofactors fortify the adhesive properties of the pectic substances. Initially cell separation was achieved by treat-ing the tissue with solutions containtreat-ing chromic acid [22], or combinations of chromic acid and nitric acid [7]. This was later modified to use cell wall digesting enzymes [1,23,24]. The use of enzymes to separate cells has tradi-tionally been associated with long incubation periods (12
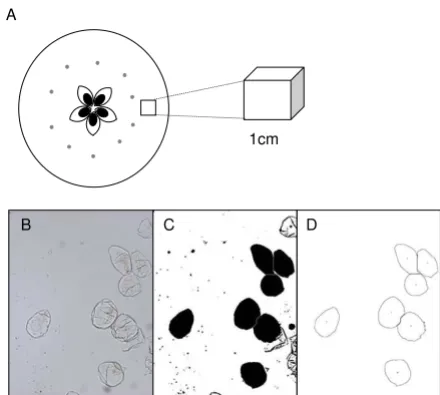
Cell isolation and image analysis of the individual apple cells using the ImageJ software package
Figure 1
Cell isolation and image analysis of the individual apple cells using the ImageJ software package. Apple sampling location (A). Analysis steps of isolated cells (B-D), isolated cell images (B) are converted to binary and filled (C), after using a size threshold of 1100 pixels only the large intact cells are selected (D).
B C D
A
to 48 hours) increasing the possibility of cell shape changes as the pectins are digested and/or changes in tur-gor.
In apples, cell size is not only determined genetically, but also by environment, crop load and maturity. Due to this complexity there is a need to assay a large number of apples to tease out the genetic component of size. We aimed to develop a more rapid, method to measure cell size using isolated cells. To separate the cells, we used Na2CO3 which is known to solubilise pectins [25]. We uti-lised this method to measure cell size and shape in differ-ent apple cultivars with known differences in texture to establish whether cultivar related differences could be observed using this technique. Finally we tested this method against other fleshy fruit to assess its utility as a more general cell isolation method.
Results and discussion
Isolation of single cellsCortex wedges from a 1 cm thick equatorial slice of apple
the small cells found near the skin, a block of approxi-mately 1 cm3 of cells from the central cortex were selected
(figure 1A). To reduce the number of damaged cells from the initial cut approximately 0.1 cm of tissue was trimmed from each surface of each wedge using a fine edged scalpel blade. The resulting cortex tissue was then cubed into approximately 2 mm3 tissue blocks with the fine edge
scal-pel. Single cell isolation was achieved in small 50 ml glass beakers using 40 ml of 0.05 M Na2CO3 in 0.3 M mannitol. Mannitol was used to osmotically buffer the apple cells in their physiologically normal osmotic range [11]. To delo-calise gases present in the air gaps and to aid separation, the cubes were gently boiled on a magnetic hot-plate stir-rer (180 rpm) for 20–30 minutes stirring with a 2 cm mag-netic stirrer, the heat was then reduced until boiling stopped and the tissue was stirred until free cells could be observed in the solution (a cloudy appearance). Residual cellular clumps of vascular bundles and unseparated cells were removed by passing through a 1 mm mesh sieve into a 50 ml falcon tube. These clumps typically represented 10 to 20% of the volume of chopped apple pieces. The
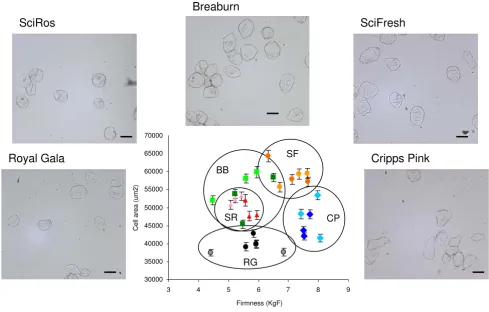
sepa-Comparison of isolated cells from different apple cultivars
Figure 2
Comparison of isolated cells from different apple cultivars. Average size of cells compared to adjacent penetrometer readings. Light tones represent tissue from sun side, darker tones represent shade tissue. Black – (RG) 'Royal Gala', blue – (CP) 'Cripps Pink/Pink Lady™', red – (SR) 'SciFresh/Pacific Rose™', green – (BB) 'Braeburn', orange – (SF) 'Scifresh/Jazz™'. A Repre-sentative image of isolated cells from each of the cultivars is presented. Bars represent 200 μM.
SciRos
Royal Gala
Breaburn
SciFresh
Cripps Pink
RG
CP SF
BB
SR
30000 35000 40000 45000 50000 55000 60000 65000 70000
3 4 5 6 7 8 9
Firmness (KgF)
Ce
excess supernatant was removed leaving an equal amount of liquid as settled cells. At this point the cell homogenate could be stored at 4°C before imaging. Utilising a chemi-cal rather than an enzymic treatment allowed the use of boiling to speed up cell separation, greatly reducing the time used in other tissue maceration methods [1,7,23,24].
Prior to microscopic imaging, harvested cell preparations were re-suspended by gentle flicking of the tube, 30 ul aliquots of suspended tissue were spotted onto clean glass microscopy slides and viewed at 4× under bright field with contrast maximised. Images were collected in a grid like manner to reduce biased selection of cells, using a CoolSnap digital camera and captured using RSImage software, version 1.9.2 (Roper Scientific Ltd, Tucson, Ari-zona). Images were saved as 24 bit Tiff files.
Analysis of cell size of different apple cultivars
The size of cells was analysed using the public domain ImageJ software package http://rsb.info.nih.gov/ij/. For each image an unadjusted image was kept open to check that measurement of cells were consistent with the raw image. The threshold was set so the outline of each cell was clearly differentiated from the background, and then each image was converted to binary (black and white). Each cell was then filled using "Fill holes". Where cells had not been completely separated then the "Watershed" separation was used to separate out the single cells from the clumps. Occasionally intact cells were not filled com-pletely due to small gaps in the outline. If this occurred then the gaps were manually filled and before proceeding
with the "Fill holes" again. Areas were calculated using "analyse particles" with a particle size cut-off threshold of 1100 pixels. A skeletonised image was obtained and visu-ally checked that the cells analysed were whole and single (Figure 1B–D).
It has previously been shown that in some cultivars the blush side (sun exposed) of apples are often firmer than the non blush side (shaded) [26]. To assess the differences between sun and shade sides of fruit and between fruit cultivars, the cell size of 5 common Malus × Domestica
Borkh. (apple) cultivars with different textures were meas-ured. Three similarly sized apples from standard industry cold stored conditions of 'Braeburn', 'Cripps Pink/Pink Lady'™, 'Scifresh/Jazz'™, 'SciRos/Pacific Rose'™ and 'Royal Gala' cultivars were measured for firmness on the sun and shade side using a penetrometer. For all apple cultivars there was no statistically significant difference in firmness between the sun and shade side (Table 1). There was how-ever, a statistically significant difference in firmness between cultivars, with 'SciFresh' and 'Pink Lady' being firmer than 'Royal Gala' and 'SciRos' (Table 1). Individual apple cells were isolated from each variety (Figure 2). For each apple cells were isolated from cortex tissue adjacent to the penetrometer wound site and approximately 170 individual cells were measured (Table 1, Figure 2). There was no correlation between cell size and firmness either within a cultivar or between cultivars. However it was noted that the firmer apples ('SciFresh' and 'Cripps Pink') had more angular cells compared to the softer cultivars 'SciRos' and 'Royal Gala' (Figure 2).
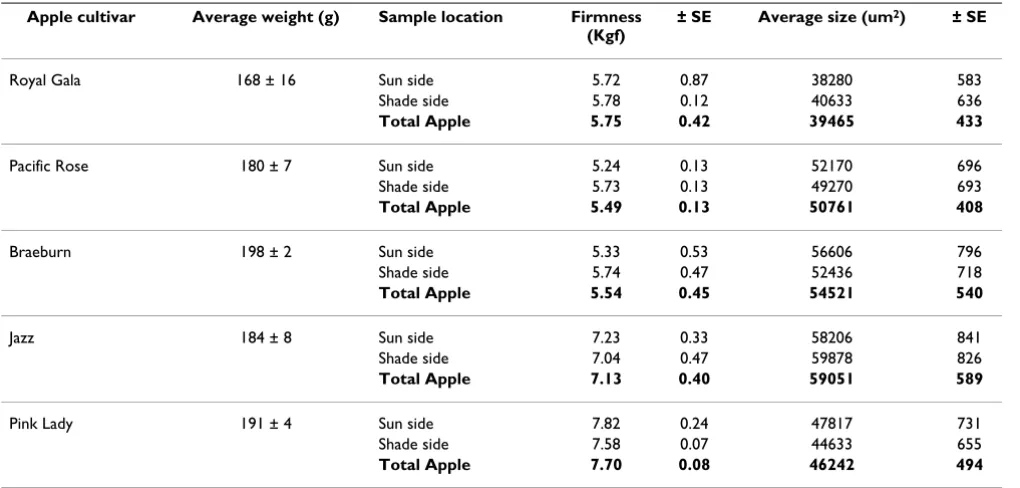
Table 1: Size of apple cells from different cultivars
Apple cultivar Average weight (g) Sample location Firmness (Kgf)
± SE Average size (um2) ± SE
Royal Gala 168 ± 16 Sun side 5.72 0.87 38280 583 Shade side 5.78 0.12 40633 636
Total Apple 5.75 0.42 39465 433
Pacific Rose 180 ± 7 Sun side 5.24 0.13 52170 696 Shade side 5.73 0.13 49270 693
Total Apple 5.49 0.13 50761 408
Braeburn 198 ± 2 Sun side 5.33 0.53 56606 796 Shade side 5.74 0.47 52436 718
Total Apple 5.54 0.45 54521 540
Jazz 184 ± 8 Sun side 7.23 0.33 58206 841
Shade side 7.04 0.47 59878 826
Total Apple 7.13 0.40 59051 589
Pink Lady 191 ± 4 Sun side 7.82 0.24 47817 731 Shade side 7.58 0.07 44633 655
To further investigate differences in cell size between cul-tivars, size measurements from each cultivar were com-bined and histograms of the distributions were plotted Figure 3. Using "rnorm" in the statistical software package "R", a normal distribution of cell sizes was calculated with the mean and standard deviation of sizes from each culti-var using a random generator of 10,000 points. This mod-elled distribution was plotted on the actual cell distribution and it was found that for all species a normal distribution of cell size occurred (Figure 3A–E). This implies that apples have only one population of cell types in the middle of the cortex tissue. The modelled normal distributions for each cultivar were compared and it was found that each apple cultivar showed a distinct distribu-tion of cell sizes (Figure 3F). The range of cell sizes observed for these cultivars were consistent with previous studies (e.g[19]) which have shown cells with a diameter in the range of 250 uM, assuming a circular area would produce approx 50,000 uM2 (Table 1).
Isolated Cells are representative of cells from untreated tissue
When separating cells there is a possibility that cell size and shape can be altered either mechanically or osmoti-cally. To investigate the difference in shapes observed in cells extracted from 'SciFresh' (more angular cells) and
'SciRos' (more rounded cells), these cultivars were chosen for confocal microscopic analysis. Blocks of tissue were taken from the equatorial regions of firm apples of 'Sci-Fresh' and 'SciRos' within 3 weeks of harvest. Each piece comprised a 5–6 mm thick cross-section extending from 5 mm to 15 mm from the fruit surface. Tissue was fixed in 20 g L-1 fresh formaldehyde, 25 g L-1 glutaraldehyde in 0.1
M sodium phosphate buffer pH7.2. A light vacuum was applied to remove as much air as possible from the tissue which was then stored at 4°C in the fixative. Samples for confocal microscopy were washed in 0.1 M sodium phos-phate buffer for 2–3 h (3 changes of buffer) and were then sectioned at 800 μm using a Vibratome 1000 (Technical Products International, St Louis Mo) and stained with 0.001 g L-1 acroflavin in 0.1 M buffer for 15 min, washed
3 times in phosphate buffer and mounted on slides with 800–900 μm deep chambers to prevent the coverslip com-pressing the tissue. Sections were viewed using an Olym-pus FV1000 confocal microscope (OlymOlym-pus Corporation, Tokyo, Japan). For each area imaged a stack of approxi-mately 50 individual images was taken at 6 μM intervals. These stacks were used to produce single z projection images. From these confocal images it is clear that the rounded and angularity morphologies seen in the 'SciRos' and 'SciFresh' isolated cells are consistent with the un-sep-arated tissue (Figure 4B, D). To identify any size changes that might have occurred during cell separation, the aver-age longest dimension of the 'SciRos' cells from the
con-Comparison of cellular morphology from two cultivars of apple flesh tissue, single cell extraction (A, C) and confocal microscopy of whole section (B, D)
Figure 4
Comparison of cellular morphology from two culti-vars of apple flesh tissue, single cell extraction (A, C) and confocal microscopy of whole section (B, D). (A, B) 'Scifresh/Jazz™') apples with more angular cells. (C, D) 'SciRos/Pacific Rose™') apples with rounder cells. Bars rep-resent 200 μM.
Histograms of combined cell size data (μM) from different cultivars minimum of 1000 cells
Figure 3
Histograms of combined cell size data (μM) from dif-ferent cultivars minimum of 1000 cells. For each a nor-mal distribution calculated on mean and standard deviation is overlaid. 'Royal gala' (A), 'SciRos/Pacific Rose™' (B), 'Cripps Pink/Pink Lady™' (C), 'SciFresh/Jazz™' (D), 'Braeburn' (E). Comparisons of each of the normal distributions from each of the cultivars (black- 'Royal Gala', blue- 'Pink Lady™', red- 'Pacific Rose™', green-'Braeburn', orange- 'Jazz™' (F).
Density
0 50000 150000 0 50000 100000
Density
0 50000 100000 0 50000 100000 150000
Density
0 50000 150000 -20000 20000 60000 100000
A B
C D
focal tissue section, and 'SciRos' isolated cells were measured. Cells in the confocal sections averaged 268.08
μM (± 50.3), compared to isolated cells that averaged 276.47 μM (± 46.55), demonstrating there was no signif-icant change in size during extraction.
Cell separation is achieved in other fleshy fruit
To test whether this method could be used in other plant tissue, we assessed fleshy tissue from unripe fruit pur-chased from the local supermarket, including green mature/breaker stage tomato (Solanum lycopersicum) (Outer pericarp including skin) (Figure 5A), ripe rock melon (Cucumis melo CV cantalupensis) (rind extending into flesh tissue) (figure 5B), and mature unripe kiwifruit (Actinidea deliciosa) (outer pericarp, inner pericarp and core tissue extracted separately) (figure 5D–F). Addition-ally, cortex tissue from immature apple fruit was also tested (approximately 80 DAFB) (figure 5C). It was found that all these showed a good cell separation of flesh tissue: the tomato skin and the rind tissue of the water melon did not separate into individual cells. However, the core tissue from kiwifruit broke down rapidly into individual cells. The immature apples also showed rapid cell disassocia-tion, suggesting cellular linkages are less well formed in rapidly growing fruit. Unlike the apple cells which are fairly homogeneous in morphology, kiwifruit have been
previously documented as having a range of cell types in the fruit [27], with the outer pericarp having large cells and small cells, the inner pericarp having long thin cells and idioblasts (cells containing crystalline oxylate) and the core having regular smaller cells [27]. All these classes of cells were observed (Figure 5) suggesting that this method did not exclude certain cell types.
Conclusion
Here we have shown a robust simple method of isolating single cells from fleshy fruit. Once single cells have been isolated we used a freeware software to measure cell size. In this study we found no correlation between cell size and firmness either within a cultivar, or across cultivars. Interestingly cultivars with more angular cells ('SciFresh' and 'Cripps Pink') have a firmer flesh. From the confocal microscopy images the 'Scifresh' flesh appears to have a higher cell density and therefore greater cell-to-cell con-tact compared to the 'SciRos' apples. This is consistent with previous findings with firm fleshed 'Granny Smith' apples having more densely packed cells compared to the rounder cells of softer fleshed 'Rubinette' apples [28]. Whether other textural traits, such as juiciness, that has previously been associated with large cells [9] can be linked to cell size in these cultivars is yet to be established. The method presented here would greatly facilitate such
Cell extractions from other fleshy fruit
Figure 5
Cell extractions from other fleshy fruit. Tomato flesh cells (A), Rock melon flesh cells (B), Immature 'Royal Gala' apple cells (C), Kiwifruit cells (D-F) (D cells from core tissue, E cells from inner pericarp tissue and F cells from outer pericarp tis-sue). Kiwifruit cells have been marked showing (i) idioblasts, (s) sac cells, (b) big cells and (l) little cells. Bars represent 200 μM.
A
B
C
D
E
F
i
i
b
Publish with BioMed Central and every scientist can read your work free of charge "BioMed Central will be the most significant development for disseminating the results of biomedical researc h in our lifetime."
Sir Paul Nurse, Cancer Research UK
Your research papers will be:
available free of charge to the entire biomedical community
peer reviewed and published immediately upon acceptance
cited in PubMed and archived on PubMed Central
yours — you keep the copyright
Submit your manuscript here: BioMedcentral comparisons, and allow greater numbers of fruit to be
analysed to understand the impacts of orchard and stor-age factors on fruit morphology.
Competing interests
The authors declare that they have no competing interests.
Authors' contributions
PAM carried out the lab work, ICH Helped with the microscopy and image analysis, JWJ and RJS conceived of the project and oversaw the research. All authors read and approved the final manuscript.
Acknowledgements
The authors would like to thank Marcus Davy for statistical advice, Ros-witha Schröder for cell wall-related advice, Jacqui Ross for help with the confocal microscope, Erika Varkonyi-Gasic, Sol Green for critically reading the manuscript and FRST (NZ) contract C06X0705 for funding the pro-gramme.
References
1. Bertin N, Gautier H, Roche C: Number of cells in tomato fruit depending on fruit position and source-sink balance during plant development. Plant Growth Regulation 2002, 36(2):105-112. 2. Harada T, Kurahashi W, Yanai M, Wakasa Y, Satoh T: Involvement of cell proliferation and cell enlargement in increasing the fruit size of Malus species. Scientia Horticulturae 2005,
105(4):447-456.
3. Olmstead JW, Lezzoni AF, Whiting MD: Genotypic differences in sweet cherry fruit size are primarily a function of cell number. Journal of the American Society for Horticultural Science 2007,
132(5):697-703.
4. Yamaguchi M, Sato I, Takase K, Watanabe A, Ishiguro M: Differences and yearly variation in number and size of mesocarp cells in sweet cherry (Prunus avium L.) cultivars and related species.
Journal of the Japanese Society for Horticultural Science 2004,
73(1):12-18.
5. Hamada K, Hasegawa K, Kitajima A, Ogata T: The relationship between fruit size and cell division and enlargement in culti-vated and wild persimmons. Journal of Horticultural Science & Bio-technology 2008, 83(2):218-222.
6. Quilot B, Genard M: Is competition between mesocarp cells of peach fruits affected by the percentage of wild species genome? Journal of Plant Research 2008, 121(1):55-63.
7. Jullien A, Munier-Jolain NG, Malezieux E, Chillet M, Ney B: Effect of pulp cell number and assimilate availability on dry matter accumulation rate in a banana fruit [Musa sp AAA group 'Grande Naine' (Cavendish subgroup)]. Annals of Botany 2001,
88(2):321-330.
8. Harker FR, Stec MGH, Hallett IC, Bennett CL: Texture of paren-chymatous plant tissue: A comparison between tensile and other instrumental and sensory measurements of tissue strength and juiciness. Postharvest Biology and Technology 1997,
11(2):63-72.
9. Allan-Wojtas P, Sanford KA, McRae KB, Carbyn S: An integrated microstructural and sensory approach to describe apple tex-ture. Journal of the American Society for Horticultural Science 2003,
128(3):381-390.
10. Mann H, Bedford D, Luby J, Vickers Z, Tong C: Relationship of instrumental and sensory texture measurements of fresh and stored apples to cell number and size. Hortscience 2005,
40(6):1815-1820.
11. Harker FR, Hallett IC: Physiological-Changes Associated with Development of Mealiness of Apple Fruit During Cool Stor-age. Hortscience 1992, 27(12):1291-1294.
12. Bain JM, Robertson RN: The physiology of growth in apple fruits. 1 Cell size, cell number and fruit development. Austral-ian Journal of Scientific Research 1951, B4:75-91.
13. Reeve RM: Histological investigations of texture in apples. II Structure and intercellular spaces. Food Research 1953,
18:604-617.
14. Khan AA, Vincent JFV: Anisotropy af apple parenchyma. Journal of the Science of Food and Agriculture 1990, 52:455-466.
15. Skene DS: The distribution of growth and cell division in the fruit of Cox's Orange Pippin. Annals of Botany 1966, 30:493-512. 16. Drazeta L, Lang A, Hall AJ, Volz RK, Jameson PE: Air volume meas-urement of 'Braeburn' apple fruit. Journal of Experimental Botany
2004, 55(399):1061-1069.
17. Verboven P, Kerckhofs G, Mebatsion HK, Ho QT, Temst K, Wevers M, Cloetens P, Nicolai BM: Three-dimensional gas exchange pathways in pome fruit characterized by synchrotron x-ray computed tomography. Plant Physiology 2008, 147(2):518-527. 18. Tukey HB, Young JO: Gross morphology and histology of
devel-oping fruit of the apple. Botanical Gazette 1942, 104:3-25. 19. Smith WH: Cell-multiplication and cell-enlargement in the
development of the flesh of the apple fruit. Annals of Botany
1950, 16(53):23-38.
20. Smith WH: The histological structure of the flesh of the apple in relation to growth and senescence. The Journal of Pomology and Horticultural Science 1940, 18:249-260.
21. Somerville C, Bauer S, Brininstool G, Facette M, Hamann T, Milne J, Osborne E, Paredez A, Persson S, Raab T, Vorwerk S, Youngs H:
Toward a systems approach to understanding plant-cell walls. Science 2004, 306(5705):2206-2211.
22. Brown R, Rickless P: A new method for the study of cell division and cell extension with some preliminary observations on the effect of temperature and nutrients. Proceedings of the Royal Society of London B 1949, 136:110-125.
23. Bohner J, Bangerth F: Effects of Fruit-Set Sequence and Defoli-ation on Cell Number, Cell-Size and Hormone Levels of Tomato Fruits (Lycopersicon-Esculentum Mill) within a Truss. Plant Growth Regulation 1988, 7(3):141-155.
24. Bunger-Kibler S, Bangerth F: Relationship between cell number, cell size and fruit size of seeded fruits of tomato ( Lycopersi-con seculentum Mill.), and those induced parthernocarpically by the application of plant growth regulators. Plant Growth Reg-ulation 1982, 1:143-154.
25. Jarvis MC, Hall MA, Threlfall DR, Friend J: The polysaccharide structure of potato cell walls: Chemical fractionation. Planta
1981, 152(2):93-100.
26. Blanpied GD, Bramlage WJ, Dewey DH, LaBell RL, Massey LM, Mattus GE, Stiles WC, Watada AE: A standardized method for collect-ing apple pressure test data. New York Food Life Science Bulletin
1978, 74:1-8.
27. Hallett IC, Macrae EA, Wegrzyn TF: Changes in Kiwifruit Cell-Wall Ultrastructure and Cell Packing During Postharvest Ripening. International Journal of Plant Sciences 1992, 153(1):49-60. 28. Lapsley KG, Escher FE, Hoehn E: The Cellular Structure of