R E S E A R C H
Open Access
Optimization of magnetic flux density for fast
MREIT conductivity imaging using multi-echo
interleaved partial fourier acquisitions
Munish Chauhan
1, Woo Chul Jeong
1, Hyung Joong Kim
1*, Oh In Kwon
2and Eung Je Woo
1*Correspondence: [email protected] 1Department of Biomedical Engineering, Kyung Hee University, Yongin, Korea
Full list of author information is available at the end of the article
Abstract
Background: Magnetic resonance electrical impedance tomography (MREIT) has been introduced as a non-invasive method for visualizing the internal conductivity and/or current density of an electrically conductive object by externally injected currents. The injected current through a pair of surface electrodes induces a magnetic flux density distribution inside the imaging object, which results in additional magnetic flux density. To measure the magnetic flux density signal in MREIT, the phase difference approach in an interleaved encoding scheme cancels out the systematic artifacts accumulated in phase signals and also reduces the random noise effect by doubling the measured magnetic flux density signal. For practical applications ofin vivoMREIT, it is essential to reduce the scan duration maintaining spatial-resolution and sufficient contrast. In this paper, we optimize the magnetic flux density by using a fast gradient multi-echo MR pulse sequence. To recover the one component of magnetic flux densityBz, we use a coupled partial Fourier acquisitions in the interleaved sense. Methods: To prove the proposed algorithm, we performed numerical simulations using a two-dimensional finite-element model. For a real experiment, we designed a phantom filled with a calibrated saline solution and located a rubber balloon inside the phantom. The rubber balloon was inflated by injecting the same saline solution during the MREIT imaging. We used the multi-echo fast low angle shot (FLASH) MR pulse sequence for MRI scan, which allows the reduction of measuring time without a substantial loss in image quality.
Results: Under the assumption ofa prioriphase artifact map from a reference scan, we rigorously investigated the convergence ratio of the proposed method, which was closely related with the number of measured phase encode set and the frequency range of the background field inhomogeneity. In the phantom experiment with a partial Fourier acquisition, the total scan time was less than 6 seconds to measure the magnetic flux densityBzdata with 128×128 spacial matrix size, where it required 10.24 seconds to fill the completek-space region.
Conclusion: Numerical simulation and experimental results demonstrated that the proposed method reduces the scanning time and provides the recoveredBzdata comparable to what we obtained by measuring completek-space data.
Keywords: MREIT, MRI, Interleaved partial fourier acquisition, Magnetic flux density, Current density
Background
Magnetic resonance electrical impedance tomography (MREIT) utilizes a magnetic
res-onance imaging (MRI) scanner to measure magnetic flux density Bz data inside an
imaging object induced by the externally injected current. The internal current density distribution has been studied in magnetic resonance current density imaging (MRCDI)
by measuring the whole magnetic flux density data B = (Bx,By,Bz) [1,2].
Combin-ing MRCDI and electrical impedance tomography (EIT) technique, MREIT provides the cross-sectional conductivity images of the object with high spatial resolution [3-10]. Since
an MRI scanner measures only one componentBz of Bwithout rotating the imaging
object, most MREIT algorithms assumed that the internal conductivity is isotropic and focused on visualizing its distribution by using one component of the magnetic flux density dataBzofB[11-18].
Recent MREIT imaging techniques have been developed with respect to both the capac-ity of measurement techniques and the numerical reconstruction algorithms.
Experimen-tal results fromin vivoanimal and human have been reported [19,20] in MREIT. As an
innovation of current MREIT, a fast MREIT imaging technique referring to the continu-ous monitoring of objects includes varicontinu-ous wide application areas [21]. Recently, one of challenging problem in MREIT is to implement a new imaging technique with a very short acquisition time for the imaging of neural activities of brain related to the conductivity change.
Since current MREIT experiments suffer from poor SNR of the measured Bz data
under the typical data acquisition durations and a small amount of injected current, it is important to reduce the scan time, while maintaining the spatial-resolution and
suf-ficient contrast, for practical implementations ofin vivoMREIT. Recently, to reduce the
scan time in MREIT, Hamamuraet al[22] reconstructed the interior conductivity using
a single-shot spin-echo echo planar imaging (SS-SEPI) pulse sequence and Muftuleret al
[23] used a SENSE-accelerated imaging technique to acquire phase signal by the injected current. One of basic approaches for maintaining the spatial resolution is to reduce the number of phase encoding steps because each phase encoding step requires a certain amount of time for execution. Since the MREIT techniques use an interleaved phase
encoding acquisition scheme to double theBz signal, Parket al[24] reconstructed the
phase signalBzby filling the skippedk-space region using the interleaved measurement
property.
To obtain the static conductivity image in MREIT [19,20], a spin-echo based MREIT pulse sequence has been predominantly used to reduce the background artifact and to increase the imaging quality. In real situations, it is difficult to employ the fast
con-ventional MR pulse sequences because the noise standard deviation ofBz is inversely
proportional to the width of injection current and the intensity of MR magnitude, simul-taneously. An MREIT pulse sequence should be devised to enhance changes in MR phase images for given current amplitudes.
long scanning duration [7,11]. To reduce the scanning time, we adopt a partial phase encoding acquisition scheme using the multi-echo FLASH MREIT pulse sequence and rigorously investigate the relationship between the convergence ratio of the algorithm and
the background field inhomogeneity [24]. We consider the discrete2-norm to evaluate
the convergence ratio.
To show the feasibility of the proposed algorithm, we performed numerical simulations
and compared the performance to the simulated trueBzdata. We designed a cylindrical
acrylic phantom filled with a calibrated saline solution and located a rubber balloon inside the phantom. The rubber balloon was inflated by injecting the same saline solution during the scan. The phantom was designed to provide a homogeneous magnitude image, but
distinguishable signals of measuredBzbetween the inside and outside the balloon. The
phantom experiment demonstrated that the proposed method reduces the scanning time
and recovers the reasonable resolution ofBz, which is comparable to the recoveredBz
using the completek-space data.
Method
k-space signal andBzdata
In a conventional spin echo MREIT pulse sequence, both positive and negative currents of the same amplitude and duration are injected with reverse polarity. These injection
currents with the pulse width ofTcaccumulate extra phases. Correspondingk-space MR
signals can be described as
S±(kx,ky)=
ρ(x,y)eiδ(x,y)e±iγBz(x,y)Tcei2π(kxx+kyy)dxdy (1)
whereρis theT2weighted spin density,δis any systematic phase artifact, andis a field-of-view (FOV). Here, the superscript ofS±(kx,ky)denotes a brief notation forS+(kx,ky) andS−(kx,ky). For the standard coverage ofk-space, we set
⎧ ⎨ ⎩
kx = 2γπGx(nt−TE) for n= −Nx/2,· · ·,Nx/2−1
ky = 2γπmGyTpe for m= −Ny/2,· · ·,Ny/2−1
(2)
whereγ = 26.75×10⁷rad/T·s is the gyromagnetic ratio of hydrogen,t is the time
between samplings,Gxis the frequency encoding gradient strength,TEis the echo time,
Gyis the phase encoding step, andTpeis the phase encoding time. The induced
mag-netic flux density ±Bz is generated by the positive and negative injection currentsI±.
Applying the inverse Fourier transform to the measuredk-space data sets in (1), we can
compute the magnetic flux densityBzas
Bz(r)= 1 2γTc
tan−1
α(r) β(r)
(3)
whereα andβ are the imaginary and real part ofρeiδeiγBzTc /ρeiδe−iγBzTc ,
respec-tively [2].
The current MREIT method is based on the electromagnetic information embedded in
the measuredBzdata in order to visualize the conductivity(or current density) based on
Biot-Savart law:
Bz(r)= μ0 4π
(y−y)Jx(r)−(x−x)Jy(r) |r−r|3 dr
whereμ0 = 4π10−7Tm/A is the magnetic permeability of the free space. The current
densityJinis given for the isotropic conductivityσin
J(r)= −σ∇u(r) (5)
and satisfies the following elliptic equation
∇ ·(σ∇u) = 0 in
−σ∇u·ν = g on ∂ and ∂u ds=0
(6)
whereνis the outward unit normal vector on∂andgis an applied current density on
the surface.
Recovery of complexT2∗weighted spin density using interleaved partial Fourier acquisition
To simplify, we develop a theory using a conventional cartesiank-space that has three
zones within theky(phase-encode) domain; the central region (P0), the positive region
(P+) and the negative region (P−):
⎧ ⎪ ⎪ ⎪ ⎪ ⎨ ⎪ ⎪ ⎪ ⎪ ⎩
P0 = {(k
x,ky) ky= 2γπmGyTpe, −Nc≤m≤Nc}
P+ = {(k
x,ky) ky= 2γπmGyTpe, m>Nc}
P− = {(k
x,ky) ky= 2γπmGyTpe, m<−Nc}
(7)
Here, Nc denotes the number of partial Fourier over-sampling phase-encodes. The
interleaved k-space data S+p(kx,ky) and Sp−(kx,ky) as partially acquired for the phase
ky= 2γπmGyTpecan be expressed
Sp±(kx,ky) = ⎧ ⎨ ⎩
S±(kx,ky), (kx,ky)∈P+∪P0
0, (kx,ky)∈P−
(8)
whereS±p representsS+p andS−p simultaneously. We propose an algorithm to determine
theT2∗weighted spin densityρ:
ρ±(r):=ρ(r)eiδ(r)e±iγBz(r)Tc=FT−1(S±(k
x,ky))(r) (9)
using the partially scannedk-space dataSp±.
The systematic phase artifacteiδ(x,y), unavoidable artifacts due to the main field inho-mogeneity and the mismatch between the center of data acquisition interval and echo formation, arises from a low frequency field, which mainly belongs to the central region
P0. Including a small perturbed phase artifacteiδ(x,y), we start with the initial guessS± p
and design an alternating procedure by updating the skippedk-space regions.
The recoveredρ±p =FT−1(S±p)can be formally expressed by the equation
ρp±(r) = FT−1(S±(kx,ky))(r)+FTP−−1(Sp±(kx,ky))(r)−FTP−1−(S±(kx,ky))(r)
= ρ±(r)+Ep±(r)
(10)
whereFTP−−1(S±p(kx,ky))denotes the inverse Fourier transform by zero-filling thek-space except in the regionP−and the remainder termE±p is
Ep±(r):=FTP−1−
S±p(kx,ky)−S±(kx,ky)
Let us define a support regionDδ for a low spatially varying magnetic field due to background field inhomogeneities:
Dδ:= {(kx,ky)|FT(e−iδ)(kx,ky)=0, ky= γ
2πmGyTpe, −Nδ≤m≤Nδ} (12)
Observation 1.IfDδ ⊂ P0, FT(ρp∓e−2iδ)(kx,ky) = FT(ρ∓e−2iδ)(kx,ky)for(kx,ky) ∈
P+.
The proof of observation 1 is provided in the Appendix A. By using the observation 1, we fill the skippedk-space regions inS±p
S±u(kx,ky) = ⎧ ⎨ ⎩
S±(kx,ky), (kx,ky)∈P+∪P0
FT(ρp∓e−2iδ)(−kx,−ky), (kx,ky)∈P−
(13)
Observation 2.IfDδ ⊂ P0, the k-space S±u in recovers the T2(or T2∗) weighted spin
densityρ±without loss of information.
FT−1(Su±)=ρ±=ρeiδe±iγBz(x,y)Tc
The proof of observation 2 is provided in the Appendix B. The observation 2 shows that
the skipped region in the measuredk-spaceS+can be recovered by using the interleaved
acquiredS−and the estimated background sensitivity map.
Convergence characteristics
When the common measuredP0does not cover the support regionDδ,Nδ>Nc, for the
phase-encode(kx,ky)∈P+, the Fourier transform ofρp−e−2iδcan be written by following the observation 1:
FT(ρp−e−2iδ)(kx,ky)=
(kx,km)∈P+∪P0
FT(ρ−)(kx,km)FT(e−2iδ)(kx,ky−km) (14)
From the relation (14), for the phase-encode(kx,ky)∈P+, we have
FT(ρ−e−2iδ)(k
x,ky)−FT(ρp−e−2iδ)(kx,ky)
=(kx,km)∈P−FT(ρ −)(k
x,km)FT(e−2iδ)(kx,ky−km)
(15)
We set
[ψ]R:=FT−1(FT(ψ )|R) (16)
whereRis a subregion of thek-space andFT(ψ )|R denotes the restriction of FT(ψ )
to the regionR. The discrete 2-norm of [ψ]R is equivalent to that ofFT(ψ )|R,i.e.,
[ψ]R2 =CFT(ψ )|R2, where the constantCis independent to the functionψand
When the skippedk-space region, P−, are filled the previously updated as in (13), we have
(ρ−−ρn−)
2 = CFT(ρ −−ρ−
n)2
= CFT(ρ−−ρn−)|P−2
= C
FT(ρ+e−2iδ)−FT(ρ+ n−1e−2iδ)
|P−(−kx,−ky) 2 = CFT(ρ+e−2iδ)−FT(ρ+
n−1e−2iδ) |P+(kx,ky)2
= CFT((ρ+−ρn+−1)e−2iδ) |P+(kx,ky)2
(17)
For thek-space region(kx,ky)∈P+, we have the following identity
FT(ρ+−ρn+−1)e−2iδ) |
P+(kx,ky)
=(kx,km)∈P−FT(ρ +−ρ+
n−1)(kx,km)FT(e−2iδ)(kx,ky−km)
+(ρ+−ρn+−1,P0∪P+)
(18)
where
(ρ+−ρn+−1,P0∪P+):=
(kx,km)∈P0∪P+
FT(ρ+−ρn+−1)(kx,km)FT(e−2iδ)(kx,ky−km).
Since the updated complex densityFT(ρn±)|P+∪P0 =FT(ρ±)|P+∪P0, the remainder term (ρ+−ρn+−1,P0∪P+) = 0. Thus, the discrete2-norm of the difference between the
true and the iteratively updatedT2∗weighted spin density can be estimated
FT((ρ+−ρn+−1)e−2iδ) |
P+2
2 ≤ FT((ρ+−ρn+−1)|P−2
2
ky∈P+
(kx,km)∈P−|FT(e −2iδ)(k
x,ky−km)|2 (19)
Detailed estimates of2-norm calculation are presented in the Appendix C.
Define an estimator for the convergence of the proposed algorithm
Z2δ,P± := ky∈P+
⎡
⎣
(kx,km)∈P−
FT(e−2iδ)(kx,ky−km) 2
⎤
⎦ (20)
Using the same procedures of (17) and (19), we have
FT((ρ+−ρn+−1)|P−2
2 =
FT((ρ−−ρn−−2)e−2iδ) |P+(kx,ky)2
≤ Z2δ,P±FT((ρ−−ρn−−2)|P−2
2
(21)
The relations (17), (19) and (21) show that the convergence of the proposed method depends on the estimatorZ2δ,P±:
(ρ−−ρn−)2 ≤Z2δ,P±(ρ−−ρ −
n−2)2 (22)
Optimization ofBzusing gradient multi-echo data
Since the noise standard deviationsBz of the measuredBz is inversely proportional to
injection current durationTcand the SNR of MR magnitude imageϒM[25,26] as
sBz(r)=
1
√
2TcϒM(r)
(23)
To reduce the noise level ofBzand the imaging time, we applied the proposed method
by using the gradient multi-echo, it is possible to inject the current for a long duration to maximize the off-resonance phase.
WhenTE1 denotes the first echo time and TE is the echo spacing, the m-th echo
time isTEm = TE1 +(m−1)TE, m = 1,· · ·,NE, whereNE is the echo number. The
phase artifactδTEm depends on the echo timeTEm. Usinga prioriestimation of the phase
artifact mapδTEm from a reference scan, for a time varying functional MREIT technique,
the measuredk-space region includingP0andP+can be determined by taking account
of the imaging multi-echo timesTEm, the echo numberNEand the repetition timeTR.
The recovered multipleT2∗-weighted complex densitiesρT±
Em, m=1,· · ·,NE, using the
proposed algorithm in each echo timeTEmcan be optimized to generate a representative
measuredBmz data
Bmz(r)= 1
2γTc tan−1
αm(r) βm(r)
(24)
where αm and βm are the imaginary and real parts of ρT+
Em/ρ −
TEm, respectively. The
recovered multipleBmz data include pixel-by-pixel different noise level depending on the
different imaging timeTEmand the width of injection current. The multiple measuredBmz
data are optimally combined to reduce the noise level ofBz[27]:
Bz(r)= NE
m=1
ωm(r)Bmz(r) (25)
where the point-wise weighting factorωm(r)is given as
ωm(r)= 1/(sBmz(r))
2 NE
k=11/(sBkz(r))
2 (26)
Now, we setup an algorithm to reconstruct the magnetic flux densityBzdata using the
partially measuredk-space dataS±p and involving the following steps:
1. Take an initial guessρ0±=FT−1(S±| P0∪P+).
2. Transform then-th updatedρn±e−2iδtok -space by taking the Fourier transform. 3. Update the measuredk -space dataS±n+1by filling the skipped region inSp±with the
transformedFT(ρn±e−2iδ)data.
4. Updateρ±n+1by taking the two-dimensional inverse Fourier transform.
5. Stop ifρ ± n+1−ρn±
ρ±n ≤where >0is a given tolerance and·is a standard
L2-norm in. Otherwise, repeat the process.
6. ReconstructBmz using (24) form=1, 2,· · ·,NE.
7. Determine a weighting factor mapωm, m=1, 2,· · ·,NEusing (26) and
reconstruct an optimally weightedBzin (25).
Experimental setup
Numerical simulation setup
To validate the proposed algorithm, we performed numerical simulations with the
two-dimensional finite-element model of a object 20×20 cm2with 256×256 rectangular
elements and with the origin at its bottom-left, shown in Figure 1. We added the different complex field inhomogeneity artifacts to the simulated spin density image in Figure 1(a).
The target magnetic flux densityBzin Figure 1(b) was generated by solving the elliptic
(a)
-1E-7 1E-7
(b) (c)
[Tesla]
0 100
200
(d)
0 0
1 2 3
Figure 1 Simulation setup.a)T2-weighted spin density,b)simulated magnetic flux densityBzimage,c)
intensity of|∇Bzimage,d)magnitude image of thek-space data on the measured region.
Bzin Figure 1(b) is continuous and has no abrupt changes, we used|∇Bz|image displayed in Figure 1(c) to enhance image for the magnetic flux density. Figure 1(d) shows a partially
measuredk-space data corresponding toρ+.
The target conductivity distributionσhad different anomalies with different
conductiv-ity values and the amount of injection current was 10 mA. Set an applied current densconductiv-ity
gon the surface as
g(x,y)= ⎧ ⎪ ⎪ ⎪ ⎨ ⎪ ⎪ ⎪ ⎩
10, if|y−5| ≤2, andx=0
−10, if|y−5| ≤2, andx=10
0, otherwise.
(27)
Phantom imaging experimental setup
For the practical application of the proposed method as a fast MREIT imaging, we designed a cylindrical phantom filled with the saline solution of conductivity 1 S/m (shown in Figure 2(a)), including a rubber balloon for the visualization of isotropic con-ductivity excluding other artifacts by any concentration gradient in the phantom. The inside of balloon was filled with the same saline solution and the volume of balloon was controlled by injecting saline solution during the imaging experiment. After positioning the phantom inside the bore of 3T MR scanner (Achieva TX, Philips Medical Systems,
Best, The Netherlands) with 8 channel RF coil, we collectedk-space data using the
gra-dient multi-echo injection current nonlinear encoding (ICNE) pulse sequence which was
(a) (b)
Electrode
originated from FALSH (Figure 2(b)). To obtain the MR magnitude and magnetic flux
density (Bz) images, it extends throughout the duration of injection current until the
end of a readout gradient [28]. Since the multi-echo ICNE pulse sequence was synchro-nized to the injection currents with alternating polarity, it enabled to maximize the width of the injection currents and minimize the noise standard deviation of the measured
Bzdata. The maximum amplitude of injection current was 5 mA and the total imaging
time was 10.24 second to fill thek-space in the interleaved sense. Since the total
imag-ing time was correspondimag-ing to the wholek-space scan, the actual imaging time would be
reduced to 5.52 and 5.92 seconds for the number of partial regionN(P0∪P+) = 69
and 74, respectively. The imaging parameters were followings: slice thickness 5 mm,
num-ber of imaging slices one, repetition time TR = 40 ms, echo spacing TE = 6 ms,
flip angle 40 degree, and multi-echo time TEm = 6 +(m− 1) ×6 ms for NE = 4.
The FOV was 160×160 mm2with a matrix size of 128×128. The duration of current
injectionTcm was almost same to the multi-echo timeTEm = 6+(m−1)×6, m =
1, 2, 3, 4, because the current was continuously injected until the end of the readout gradient.
Figure 3(a) shows the multiply acquired magnitude images |ρT+
Em|, m = 1,· · ·, 4,
where ρT+
Em was the m-th measured T
∗
2 weighted complex spin density, Figure 3(c)
and (e) show the measured magnetic flux densities Bmz and the absolute of ∇Bmz
images at each echo m=1,· · ·, 4, respectively. The slope of Bm
z reflecting the width
of injected current linearly increased as the multi-echo time TEm was increasing.
Figure 3(b), (d), and (f ) are the averaged images corresponding to Figure 3(a), (c), and (e), respectively.
(a)
(c)
1-st echo 2-nd echo 3-rd echo 4-th echo
1-st echo 2-nd echo 3-rd echo 4-th echo
20
0
1.8E-8
-1.8E-8 [Tesla] (b)
(d)
(e) (f)
1-st echo 2-nd echo 3-rd echo 4-th echo
Figure 3 Phantom imaging.a)T2∗-weighted magnitude images|ρ+T
Em|,m=1,· · ·, 4,b)averagedT
∗
2
weighted magnitude image| ¯ρ+|:=144m=1|ρ+T
Em|,c)measuredB
m
z images at each echom=1,· · ·, 4,d)
averagedBzimage,Bz:=414m=1Bmz,e)|∇Bmz|images at each echom=1,· · ·, 4,f)averaged|∇Bz|image,
Results
Simulation results
We compared the reconstructed magnetic flux density Bz using the complete k-space
data to the Bz achieved using the partial k-space data. To evaluate the convergence
characteristics of the proposed algorithm, we define the relative2-errors:
E(ψn):=
ψ−ψn
ψ (28)
whereψ andψnare the recovered images with the completek-space data and then-th
updated data using the partially measuredk-space data, respectively, and·denotes the
2-norm.
To investigate the estimatorZ2δ,P±for the convergence of the proposed iterative
algo-rithm to fill the sippedk-space region P−, we fixed the number of partially measured
k-space region asN(P0∪P+) = 138, i.e., N(P0) = 20 and N(P+) = 118, and
changed the frequency range of background field inhomogeneity. We generated
sev-eral background field inhomogeneities changing the phase frequency range in k-space
region by takingNδ =5, 10, 20, 30 where the background field inhomogeneityδsatisfies
FT(eiδ)(k
x,ky)=0 for|ky|>Nδ.
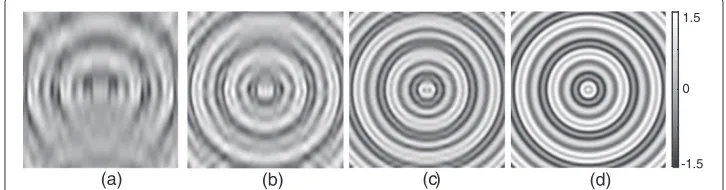
Figure 4(a)-(d) show the background field inhomogeneities used in the
reconstruc-tion procedure and Table 1 shows the estimated Z2δ,P± in each background field
inhomogeneity forNδ=5, 10, 20, and 30, respectively.
Figure 5(a) shows the reconstructed |∇Bz| images using the fixed background field
inhomogeneity withNδ=5. From the top-left to the bottom-right, each image was
corre-sponding to thej-th iterative updated|∇Bz|,j=0, 1,· · ·, 10. The recoveredBzusing the
partially measuredk-space data included a large amount of artifacts (the top-left image
in Figure 5(a)). However, since the value ofZ2δ,P±was small, the first updated magnetic flux density almost recovered the trueBz.
Figure 5(b) shows reconstructed|∇Bz|images using the fixed background field
inho-mogeneity with Nδ = 30 corresponding to Figure 5(a). Since the value ofZ2δ,P± was
0.7738, the convergence ratio ofρ±was relatively slow comparing to the field
inhomo-geneity withNδ = 5. Table 2 shows the relative discrete2-errors of updated complex
spin density for each iteration number and the convergence ratio ofρ±was depending on
the number ofNδ.
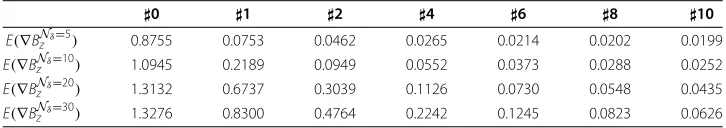
Table 3 shows the relative2-errors of reconstructed∇Bz for each iteration number
depending on the number ofNδ. The decay rates of the relative2-error were very fast
as the number ofNδwas small, but we needed relatively many iterations to approach the
(a) (b) (c)
0 1.5
(d)
-1.5
Table 1 Calculated estimatorZ2δ,P±in (20) forNδ=5, 10, 20, 30and fixed measured
k-space dataN(P0∪P+)=138
Nδ=5 Nδ=10 Nδ=20 Nδ=30
Z2δ,P± 0.0013 0.0749 0.4927 0.7738
required accuracy as the number ofNδwas increase, even though the update procedure
was rapidly computed by use of the fast Fourier transform.
Phantom experimental results
For the phantom experiment, we changed Nc = 5,· · ·, 10 for the set P0 to
investi-gate the convergence behavior with respect to a given background field inhomogeneity.
Using the collectedk-space data with 8 channel RF coil and the gradient multi-echo by
alternating readout gradient, we measured theT2∗weighted complex densitiesρm±n, n=
1,· · ·,NCH, m = 1,· · ·,NE, whereNCH = 8 denotes the coil number and NE = 4 is the echo number. Figure 6 shows the measured background field inhomogeneities
by displaying the real part of e2iδmn corresponding to the n-th coil and them-th echo
image. According to the increase of echo number, the accumulated background field inhomogeneity also increased.
Table 2 Relative2-errors of updated complex spin density for each iteration number()
0 1 2 4 6 8 10
E(ρNδ=5) 0.06291 0.00098 0.00044 0.00022 0.00021 0.00021 0.00021 E(ρNδ=10) 0.08992 0.00282 0.00104 0.00039 0.00024 0.00020 0.00020 E(ρNδ=20) 0.20801 0.03346 0.00706 0.00088 0.00043 0.00029 0.00023 E(ρNδ=30) 0.22640 0.04623 0.01451 0.00309 0.00090 0.00041 0.00028
Figure 7(a) and (c) show the measuredT2∗weighted magnitude and magnetic flux
den-sityBz images at the timeTEm, m = 1, 2, 3, 4, using partially acquiredk-space region P0∪P+withN
c=5 by a transversally injected current. Although the amount of
accu-mulated phase signal by the injected current increased as the echo time varied fromTE1
toTE4, the magnitude image at the 4-th echo was more deteriorated comparing to the
1-st echo case. Figure 7(b) shows an averaged MR magnitude image at each echo time and
Figure 7(d) is a weightedBzimage depending on the width of injected current using the
phase signal in Figure 7(c). Figure 7(e)-(h) shows the measured magnitude and magnetic
flux densityBzimages corresponding to Figure 7(a)-(d) using partially acquiredk-space
regionP0∪P+withN
c=10.
Comparing to the measured images in Figure 7(a)-(d), in contrast to the recovery of
low phase frequency information corresponding toP0, the increased background field
inhomogeneity caused relatively high frequency artifacts.
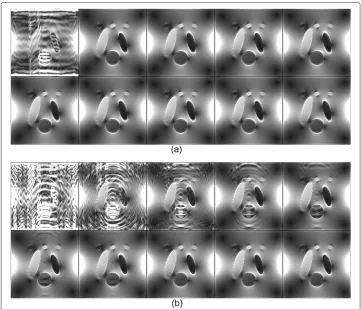
Figure 8(a)-(d) shows iteratively updated T2∗ weighted magnitude and magnetic flux
densityBzimages usingP0∪P+withNc=5. We fixed the update iteration number as 20
for all experiments. When we fixedNc=5, the 1-st and 2-nd recoveredT2∗weighted
com-plex densities in Figure 8(a) and (c) were relatively close to the recovered ones using the
completek-space data. However, as the phase artifact increased, the 3-rd and 4-th
recov-eredT2∗ weighted complex densities were deficient in reflecting full information ofBz
signal. Especially, the 4-th updated magnetic flux densityBzimage shows some defective
region due to the insufficient recovery ofT2∗weighted complex density.
Figure 8(e)-(f ) shows iteratively updated T2∗ weighted magnitude and magnetic flux
densityBzimages corresponding to Figure 8(a)-(d) usingP0∪P+withNc=10. When we
usedNc=10, the updatedT2∗weighted complex densities almost recovered the magnetic
flux densityBzdata comparing to those using the completek-space data.
Discussion
We used the gradient multi-echo MREIT pulse sequence to reduce the imaging time and to maximize injection current duration. Since the MREIT techniques utilize accumulated
phase signal by the injected current, it requires enough repetition timeTRto accumulate
the phase signal. In this sense, the gradient multi-echo MREIT pulse sequence seems
practical approach for the improvement ofBzquality as well as reducing the imaging time.
Table 3 Relative discrete2-errors of∇Bzfor each iteration number()
0 1 2 4 6 8 10
E(∇BNδ=5
z ) 0.8755 0.0753 0.0462 0.0265 0.0214 0.0202 0.0199
E(∇BNδ=10
z ) 1.0945 0.2189 0.0949 0.0552 0.0373 0.0288 0.0252
E(∇BNδ=20
z ) 1.3132 0.6737 0.3039 0.1126 0.0730 0.0548 0.0435
E(∇BNδ=30
1-ch 2-ch
3-ch 4-ch
5-ch 6-ch
7-ch 8-ch
Figure 6 Measured background field inhomogeneity distributions.Real part ofe2iδmn,n=1,· · ·, NCH,m=1,· · ·,NE, whereNCH=8 andNE=4 denote the coil and echo numbers, respectively.
(a)
(c)
20
0
1-st echo 2-nd echo 3-rd echo 4-th echo
(b)
(d)
1-st echo 2-nd echo 3-rd echo 4-th echo
(e)
(g)
20
0
1-st echo 2-nd echo 3-rd echo 4-th echo
1-st echo 2-nd echo 3-rd echo 4-th echo
(f)
(h)
Figure 7 MeasuredT2∗weighted magnitude and magnetic flux densityBzimages usingP0∪P+
withNc=5andNc=10.a)ande)T2∗weighted magnitude image at each echo timeTEm,m=1, 2, 3, 4,
withNc=5 andNc=10, respectively.b)andf)combinedT2∗weighted magnitude image withNc=5 and
Nc=10, respectively.c)andg)recoveredBzimage at each echo timeTEm,m=1, 2, 3, 4 withNc=5 and Nc=10, respectively.d)andh)weightedBzimage using multipleBzimage at each echo time withNc=5
(a)
(c)
20
0
1-st echo 2-nd echo 3-rd echo 4-th echo
1-st echo 2-nd echo 3-rd echo 4-th echo
(b)
(d)
(e)
(g)
20
0
1-st echo 2-nd echo 3-rd echo 4-th echo
1-st echo 2-nd echo 3-rd echo 4-th echo
(f)
(h)
Figure 8 Iteratively updatedT2∗weighted magnitude and magnetic flux densityBzimages using
P0∪P+withNc=5andNc=10.a)ande)recoveredT∗
2weighted magnitude image at each echo time TEm,m=1, 2, 3, 4, withNc=5 andNc=10, respectively.b)andf)combinedT2∗weighted magnitude
image using the recovered magnitude image at each echo time withNc=5 andNc=10, respectively.c)
andg)recoveredBzimage at each echo timeTEm,m=1, 2, 3, 4,withNc=5 andNc=10, respectively.d)
andh)weightedBzimage using multipleBzimage at each echo time withNc=5 andNc=10, respectively.
In this paper, we used a partially acquiredk-space data in the phantom experiment by
filling thek-space as much as 74 line by line, results in 5.92 second to image the resolution
of 128×128. Experimental results show that the proposed interleaved partial Fourier
strategy for MREIT has a potential to reduce scan times and maintain the information of
Bzdata comparable to what is obtained with completek-space data.
The convergence ratio of the iteratively updated phase signal heavily depends on the frequency of the background filed inhomogeneity and the number of half-Fourier
over-sampling phase-encodesP0. Instead of the gradient echo, if we use the spin
multi-echo pulse sequence, the proposed iterative algorithm would rapidly recoverT2-weighted
complex spin density due to a small amount of background field inhomogeneity. However, in spite of some advantages of the spin multi-echo MREIT pulse sequence, for a real-time MREIT imaging, MR pulse sequence should be carefully investigate by taking into account of the width of injection current, the scan duration and the low SNR of measured
Bzsignal.
In this paper, we assumeda prioribackground field inhomogeneity which is typically
it may be possible to extract background field inhomogeneity information under a low
frequency range assumption and by cancelation ofBzinformation:
ρ+(x,y)ρ−(x,y)=ρ2(x,y)e2iδ(x,y)
ρ+(x,y)
ρ−(x,y) =e
2iγBz(x,y)Tc
Several studies reported for the feasibility of MREIT to detect neural activities in the brain, directly [29,30]. Functional MREIT technique is suggested to image brain activity
viaconductivity change related to neural activity through the fast MREIT pulse sequence.
Our future study will focus on applying the proposed method to produce functional con-ductivity images of animal and/or human brain to pursue rapidly changing concon-ductivity associated with neural activities.
Conclusion
In MREIT, the inherent challenges are to reduce the scan time and maintain current injec-tion durainjec-tion to make it feasible for the clinical applicainjec-tions. We developed an iterative
method to optimize the measured magnetic flux densityBzusing the multi-echo
inter-leaved partial Fourier acquisitions for fast imaging in MREIT. The proposed method used a fast gradient multi-echo MR pulse sequence to reduce the scan time and to maximize
the phase signal by injection current. Under the assumption ofa prioribackground field
inhomogeneity map, we rigorously investigated the convergence ratio of the proposed
method using the discrete2-norm, which was closely related with the number of
mea-sured phase encode set and the frequency range of the background field inhomogeneity. To evaluate the proposed method, a specially designed conductivity phantom was used
to provide a homogeneous magnitude, but it yielded distinguishableBzsignal inside and
outside the anomaly. For the phantom experiment, total imaging time was 10.24 seconds to fill the completek-space region in the interleaved sense and it was less than 6 seconds
to fill the partialk-space region to implement the proposed method. The proposed
inter-leaved partial Fourier strategy for the fast MREIT has a potential to reduce scan times and
maintain the information ofBzdata comparable to what is obtained with the complete
k-space data.
Appendix
A Proof of Observation 1
For the phase-encode(kx,ky)∈P+, the Fourier transform ofρ−pe−2iδcan be separated as
FT(ρ−pe−2iδ)(k
x,ky) =(FT(ρp−)∗FT(e−2iδ))(kx,ky)
=(kx,km)∈P+∪P0∪P−FT(ρ −
p)(kx,km)FT(e−2iδ)(kx,ky−km)
=(kx,km)∈P+∪P0FT(ρ −
p)(kx,km)FT(e−2iδ)(kx,ky−km)
+(kx,km)∈P−FT(ρ −
p)(kx,km)FT(e−2iδ)(kx,ky−km)
where∗denotes the convolution with respect toky. Since the updatedS−p data conserve the measured data inP+∪P0,FT(ρp−)(kx,ky)=FT(ρ−)(kx,ky)for(kx,ky)∈P+∪P0. Thus, we have
FT(ρp−e−2iδ)(kx,ky) =(kx,km)∈P+∪P0FT(ρ −)(k
x,km)FT(e−2iδ)(kx,ky−km) +(kx,km)∈P−FT(ρ
−
p)(kx,km)FT(e−2iδ)(kx,ky−km)
=(kx,km)∈P+∪P0FT(ρ −)(k
x,km)FT(e−2iδ)(kx,ky−km) (30)
Since the central phase-encode setP0includes all phase frequencies of the
system-atic phase artifacte−iδ, the range of the phase frequencyky−kmfor(kx,ky) ∈ P+and (kx,km) ∈ P−is over 2Nδ. This means thatFT(e−2iδ)(kx,ky−km) = 0. Thus, we have
FT(ρp−e−2iδ)(k
x,ky) = FT(ρ−e−2iδ)(kx,ky) for(kx,ky) ∈ P+. The case forρp+e−2iδ is similar.
B Proof of Observation 2
SinceFT(ρp∓e−2iδ)(k
x,ky) = FT(ρ∓e−2iδ)(kx,ky)for(kx,ky) ∈ P+due to the observa-tion 1, we have
FT(ρ+e−2iδ)(kx,ky)=FT(ρe−iδeiγBzTc)(kx,ky) for (kx,ky)∈P+ (31)
From the relation (31), by taking the complex conjugate, we recover the skippedk-space
regionP−
FT(ρ−)(kx,ky) = FT(ρeiδe−iγBzTc)(kx,ky)
= FT(ρe−iδeiγBzTc)(−kx,−ky)
= FT(ρp+e−2iδ)(−k x,−ky)
(32)
C Estimation of2-norm
The discrete2-norm of the difference between the true and the iteratively updatedT2∗
weighted spin density can be estimated as following:
FT((ρ+−ρn+−1)e−2iδ) |P+2
2 =ky∈P+|FT
(ρ+−ρn+−1)e−2iδ (kx,ky)|2
=ky∈P+
(kx,km)∈P−FT(ρ +−ρ+
n−1)(kx,km)FT(e−2iδ)(kx,ky−km) 2
≤ky∈P+
(kx,km)∈P−|FT(ρ +−ρ+
n−1)(kx,km)FT(e−2iδ)(kx,ky−km)| 2
≤ky∈P+
FT((ρ+−ρn+−1)|P−2
2
(kx,km)∈P−|FT(e −2iδ)(k
x,ky−km)|2
≤ FT((ρ+−ρn+−1)|P−2
2
ky∈P+
(kx,km)∈P−|FT(e −2iδ)(k
x,ky−km)|2
(33)
Abbreviations
MRI: Magnetic resonance imaging; MREIT: Magnetic resonance electrical Impedance Tomography; MRCDI: Magnetic resonance current density imaging; EIT: Electrical impedance tomography; SNR: Signal-to-noise ratio; SS-SEPI: Single-shot Spin-echo Echo Planar Imaging; FOV: Field of view; ICNE: Injection current nonlinear encoding.
Competing interests
The authors declare that they have no competing interests.
Authors’ contributions
Acknowledgements
E J Woo was supported by the National Research Foundation of Korea (NRF) grant funded by the Korea government (MSIP)(No. 2010-0018275). O I Kwon and H J Kim were supported by Basic Science Research Program through the National Research Foundation of Korea(NRF) funded by the Ministry of Education, Science and Technology (No. 2013R1A2A2A04016066, 2012R1A1A2008477).
Author details
1Department of Biomedical Engineering, Kyung Hee University, Yongin, Korea.2Department of Mathematics, Konkuk University, Seoul, Korea.
Received: 19 June 2013 Accepted: 21 August 2013 Published: 27 August 2013
References
1. Joy MLG, Scott GC, Henkelman RM:In vivo detection of applied electric currents by magnetic resonance imaging.Magn Reson Imag1989,7:89–94.
2. Scott GC, Joy MLG, Armstrong RL, Henkelman RM:Measurement of nonuniform current density by magnetic resonance.IEEE Trans Med Imag1991,10:362–374.
3. Ider YZ, Birgul O:Use of the magnetic field generated by the internal distribution of injected currents for Electrical Impedance Tomography (MR-EIT).Elektrik1998,6:215–225.
4. Eyuboglu M, Birgul O, IY Z:A dual modality system for high resolution-true conductivity imaging.InProc. XI Int. Conf. Electrical Bioimpedance (ICEBI); 2001:409–413.
5. Birgul O, Eyuboglu BM, Ider YZ:Current constrained voltage scaled reconstruction (CCVSR) algorithm for MR-EIT and its performance with different probing current patterns.Phys Med Biol2003,48:653–671. 6. Kwon O, Woo EJ, Yoon JR, Seo JK:Magnetic resonance electrical impedance tomography (MREIT): simulation
study of J-substitution algorithm.IEEE Trans Biomed Eng2002,48:160–167.
7. Kim YJ, Kwon O, Seo JK, Woo EJ:Uniqueness and convergence of conductivity image reconstruction in magnetic resonance electrical impedance tomography.Inverse Probl2003,19:1213–1225.
8. Ider YZ, Onart S, Lionheart WRB:Uniqueness and reconstruction in magnetic resonance-electrical impedance tomography(MR-EIT).Physiol Meas2003,24:591–604.
9. Muftuler L, Hamamura M, Birgul O, Nalcioglu O:Resolution and contrast in magnetic resonance electrical impedance tomography (MREIT) and its application to cancer imaging.Tech Cancer Res Treat2004,3:599–609. 10. Ozdemir M, Eyuboglu BM, Ozbek O:Equipotential projection-based magnetic resonance electrical impedance
tomography and experimental realization.Phys Med Biol2004,49:4765–4783.
11. Seo JK, Yoon JR, Woo EJ, Kwon O:Reconstruction of conductivity and current density images using only one component of magnetic field measurements.IEEE Trans Biomed Eng2003,50:1121–1124.
12. Oh SH, Lee BI, Woo EJ, Lee SY, Cho MH, Kwon O, Seo JK:Conductivity and current density image reconstruction using harmonic Bz algorithm in magnetic resonance electrical impedance tomography.Phys Med Biol2003, 48:3101–3116.
13. Park C, Kwon O, Woo EJ, Seo JK:Electrical conductivity imaging using gradient Bz decomposition algorithm in magnetic resonance electrical impedance tomography (MREIT).IEEE Trans Med Imag2004,23:388–394. 14. Joy MLG:MR current density and conductivity imaging: the state of the art.InProc. 26th Ann. Int. Conf. IEEE
EMBS. San Francisco; 2004:5315–5319.
15. Lee BI, Lee SH, Kim TS, Kwon O, Woo EJ, Seo JK:Harmonic decomposition in PDE-based denoising technique for magnetic resonance electrical impedance tomography.IEEE Trans Biomed Eng2005,52:1912–1920.
16. Oh SH, Lee BI, Woo EJ, Lee SY, Kim TS, Kwon O, Seo JK:Electrical conductivity images of biological tissue phantoms in MREIT.Physiol Meas2005,26:S279–S288.
17. Gao N, Zhu SA, He BA:New magnetic resonance electrical impedance tomography (MREIT) algorithm: the RSM-MREIT algorithm with applications to estimation of human head conductivity.Phys Med Biol2006, 51:3067–3083.
18. Birgul O, Hamamura M, Muftuler L, Nalcioglu O:Contrast and spatial resolution in MREIT using low amplitude current.Phys Med Biol2006,51:5035–5049.
19. Kim HJ, Oh TI, Kim YT, Lee BI, Woo EJ, Seo JK, Lee SY, Kwon O, Park C, Kang BT, Park HM:In vivo electrical conductivity imaging of a canine brain using a 3 T MREIT system.Physiol Meas2008,29:1145–1155. 20. Kim HJ, Kim YT, Minhas AS, Jeong WC, Woo EJ, Seo JK, Kwon OJ:In Vivo high-resolution conductivity imaging of
the human leg using MREIT: the first human experiment.IEEE Trans Med Imag2009,99:160–167. 21. Woo EJ, Seo JK:Magnetic resonance electrical impedance tomography (MREIT) for high-resolution
conductivity imaging.Physiol Meas2008,29:R1–R26.
22. Hamamura M, Muftuler L:Fast imaging for magnetic resonance electrical impedance tomography.Magn Reson Imaging2008,26:739–745.
23. Muftuler L, Chen G, Hamamura M, Ha SH:MREIT with SENSE acceleration using a dedicated RF coil design. Physiol Meas2009,30:913–929.
24. Park HM, Nam HS, Kwon O:Magnetic flux density reconstruction using interleaved partial Fourier acquisitions in MREIT.Phys Med Biol2011,56:2059–2073.
25. Scott GC, Joy MLG, Armstrong RL, Henkelman RM:Sensitivity of magnetic resonance current density imaging. J Magn Reson1992,97:235–254.
26. Sadleir R, Grant S, Zhang SU, Lee BI, Pyo HC, Oh SH, Park C, Woo EJ, Lee SY, Kwon O, Seo JK:Noise analysis in MREIT at 3 and 11 Tesla field strength.Physiol Meas2005,26:875–884.
28. Park C, Lee BI, Kwon O, Woo EJ:Measurement of induced magnetic flux density using injection current nonlinear encoding (ICNE) in MREIT.Physiol Meas2007,28:117–127.
29. Woo EJ:Functional brain imaging using MREIT and EIT: Requirements and feasibility.In8th Int. Conf. on Bioelectromagnetism; 2011:131–134.
30. Sadleir RJ, Grant SC, Woo EJ:Can high-field MREIT be used to directly detect neural activity? Theoretical considerations.Neuroimage2010,52:205–216.
doi:10.1186/1475-925X-12-82
Cite this article as:Chauhanet al.:Optimization of magnetic flux density for fast MREIT conductivity imaging using multi-echo interleaved partial fourier acquisitions.BioMedical Engineering OnLine201312:82.
Submit your next manuscript to BioMed Central and take full advantage of:
• Convenient online submission
• Thorough peer review
• No space constraints or color figure charges
• Immediate publication on acceptance
• Inclusion in PubMed, CAS, Scopus and Google Scholar
• Research which is freely available for redistribution