Open Access
Methodology
Development and evaluation of a high-throughput, low-cost
genotyping platform based on oligonucleotide microarrays in rice
Jeremy D Edwards*
1, Jaroslav Janda
2, Megan T Sweeney*
2,
Ambika B Gaikwad
3, Bin Liu
4, Hei Leung
5and David W Galbraith
2Address: 1University of Florida, Gulf Coast Research & Education Center, Wimauma FL, 33598, USA, 2University of Arizona, Department of Plant Sciences and Bio5 Institute for Collaborative Bioresearch, Tucson AZ, 85721, USA, 3National Research Centre on DNA Fingerprinting, National Bureau of Plant Genetic Resources, New Delhi, India, 4Guangdong Academy of Agricultural Sciences (GDAAS), Guangdong, Pr China and 5International Rice Research Institute (IRRI), Los Banos, The Philippines
Email: Jeremy D Edwards* - [email protected]; Jaroslav Janda - [email protected]; Megan T Sweeney* - [email protected]; Ambika B Gaikwad - [email protected]; Bin Liu - [email protected]; Hei Leung - [email protected];
David W Galbraith - [email protected] * Corresponding authors
Abstract
Background: We report the development of a microarray platform for rapid and cost-effective genetic mapping, and its evaluation using rice as a model. In contrast to methods employing whole-genome tiling microarrays for genotyping, our method is based on low-cost spotted microarray production, focusing only on known polymorphic features.
Results: We have produced a genotyping microarray for rice, comprising 880 single feature polymorphism (SFP) elements derived from insertions/deletions identified by aligning genomic
sequences of the japonica cultivar Nipponbare and the indica cultivar 93-11. The SFPs were
experimentally verified by hybridization with labeled genomic DNA prepared from the two cultivars. Using the genotyping microarrays, we found high levels of polymorphism across diverse rice accessions, and were able to classify all five subpopulations of rice with high bootstrap support.
The microarrays were used for mapping of a gene conferring resistance to Magnaporthe grisea, the
causative organism of rice blast disease, by quantitative genotyping of samples from a recombinant inbred line population pooled by phenotype.
Conclusion: We anticipate this microarray-based genotyping platform, based on its low cost-per-sample, to be particularly useful in applications requiring whole-genome molecular marker coverage across large numbers of individuals.
Background
Considerable interest exists in the ability to determine genotypes within species in a cost-effective manner. Cost-effectiveness is principally determined by desired out-come: when the outcome is a complete genotypic descrip-tion of a single individual (for example a human patient),
the cost is largely defined by healthcare economics, and is the driving force behind initiatives to minimize the whole genome costs of sequencing [1]. For outcomes in the agri-cultural sector, for example ones leading to identification of genes responsible for desired agronomic traits, geno-typing is applied to large populations rather than single Published: 29 May 2008
Plant Methods 2008, 4:13 doi:10.1186/1746-4811-4-13
Received: 2 April 2008 Accepted: 29 May 2008
This article is available from: http://www.plantmethods.com/content/4/1/13
© 2008 Edwards et al; licensee BioMed Central Ltd.
individuals, which considerably changes the economic considerations. Moreover, since downstream gene map-ping and identification technologies are increasingly well-established for different crop species [2], the required res-olution of such genotyping platforms need not approach the single-nucleotide level provided by whole genome sequencing. Consequently, economic considerations and practical applications of a genotyping technology are driven largely by individual rather than cost-per-datum.
Microarray-based technologies for genotyping have become increasingly popular since they offer an assay that is highly multiplexed, and this was immediately recog-nized as providing a low cost per data point [3]. One of the earliest reports of microarray-based genotyping employed high density whole-genome tiling arrays, pro-duced by photolithographic synthesis (Affymetrix, Santa Clara, CA), for the simultaneous discovery and assay of DNA polymorphisms in yeast. In genotyping assays based on microarrays, allelic variations are detected as differen-tial hybridization of labeled genomic DNA to individual probes, or sets of probes, covering identifiable genomic locations. Using this approach, a large number of single feature polymorphisms (SFPs) were identified between two laboratory strains of yeast [4]. In this case, 3,714 markers were identified using microarrays which com-prised 157,112 overlapping 25-mers spanning all anno-tated Saccharomyces cerevisiae open reading frames [5]. For the larger and more complex Arabidopsis genome, tiling arrays were not available, and hence the first experiments involved hybridization of labeled genomic DNA using Affymetrix AtGenome1 GeneChips based on available, expression-based annotation for open reading frames (ORFs). Despite this ORF-based focus, nearly 4,000 SFPs were identified between the Columbia (Col) and Lands-berg erecta (Ler) accessions [6]. In a subsequent study, more than 8000 SFPs were identified using the ATH1 GeneChip comprising 22,500 probe sets representing approximately 24,000 genes [7].
High density microarray platforms of this type provide a very large amount of information from single individuals, and therefore are ideally suited for polymorphism discov-ery [8] or for genome-wide association studies [9,10]. However, for genotyping populations, the economic util-ity of microarray genotyping platforms is a function not simply of the multiplexing level, but also of the costs asso-ciated with processing each sample [11]. Affymetrix Gene-chips have the conspicuous disadvantage of a high cost of production and hybridization per array, and this limits their use in situations requiring the genotyping of large numbers of individuals, such as in plant breeding. In con-trast, the production of microarray slides through robotic printing of array elements is relatively inexpensive
[12,13]. For microarrays of this type, the array elements (probes) are either PCR amplicons [14], or synthesized single-stranded oligonucleotides [15]. Since very little DNA is needed for printing each element, beyond the ini-tial cost of production, the cost per element becomes van-ishingly small. A further cost-savings is achieved since the microarrays are conventionally hybridized to mixed pairs of nucleic acid targets, separately labeled with different fluorochromes, rather than using one target per hybridiza-tion as done with Affymetrix Genechips.
Diversity array technology (DArT) is a modification of the amplified fragment length polymorphism (AFLP) proce-dure using a microarray platform [16-18]. In DArT, a pool of DNA fragments is produced from a subset of the genome by restriction enzyme digestion of genomic DNA followed by ligation of adaptors and PCR amplification with adaptor specific primers. Fragments from this pool of DNA are cloned and spotted on a microarray. Pools of tar-get DNA are similarly generated from other samples, fluo-rescently labeled, and hybridized to the arrays. The assay reveals whether the specific cloned DNA fragments are present in the queried sample. An advantage of the DArT technology is that prior genome sequence information is not required; therefore it can be applied to a large range of species. A disadvantage is that, similarly to AFLP, the dif-ferential PCR amplification of specific fragments may vary between experiments depending on PCR conditions. Another disadvantage is that the sequence and precise genomic location of the cloned fragments is not known. Therefore, with DArT, it is difficult to target specific genes or genomic regions with higher densities of markers.
of humans and up to 60% of the calories in countries that rely on rice as the main staple [20]. Because most of the rice improvement efforts occur in developing countries; a low-cost and robust method would be particularly impor-tant for breeding institutions with modest levels of research infrastructure.
This low-cost, focused method of genotyping, using printed long-oligonucleotide microarrays, will be particu-larly useful for applications that require high-density molecular marker coverage of entire genomes for large numbers of samples. Such applications include quantita-tive trait locus (QTL) mapping, genetic diversity and pop-ulation structure studies, association mapping, molecular breeding, polymorphism surveys, and marker assisted selection. In this study, we describe the development and use and validation of the genotyping microarrays, and their utilization in the assessment of the levels of poly-morphism and genetic relationships within a collection of diverse rice accessions, and to map a major gene confer-ring resistance to the rice blast pathogen (Magnaporthe gri-sea) in a segregating recombinant inbred line (RIL) population. Finally, since this method of genotyping is general in scope and can be implemented in other species,
provided that sufficient genomic sequences from multiple individuals are available for the identification of SFPs, we describe a bioinformatics pipeline that has been devel-oped for this purpose.
Results
Polymorphism discovery
To create probes that can detect the presence or absence of indel sequences in a genomic DNA sample, the probes need to be complementary to a unique single copy sequence. To identify suitable indels, the genome sequences of the japonica rice cultivar Nipponbare and the indica cultivar 93-11 were aligned. Whole-genome align-ments were done using MUMmer and NUCmer 3.18 [21-23]. The indel sequences were masked for simple repeats and for known rice repetitive elements [24]. Indels with at least 29 nucleotides of unique sequence were considered for probe design. The alignment of cv. Nipponbare and cv. 93-11 genomic sequences revealed 880 indel loci where oligonucleotide probes could be designed with specifica-tions suitable for hybridization (Additional File 1). The indels used for probe design ranged from 29 to 426 otides in length, with an average indel size of 76 nucle-otides. Of the 880 probes designed, 423 are complementary to the Nipponbare allele and 457 are complementary to the 93-11 allele. The order and posi-tions of the resulting SFP markers was determined based their positions in the cv. Nipponbare pseudomolecule assembly (Figure 1). The median distance between SFP markers is 234 kilobases, and the largest gaps occur around the locations of the centromeres [25] and in peri-centromeric regions.
Experimental verification of SFPs
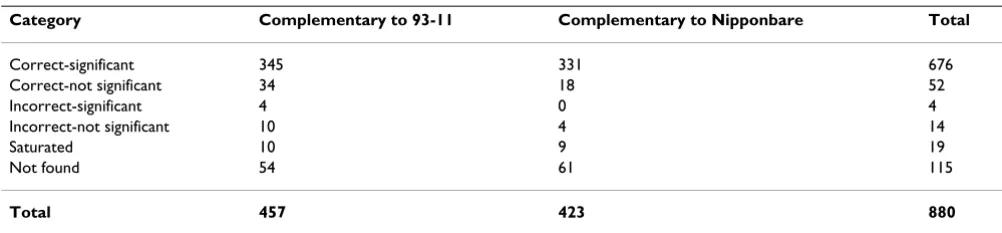
To validate the genotyping protocol and the computation-ally predicted SFPs, we hybridized Cy5 and Cy3 labeled genomic DNA of cv. Nipponbare and cv. 93-11 to four microarrays, with each of the probes printed in triplicate. To be useful as molecular markers, the SPFs should be reli-able and have a fold change between samples that is read-ily detectable. At a p-value of 0.05 or less, 676 probes (76.8%) had significant color-ratio fold changes in the predicted direction, and only four probes with fold changes opposite to that predicted (Table 2, Figure 2). We designed primers around the probes which showed fold changes in the opposite direction and were able to show that the predicted indel was present in each case. Of the 880 probes, 115 were unusable because they were consid-ered to be "not found" based on more than 50% of the spots having a signal to noise ratio < 1 across all replicates. A further 19 probes were unusable because the signal intensities were saturated in more than 50% of the spots across replicates. The probes considered as being both found and unsaturated had a mean GC content of 46.8%. The probes considered saturated had a significantly higher
Positions of SFP markers on the rice pseudomolecule map Figure 1
Positions of SFP markers on the rice pseudomolecule
map. SFPs with oligonucleotide sequences complementary
to Nipponbare are shown as black and those complementary to 93-11 are shown in grey. SFPs confirmed by PCR are shown in blue (Nipponbare) and red (93-11). The positions of the centromeres are indicated with an "X".
0
5
10
15
20
25
30
35
40
45
1 2 3 4 5 6 7 8 9 10 11 12
Chromosome
Megabases
Japonica-derived probes Indica-derived probes
(p-value = 1.86E-07) GC content of 53.6% and the probes considered not found had a significantly lower (p-value = 6.57E-09) GC content of 43.6%. The SPFs were also vali-dated on slides configured in the 24-plex format using the restriction-ligation labeling procedure. Using this method, across eight arrays, 30 probes were considered to be not found, and 35 were considered to be saturated.
To determine if the SFPs identified in this study could be used as individual PCR based markers, we attempted to design primers surrounding a selected subset (72) of the indels, 36 having deletions in Nipponbare and 36 having deletions in 93-11 (Figure 1, Additional File 1). Two of SFPs were located in highly repetitive regions and no unique primer sequences could be created to amplify only these loci. One SFP was surrounded by sequence that was highly diverged between Nipponbare and 93-11 such that no primers complementary to sequences conserved between Nipponbare and 93-11 could be created. We suc-cessfully designed primers surrounding the remaining 69 SFPs and, using these primers on Nipponbare and 93-11 genomic DNA, demonstrated that these loci could be individually assayed using PCR. This enables researchers to assay population polymorphisms more efficiently, either using a single hybridization to the genotyping microarray to define the polymorphic markers, and then employing only these markers for PCR-based analyses of populations, or screening large fine-mapping populations with only those markers flanking a QTL previously identi-fied by microarray genotyping. Several of the amplicons showed a larger difference in allele size than predicted. We determined that this was due to the presence of highly repetitive sequence within the indel which was masked during the SFP discovery process.
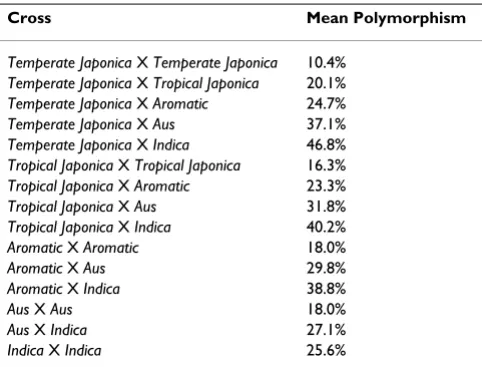
Polymorphisms within O. sativa
To be generally useful genetic markers, the SFPs between Nipponbare and 93-11 should be polymorphic between other O. sativa varieties. The genotyping microarrays were used to assess the polymorphisms across 20 diverse O. sativa varieties representing five sub-populations as deter-mined through STRUCTURE [26] analysis with 169 mic-rosatellite markers [27]. The genotype scores are listed in Additional File 2. Average levels of polymorphism for pairs of varieties were calculated within and between sub-populations (Table 1). The highest levels of polymor-phism (66.2%) were found between the temperate japonica and indica sub-populations. This is expected, given that the sequenced varieties used for SFP discovery, Nippon-bare and 93-11, belong to the temperate japonica and indica sub-populations respectively. The lowest level of poly-morphism was within the temperate japonica popula-tion (10.4%) which is also the least diverse sub-population according to microsatellite markers [27]. Using the SFP genotype data, a neighbor-joining tree was constructed to examine the genetic relationships between the five subpopulations (Figure 3). The relationships according to the SFP analysis are concordant with previ-ous studies [27-30] with extremely high bootstrap sup-port. Model-based clustering using STRUCTURE was used to calculate site-by-site probabilities of sub-population origin of alleles across the twelve chromosomes for each of the 20 O. sativa varieties (Figure 4). The clustering using the SFP data is consistent with the clustering using micro-satellite markers. Further, the use of high density SFP markers resolves large blocks of chromosomes with ances-try that differs from the overall sub-population assign-ment of the individuals.
Bulked Segregant Analysis with SFPs
The SFP genotyping microarrays were used in a bulk regant analysis [31] experiment with a RIL population seg-regating for resistance to a single isolate (IsoIV) of rice blast disease. Pools of 73 resistant and 73 susceptible lines were hybridized to six slides using a balanced dye-swap design. SFPs that are linked to the gene(s) conferring resistance should display significant differences in color ratios reflecting differences in allele frequencies between the two pools. SFPs that are unlinked should have bal-anced color ratios. The ANOVA method was used to calcu-late p-values for each SFP marker. The log transformed fold changes of the SFPs and the SFPs positions were then plotted on the pseudomolecule assembly (Figure 5). In this figure, we employed the convention that the p-values were plotted in a positive direction if the direction of the ratio signified greater representation of the SHZ (resistant parent) in the resistant pool, and in the negative direction for SFPs signifying greater representation of the LTH (sus-ceptible parent) alleles in the resistant pool. A cluster of SFPs with significant p-values was found on chromosome
Table 1: Average pairwise percent of polymorphic markers between accessions belonging to the five rice subpopulations. The percent of polymorphic markers is calculated using four accessions per sub-population.
Cross Mean Polymorphism
Temperate Japonica X Temperate Japonica 10.4%
Temperate Japonica X Tropical Japonica 20.1%
Temperate Japonica X Aromatic 24.7%
Temperate Japonica X Aus 37.1%
Temperate Japonica X Indica 46.8%
Tropical Japonica X Tropical Japonica 16.3%
Tropical Japonica X Aromatic 23.3%
Tropical Japonica X Aus 31.8%
Tropical Japonica X Indica 40.2%
Aromatic X Aromatic 18.0%
Aromatic X Aus 29.8%
Aromatic X Indica 38.8%
Aus X Aus 18.0%
Aus X Indica 27.1%
12, indicating that SHZ alleles in this chromosomal region may confer resistance. The top 10 most significant SFPs all fall within the same region of chromosome 12, and are ordered by most to least significant (Table 4) with Benjamini and Hochberg [32] adjusted p-values. The gene conferring resistance to the blast IsoIV isolate designated as Pi-GD-3(t) has previously been mapped using micros-atellite markers in the same RIL lines [33]. The resistance gene was most closely linked to microsatellite marker RM179 on chromosome 12 close to the most significant SFP (adjusted p-value 5.06E-09) at position 13266396. Thus, the SFP bulked segregant results are consistent with previous genetic mapping based on conventional micros-atellite markers.
Discussion
Alignment of genomic sequence was demonstrated to be an accurate method for in silico prediction of SFPs. Addi-tional SFP markers could be obtained using the same pipeline for indel discovery and probe design with the input of genomic sequences of other rice varieties or related species as they become available. SFPs may also be discovered in other rice varieties through hybridization of genomic DNA to tiling arrays [6]. The sequences of the probes identified as polymorphic on the tiling arrays could be used to design 70-mer probes to be included on the lower cost spotted microarrays. Using this approach, efforts are currently underway to expand the number and varietal sources of SFP markers on the genotyping micro-array. The on-going whole-genome SNP discovery project in rice is expected to generate information on distribution of SNP across 20 lines using Nipponbare sequence as the reference [34]. Although the Perlegen hybridization
approach will primarily yield SNP data, results from Ara-bidopsis suggest that small to medium size indels could also be inferred from the hybridization data file, provid-ing a rich source of deletion sites across diverse germ-plasm for designing SNP markers [35] and (D. Weigel, personal communication). The described methods for SFP discovery and the microarray-based genotyping assay could also be implemented in any other species having genomes small enough (e.g., medicago, sorghum, soy-bean, and tomato) to permit adequate levels of hybridiza-tion with high specificity to the spotted probes. However, cross-hybridization problems may prevent the use of a microarray-based genotyping methods in polyploids or species with large genomes. The microarray-based geno-typing platform is particularly useful for genetic mapping applications requiring whole-genome scans.
Of the various possible applications to gene mapping, we successfully demonstrated bulked-segregant analysis where the use of genotyping microarrays is advantageous because it provides a quantitative assessment of allele fre-quencies between groups of pooled samples. By pooling genotypes of two phenotypic extremes, these experiments can be accomplished rapidly using a small number of microarrays. We showed that we could pool large number of genotypes per extreme (73 in our case), thereby
defin-Neighbor Joining tree using the SFP marker data to show the genetic relationships between the five sub-populations of rice Figure 3
Neighbor Joining tree using the SFP marker data to show the genetic relationships between the five sub-populations of rice. Neighbor joining trees were con-structed using four accessions per subpopulation. The boot-strap values are out of 10,000.
0.1
Tropical Japonica
Temperate Japonica
Aromatic
Indica
Aus
O. meridionalis
10,000
10,000 10,000
10,000
A volcano plot comparing Nipponbare and 93-11 genomic DNA hybridizations with the 880 SFPs
Figure 2
A volcano plot comparing Nipponbare and 93-11 genomic DNA hybridizations with the 880 SFPs. SFPs with oligonucleotide sequences complementary to Nippon-bare are shown as black and those complementary to 93-11 are shown as grey.
1.E-08
1.E-07
1.E-06
1.E-05
1.E-04
1.E-03
1.E-02
1.E-01
1.E+00
-1 -0.8 -0.6 -0.4 -0.2 0 0.2 0.4 0.6 0.8 1
Nipponbare 9311
Log-fold change
ing a narrow genetic window. The median spacing of SFP markers on the chromosomes is 234 kb. Assuming a 50% polymorphism, BSA mapping provides resolution of about 0.5 Mb or approximately 2 cM. Once the location is mapped, simple sequence repeat (SSR) markers can be used to saturate the region. Applying the same approach, we were able to rapidly define the chromosomal location of a mutation (M. Bernardo and H. Leung, unpublished data).
For conventional QTL mapping, the low cost per individ-ual of this assay enables genotyping of large segregating populations. Our current protocols, including replication, have reduced the cost per genotype to less than $18 (Low cost labeling method presented in Additional File 4). The rice genotyping microarrays will be available for distribu-tion through the Galbraith lab http://ag.arizona.edu/ ~dgalbrai/ High density molecular marker coverage of QTL mapping populations will delimit recombination breakpoints with greater precision and potentially enhance the mapping resolution. Molecular breeding applications are also likely to benefit from microarray-based genotyping. In backcrossing experiments, the whole-genome coverage would allow genotypic positive selection for the desired alleles at specific loci and nega-tive selection against "background" donor alleles at all other loci throughout the genome [36]. The whole-genome coverage also provides the ability to construct "graphical genotypes" to more efficiently pyramid desired alleles at multiple loci [37]. Microarrays may also be used to genotype introgression lines derived from wide crosses. Tracking of introgressed chromosomal segments with high precision in introgression lines combined with phe-notypic analysis can be used to establish phephe-notypic effects associated with particular introgressions through advanced backcross QTL analysis [38] and provide oppor-tunities for cloning of the underlying genes. Collections of introgression lines genotyped at a high resolution will facilitate more efficient utilization of genetic resources [39,40]. While SNP platforms for rice are being developed which will allow the generation of large amounts of data for pennies a data point, they are still more than a
hun-dred dollars per sample, which limits their use in map-ping populations and other applications in which a large number of samples need to be run.
A method similar to the one described here has been implemented in Arabidopsis (Salathia et al, 2007). Our methods offer the advantage of a labeling procedure with a substantial reduction in the per-sample cost, and we provide a flexible platform for SFP identification and probe design that can be used with genome sequences in any other species.
The ability to detect polymorphisms across diverse rice varieties makes the microarray-based genotyping platform useful for population genetics studies. Domesticated crops have complicated genetic histories and individual can have a complex network of genetic relationships. The microarray platform can produce a density of genotypic data that is sufficient to track sub-population ancestry across chromosome segments using structure analysis [26]. The resulting population structure information could be used to a framework for association mapping with diverse lines [41-43] or elite lines [19,44]. Microar-ray-based genotyping could also be used in plant variety protection as a method to identify and distinguish between released varieties with the robustness afforded by large numbers of molecular markers.
Conclusion
Variations in DNA sequence are a mixture of SNPs and indels. Indels are generated by different mechanisms than SNPs. Indels may arise through transposon mediated rear-rangements [45,46] and genomic expansion and contrac-tion [47]. Indels within or spanning genes or regulatory regions can be a significant component of intraspecific genetic variation and a potential source of hererosis [48]. The flexibility of the spotted arrays also makes it relatively simple to add more SFP markers over time to increase the coverage of individual chromosomes. The results gathered so far suggest that this SFP-based platform should provide a very useful complement to SNP terminologies for
asso-Table 2: Validation of SFPs for significant fold change (< 0.05), fold change in the predicted direction, and detection or saturation of hybridization signal.
Category Complementary to 93-11 Complementary to Nipponbare Total
Correct-significant 345 331 676
Correct-not significant 34 18 52
Incorrect-significant 4 0 4
Incorrect-not significant 10 4 14
Saturated 10 9 19
Not found 54 61 115
ciating DNA sequence polymorphisms with phenotypic variation.
Methods
Polymorphism discovery
The genotyping platform employs oligonucleotide probes to detect the presence or absence of indel sequences in a genomic DNA sample. Each indel must therefore contain a stretch of unique, single copy sequence so that this is the only sequence in the genome that can hybridize to its complementary probe. To identify suitable indels, the genome sequences of the japonica rice cultivar Nippon-bare and the indica cultivar 93-11 were aligned. The sequences used in the alignment are the pseudomolecules of cv. Nipponbare assembled by TIGR (version 3) [49], based on the International Rice Genome Sequencing Project (IRGSP) finished quality sequence http:// rgp.dna.affrc.go.jp/IRGSP/, and the contigs from the whole-genome shotgun sequence of cv. 93-11 [19]. Whole-genome alignments were done using MUMmer and NUCmer 3.18 [21-23], with a 1000 base alignment extension and 1000 base maximum gap length. Indels shorter than 30 bases were excluded from further analysis, because they do not meet the probe length requirements. Using Perl scripts, the indel sequences were first masked for simple repeats. Next, the indel sequences were masked for complex repeats following Blast analysis [50] against a
collection of known rice repetitive elements [24]. Indels with sufficiently long stretches of unique sequence (at least 30 nucleotides) were considered for probe design.
Oligonucleotide probe design
Oligonucleotide probes were designed to be complemen-tary to the indel sequences. Long oligonucleotides (68–70 bases) were used to ensure sufficient signal intensities [51] following hybridization. For uniformity in hybridization, probes were selected to have a balanced GC content with an optimum melting temperature (Tm) of 83°C and a range between 78°C and 88°C calculated using the "irre-versible" formula for oligonucleotides greater than 50 bases [52]. To ensure that the probes do not cross-hybrid-ize with any other sequences in the genome, potential probes were excluded that had greater than 70% identity across the entire probe, or stretches of contiguous sequence longer than 20 bases with 100% identity to another sequence in the genome [53]. The probes were designed to overlap a maximum of 20 bases of sequence extending beyond the indel on each side. Therefore, for a 70 mer, the minimum indel size is 30 bases. Perl scripts were employed for processing the indel sequences for oli-gonucleotide probe design based on the established parameters. Potential probe sequences were checked using Blast searches of the whole genome sequences of Nipponbare and 93-11 to exclude those with hits having
Site-by-site probabilities for the population of origin of alleles across the twelve chromosomes of each accession Figure 4
Site-by-site probabilities for the population of origin of alleles across the twelve chromosomes of each
acces-sion. There are four accessions per sub-population plus Nipponbare and 93-11 reference sequences. Calculations are done
using the linkage model of STRUCTURE. Nipponbare
Geumobyeo Heukgyeong Shinrike Shoemed Arias Khao_Hawm Kotobuki_Mochi Lemont Basmati_217 Dom_Sofid JC1
Pankhari_203 Dhala_Shaitta DV85 Kasalath Phudugey Chau
Dee-Geo-Woo-Gen Guan-Yin-Tsan KDM105 9311
1 2 3 4 5 6 7 8 9 10 11 12
Temperate Japonica
Tropical Japonica
Aromatic
Aus
a percent identity greater than 70%. The remaining probes were sorted by Tm, and the probe closest to the optimum was selected for each indel. The SFP discovery scripts can be found in Additional File 5, and the output of those scripts in Additional File 6. A total of 880 putative SFPs were identified from indels with sequences meeting the probe design criteria (Additional File 1). Additionally, six probes were designed from sequences not present in rice to provide negative controls, and six probes were designed from sequences present in both Nipponbare and 93-11 for use as positive controls. Six probes were designed from repetitive sequences for optimization and troubleshoot-ing of the hybridization protocol. Details of the various control elements are provided in Additional File 3.
Microarray printing
The oligonucleotides were commercially synthesized (Operon Biotechnologies, Huntsville, AL) with a 5'-amine modification. The synthesized oligonucleotides were arranged in 384-well plates, and dissolved at 20 pmol/μL in 3× SSC buffer. The oligonucleotide probes were printed on Superamine substrate slides (SMM, Telechem, Sunny-vale, CA) using an Omnigrid 100 printer (Genomic Solu-tions,) Ann Arbor, MI equipped with Telechem SMP3 spotting pins. Each probe, including 880 putative markers and 18 controls, was printed with three replicates per slide in separate subarrays. After printing, the slides were baked at 80°C for two hours.
Significance of SFP fold change measurements between pools of DNA from blast resistant and susceptible RILs Figure 5
Significance of SFP fold change measurements between pools of DNA from blast resistant and susceptible
RILs. SFP markers showing association of the resistant parent (SHZ) allele with the resistant pool are assigned positive values
and association with the susceptible parent allele (LTH) with the resistant pool are assigned negative values. The line is drawn using loess smoothing.
-5
-2
02
46
81
0
-5
-2
0
2
4
6
8
1
0
-5
-2
0
2
4
6
8
1
0
-5
-2
0
2
4
6
8
1
0
-5
-2
02
46
81
0
-5
-2
0
2
4
6
8
1
0
0 2 4 6 8 10 12 14 16 18 20 22 24 26 28 30
-5
-2
02
46
81
0
-5
-2
0
2
4
6
8
1
0
-5
-2
0
2
4
6
8
1
0
-5
-2
0
2
4
6
8
1
0
-5
-2
02
46
81
0
-5
-2
0
2
4
6
8
1
0
0 2 4 6 8 10 12 14 16 18 20 22 24 26 28 30
Chromosome 10
Chromosome 11
Chromosome 12 Chromosome 7
Chromosome 8
Chromosome 9
Chromosome 4
Chromosome 5
Chromosome 6 Chromosome 1
Chromosome 2
Chromosome 3
-L
og10 P-v
alue
Target preparation
DNA samples were extracted from leaf tissues using a modified chloroform-SDS protocol [54]. The genomic DNA at a concentration of 100 ng/ul in a volume of 100 ul was sheared using a High Intensity Ultrasonic Processor device (Sonics & Materials Inc., 250-Watt Model, New-town, CT). For each sample, 1 μg of sheared DNA was labeled with Cy3 or Cy5 dUTP/dCTP (Amersham Bio-sciences, Piscataway, NJ) using the BioPrime Array CGH Genomic Labeling System (cat# 18095-012, Invitrogen, Carlsbad, CA) in a 50 μL volume with a 12–16 hour reac-tion time. The Cy3 and Cy5 labeled products were puri-fied simultaneously in a single spin-column (Qiagen PCR purification kit, cat# 28104, Valencia, CA), and eluted in 25 μL of water.
Hybridization
Prior to hybridization, the microarray slides were rehy-drated over a 50°C water bath for ten seconds and then snap-dried on a 65°C heating block, repeating both steps four times. Next, the slides were UV cross-linked using a Stratalinker [180 mJ] (Stratagene, La Jolla, CA). The slides were then incubated in a 1% BSA solution in 6.6× SSC at 37°C for 40 minutes, placed in 1% SDS for five minutes, dipped ten times in water, and spun to dryness in a bench-top centrifuge at 1,000 rpm for 2 minutes. The hybridiza-tion buffer was prepared using 24 μL of labeled DNA (including both the Cy3 and Cy5 samples), 1.2 μL of 2% SDS, 3 μL of 20× SSC, and 1.8 μL of Liquid Block (Amer-sham Life Science, cat# 1059304). To denature the labeled samples, the hybridization buffer was heated in a thermo-cycler for five minutes at 100°C and placed immediately
on ice. The hybridization buffer (60 ul) was loaded onto each slide under a cover slip (Lifter slip, Erie Scientific, 241x301-2-511) and incubated for 12–16 hours at 65°C in a hybridization chamber (Telechem/ArrayIt Hybridiza-tion Cassette, AHC). After hybridizaHybridiza-tion, the slides were washed successively in three solutions for five minutes each, with 2× SSC and 0.5 % SDS at 65°C, 0.5× SSC at room temperature, and 0.2× SSC at room temperature. The slides were centrifuged to dryness at 1,000 rpm for 2 minutes.
Data acquisition and analysis
The microarray slides were scanned with a Gene Pix Autoloader (Axon/Molecular Devices, 4200A01, Sunny-vale, CA) at a resolution of 10 μm per pixel with laser illu-mination (100% power) at 532 and 635 nm, and PMT gain settings between 700 and 800 (adjusted for balance between colors). The images were saved in 16-bit gray-scale multi-image TIFF format. Spot finding and data extraction was done using GenePix Pro 6 software (Axon/ Molecular Devices, Sunnyvale, CA) and a GAL format file describing the position and content of each spot created using the Gridder software connected to the Omnigrid 100 printer.
The extracted data were analyzed in the R statistical lan-guage http://www.r-project.org using the Limma package [55] of the BioConductor project [56]. Normalization for dye balance within arrays was done based on the color ratios of the non-polymorphic control spots and global loess normalization [57]. Replicate spots within arrays were handled using a correlation method [58]. A linear model was fitted to the log transformed color ratios of each probe, and an empirical Bayes approach was used to shrink the estimated sample variances towards a pooled estimate [59]. The R scripts used for the analysis are in Additional File 7.
Experimental verification of SFPs
The SFPs were experimentally verified by hybridization with DNA from each of the sequenced cultivars on four slides. DNA samples from cv. Nipponbare and cv. 93-11 were each labeled with Cy5 and Cy3. A dye swap design was used with Nipponbare labeled with Cy3 and 93-11 labeled with Cy5 on two of the slides and 93-11 labeled with Cy5 and Nipponbare labeled with Cy5 on the other two slides. The slides were normalized for color balance using median centering.
Polymorphism survey
A diverse panel of rice cultivars was genotyped using the microarrays. The panel included 21 accessions. There were four accessions from each of the five sub-populations of rice as previously established with microsatellite markers [27]. An accession of the Australian wild relative Oryza
Location of the five most significant SFP markers (ordered A-E) associated with blast resistance in the bulked segregant experiment
Figure 6
meridionalis was included as an out-group. Nipponbare DNA was used as a common reference, with one hybridi-zation per genotype. The slides were normalized for color balance using median centering. SFP markers were scored as the 93-11 allele (different from the reference) for a log-fold change greater than 1, and scored as the Nipponbare allele for a log-fold change less than 0.5 (same as the ref-erence). SFPs with intermediate log-fold changes were treated as missing data. Neighbor-joining trees were con-structed using the neighbor-joining algorithm in Power-marker [60] based on a shared allele distance matrix, and visualized using TreeView [61]. Population structure was inferred and site-by-site probabilities for the population of origin of alleles were calculated with the model-based clustering method STRUCTURE [26], using the linkage ancestry model with a burn-in of 100,000 and 100,000 MCMC replications. Site-by-site probabilities of alleles were plotted using GGT [62].
Bulked segregant analysis
A RIL population of 215 individuals derived from the blast resistant indica variety Sanhuangzhan 2 (SHZ) and the blast susceptible japonica variety Lijiangxin-tuan-heigu (LTH) was previously phenotyped for blast resistance [33]. The SHZ and LTH parents were genotyped by hybrid-ization to the microarrays with a dye-swap on two slides to determine which SFP markers are polymorphic in the RIL population. DNA samples from individual RILs were divided into two pools with 73 individuals each according to their levels of blast resistance. A dye swap design was used with six slides. The data were lowess normalized using all features. The chromosomal positions of the markers were assigned according to their locations on the rice pseudomolecules.
Abbreviations
Indel: insertion/deletion
Competing interests
The authors declare that they have no competing interests.
Authors' contributions
JDE carried out the bioinformatics for indel discovery, design of the oligonucleotide probes, and analysis of the microarray data, and drafted the manuscript, JJ developed the genomic labeling procedure, carried out the hybridiza-tion experiments, and drafted the materials and methods portion of the manuscript, MS designed primers sur-rounding the SFPs, and optimized a low-cost method for labeling of genomic DNA, ABK helped develop the proce-dure for labeling of genomic DNA and helped draft the manuscript, BL and HW produced the mapping popula-tions, carried out the phenotyping experiment, and helped draft the manuscript, DWG conceived of the study,
and participated in its design and coordination and helped to draft the manuscript.
Additional material
Acknowledgements
We thank Dr. Susan McCouch for supplying rice DNA samples, and Shao-hong Zhang and Xiaoyuan Zhu for assistance in phenotyping. This project was funded by a grant to DWG from the competitive grants program of the USDA (grant number USDA-CSREES-NRI 2005-35604-15327).
Additional File 1
Genomic locations of the 880 SFP oligonucleotide probes. Click here for file
[http://www.biomedcentral.com/content/supplementary/1746-4811-4-13-S1.xls]
Additional File 2
SFP genotype scores for rice accessions. A score of "1" indicates presence of the allele that is complementary to the probe sequence and a score of "0" indicates absence. Missing data are indicated by a "?" character. Click here for file
[http://www.biomedcentral.com/content/supplementary/1746-4811-4-13-S2.xls]
Additional File 3
Low Cost Labeling Method. Click here for file
[http://www.biomedcentral.com/content/supplementary/1746-4811-4-13-S4.doc]
Additional File 4
Sources of the positive, negative, and multi-copy control oligonucleotide probes.
Click here for file
[http://www.biomedcentral.com/content/supplementary/1746-4811-4-13-S3.doc]
Additional File 5
SFP discovery scripts. Click here for file
[http://www.biomedcentral.com/content/supplementary/1746-4811-4-13-S5.txt]
Additional File 6
Output of SFP discovery scripts. Click here for file
[http://www.biomedcentral.com/content/supplementary/1746-4811-4-13-S6.txt]
Additional File 7
R-scripts for data analysis. Click here for file
References
1. Chan EY: Advances in sequencing technology. Mutat Res 2005,
573:13-40.
2. Kumar LS: DNA markers in plant improvement: an overview.
Biotechnol Adv 1999, 17:143-182.
3. Southern EM, Maskos U, Elder JK: Analyzing and comparing nucleic acid sequences by hybridization to arrays of oligonu-cleotides: evaluation using experimental models. Genomics 1992, 13:1008-1017.
4. Winzeler EA, Richards DR, Conway AR, Goldstein AL, Kalman S, McCullough MJ, McCusker JH, Stevens DA, Wodicka L, Lockhart DJ, Davis RW: Direct Allelic Variation Scanning of the Yeast Genome. Science 1998, 281:1194-1197.
5. Wodicka L, Dong H, Mittmann M, Ho MH, Lockhart DJ: Genome-wide expression monitoring in Saccharomyces cerevisiae.
Nat Biotechnol 1997, 15:1359-1367.
6. Borevitz JO, Liang D, Plouffe D, Chang HS, Zhu T, Weigel D, Berry CC, Winzeler E, Chory J: Large-scale identification of single-fea-ture polymorphisms in complex genomes. Genome Res 2003,
13:513-523.
7. Hazen SP, Borevitz JO, Harmon FG, Pruneda-Paz JL, Schultz TF, Yanovsky MJ, Liljegren SJ, Ecker JR, Kay SA: Rapid array mapping of circadian clock and developmental mutations in Arabi-dopsis. Plant Physiol 2005, 138:990-997.
8. The International HapMap Consortium: A haplotype map of the human genome. Nature 2005, 437:1299-1320.
9. Kruglyak L: Prospects for whole-genome linkage disequilib-rium mapping of common disease genes. Nat Genet 1999,
22:139-144.
10. Reich DE, Schaffner SF, Daly MJ, McVean G, Mullikin JC, Higgins JM, Richter DJ, Lander ES, Altshuler D: Human genome sequence variation and the influence of gene history, mutation and recombination. Nat Genet 2002, 32:135-142.
11. Syvanen AC: Toward genome-wide SNP genotyping. Nat Genet 2005, 37:5-10.
12. Stickney HL, Schmutz J, Woods IG, Holtzer CC, Dickson MC, Kelly PD, Myers RM, Talbot WS: Rapid mapping of zebrafish muta-tions with SNPs and oligonucleotide microarrays. Genome Res 2002, 12:1929-1934.
13. Barczak A, Rodriguez MW, Hanspers K, Koth LL, Tai YC, Bolstad BM, Speed TP, Erle DJ: Spotted long oligonucleotide arrays for human gene expression analysis. Genome Res 2003,
13:1775-1785.
14. Schena M, Shalon D, Davis RW, Brown PO: Quantitative monitor-ing of gene expression patterns with a complementary DNA microarray. Science 1995, 270:467-470.
15. Kane MD, Jatkoe TA, Stumpf CR, Lu J, Thomas JD, Madore SJ:
Assessment of the sensitivity and specificity of oligonucle-otide (50 mer) microarrays. Nucleic Acids Res 2000,
28:4552-4557.
16. Jaccoud D, Peng K, Feinstein D, Kilian A: Diversity arrays: a solid state technology for sequence information independent gen-otyping. Nucleic Acids Res 2001, 29:E25.
17. Wenzl P, Carling J, Kudrna D, Jaccoud D, Huttner E, Kleinhofs A, Kil-ian A: Diversity Arrays Technology (DArT) for whole-genome profiling of barley. Proc Natl Acad Sci USA 2004,
101:9915-9920.
18. Xie Y, McNally K, Li CY, Leung H, Zhu YY: A high-throughput genomic tool: Diversity array technology complementary for rice genotyping. J Integr Plant Biol 2006, 48:1069-1076. 19. Yu J, Hu S, Wang J, Wong GK, Li S, Liu B, Deng Y, Dai L, Zhou Y,
Zhang X, Cao M, Liu J, Sun J, Tang J, Chen Y, Huang X, Lin W, Ye C, Tong W, Cong L, Geng J, Han Y, Li L, Li W, Hu G, Huang X, Li W, Li J, Liu Z, Li L, Liu J, Qi Q, Liu J, Li L, Li T, Wang X, Lu H, Wu T, Zhu M, Ni P, Han H, Dong W, Ren X, Feng X, Cui P, Li X, Wang H, Xu X, Zhai W, Xu Z, Zhang J, He S, Zhang J, Xu J, Zhang K, Zheng X, Dong J, Zeng W, Tao L, Ye J, Tan J, Ren X, Chen X, He J, Liu D, Tian W, Tian C, Xia H, Bao Q, Li G, Gao H, Cao T, Wang J, Zhao W, Li P, Chen W, Wang X, Zhang Y, Hu J, Wang J, Liu S, Yang J, Zhang G, Xiong Y, Li Z, Mao L, Zhou C, Zhu Z, Chen R, Hao B, Zheng W, Chen S, Guo W, Li G, Liu S, Tao M, Wang J, Zhu L, Yuan L, Yang H: A Draft Sequence of the Rice Genome (Oryza sativa L. ssp. indica).
Science 2002, 296:79-92.
20. Khush G: Productivity improvements in rice. Nutr Rev 2003,
61:S114-116.
21. Delcher AL, Kasif S, Fleischmann RD, Peterson J, White O, Salzberg SL: Alignment of whole genomes. Nucleic Acids Res
27:2369-2376.
22. Delcher AL, Phillippy A, Carlton J, Salzberg SL: Fast algorithms for large-scale genome alignment and comparison. Nucleic Acids Res 2002, 30:2478-2483.
23. Kurtz S, Phillippy A, Delcher AL, Smoot M, Shumway M, Antonescu C, Salzberg SL: Versatile and open software for comparing large genomes. Genome Biol 2004, 5:R12.
24. Ouyang S, Buell CR: The TIGR Plant Repeat Databases: a col-lective resource for the identification of repetitive sequences in plants. Nucleic Acids Res 2004, 32:360-363.
25. Cheng Z, Dong F, Langdon T, Ouyang S, Buell CR, Gu M, Blattner FR, Jiang J: Functional rice centromeres are marked by a satellite repeat and a centromere-specific retrotransposon. Plant Cell 2002, 14:1691-1704.
26. Falush D, Stephens M, Pritchard JK: Inference of population struc-ture using multilocus genotype data: linked loci and corre-lated allele frequencies. Genetics 2003, 164:1567-1587. 27. Garris AJ, Tai TH, Coburn J, Kresovich S, McCouch S: Genetic
structure and diversity in Oryza sativa L. Genetics 2005,
169:1631-1638.
28. Second G: Origin of the Genic Diversity of Cultivated Rice
(Oryza-Spp) – Study of the Polymorphism Scored at 40
Isoenzyme Loci. Jpn J Genet 1982, 57:25-57.
29. Glaszmann JC: Isozymes and Classification of Asian Rice Vari-eties. Theor Appl Genet 1987, 74:21-30.
30. Jain S, Jain RK, McCouch SR: Genetic analysis of Indian aromatic and quality rice (Oryza sativa L.) germplasm using panels of fluorescently-labeled microsatellite markers. Theor Appl Genet 2004, 109:965-977.
31. Michelmore RW, Paran I, Kesseli RV: Identification of markers linked to disease-resistance genes by bulked segregant anal-ysis: a rapid method to detect markers in specific genomic regions by using segregating populations. Proc Natl Acad Sci USA 1991, 88:9828-9832.
32. Benjamini Y, Hochberg Y: Controlling the false discovery rate: a practical and powerful approach to multiple testing. Journal of the Royal Statistical Society Series B 1995, 57:289-300.
33. Liu B, Zhang S, Zhu X, Yang Q, Wu S, Mei M, Mauleon R, Leach J, Mew T, Leung H: Candidate defense genes as predictors of quanti-tative blast resistance in rice. Mol Plant Microbe Interact 2004,
17:1146-1152.
34. McNally KL, Bruskiewich R, Mackill D, Buell CR, Leach JE, Leung H:
Sequencing multiple and diverse rice varieties. Connecting whole-genome variation with phenotypes. Plant Physiol 2006,
141:26-31.
35. Clark RM, Schweikert G, Toomajian C, Ossowski S, Zeller G, Shinn P, Warthmann N, Hu TT, Fu G, Hinds DA, Chen H, Frazer KA, Huson DH, Scholkopf B, Nordborg M, Ratsch G, Ecker JR, Weigel D: Com-mon sequence polymorphisms shaping genetic diversity in Arabidopsis thaliana. Science 2007, 317:338-342.
36. Hospital F: Size of donor chromosome segments around introgressed loci and reduction of linkage drag in marker-assisted backcross programs. Genetics 2001, 158:1363-1379. 37. Langridge P: Lessons from applying genomics to wheat and
barley improvement. In 5th International Rice Genetics Symposium: 19–23 November 2005; Manila, Philippines Edited by: Brar DS, Mackill DJ, Hardy B. Singapore: International Rice Research Institute; 2007:267-283.
38. Tanksley SD, Nelson JC: Advanced backcross QTL analysis: A method for the simultaneous discovery and transfer of valu-able QTLs from unadapted germplasm into elite breeding lines. Theor Appl Genet 1996, 92:191-203.
39. Eshed Y, Zamir D: An introgression line population of Lycoper-sicon pennellii in the cultivated tomato enables the identifi-cation and fine mapping of yield-associated QTL. Genetics 1995, 141:1147-1162.
40. Tanksley SD, McCouch SR: Seed banks and molecular maps: unlocking genetic potential from the wild. Science 1997,
277:1063-1066.
41. Thornsberry JM, Goodman MM, Doebley J, Kresovich S, Nielsen D, Buckler ES: Dwarf8 polymorphisms associate with variation in flowering time. Nat Genet 2001, 28:286-289.
42. Tenaillon MI, Sawkins MC, Long AD, Gaut RL, Doebley JF, Gaut BS:
chromo-Publish with BioMed Central and every scientist can read your work free of charge
"BioMed Central will be the most significant development for disseminating the results of biomedical researc h in our lifetime."
Sir Paul Nurse, Cancer Research UK
Your research papers will be:
available free of charge to the entire biomedical community
peer reviewed and published immediately upon acceptance
cited in PubMed and archived on PubMed Central
yours — you keep the copyright
Submit your manuscript here:
http://www.biomedcentral.com/info/publishing_adv.asp
BioMedcentral
some 1 of maize (Zea mays ssp. mays L.). Proc Natl Acad Sci USA 2001, 98:9161-9166.
43. Remington DL, Thornsberry JM, Matsuoka Y, Wilson LM, Whitt SR, Doebley J, Kresovich S, Goodman MM, Buckler ES: Structure of linkage disequilibrium and phenotypic associations in the maize genome. Proc Natl Acad Sci USA 2001, 98:11479-11484. 44. Malosetti M, Linden CG van der, Vosman B, van Eeuwijk FA: A
mixed-model approach to association mapping using pedi-gree information with an illustration of resistance to Phy-tophthora infestans in potato. Genetics 2007, 175:879-889. 45. Jiang N, Bao Z, Zhang X, Eddy SR, Wessler SR: Pack-MULE
trans-posable elements mediate gene evolution in plants. Nature 2004, 431:569-573.
46. Lai J, Li Y, Messing J, Dooner HK: Gene movement by Helitron transposons contributes to the haplotype variability of maize. Proc Natl Acad Sci USA 2005, 102:9068-9073.
47. Bruggmann R, Bharti AK, Gundlach H, Lai J, Young S, Pontaroli AC, Wei F, Haberer G, Fuks G, Du C: Uneven chromosome contrac-tion and expansion in the maize genome. Genome Res 2006,
16:1241.
48. Fu H, Dooner HK: Intraspecific violation of genetic colinearity and its implications in maize. Proc Natl Acad Sci USA 2002,
99:9573-9578.
49. Yuan Q, Ouyang S, Wang A, Zhu W, Maiti R, Lin H, Hamilton J, Haas B, Sultana R, Cheung F: The Institute for Genomic Research Osa1 Rice Genome Annotation Database. Plant Physiol 2005,
138:18.
50. Altschul SF, Gish W, Miller W, Myers EW, Lipman DJ: Basic local alignment search tool. J Mol Biol 1990, 215:403-410.
51. Chou CC, Chen CH, Lee TT, Peck K: Optimization of probe length and the number of probes per gene for optimal microarray analysis of gene expression. Nucleic Acids Res 2004,
32:e99.
52. Wallace RB, Shaffer J, Murphy RF, Bonner J, Hirose T, Itakura K:
Hybridization of synthetic oligodeoxyribonucleotides to phi chi 174 DNA: the effect of single base pair mismatch. Nucleic Acids Res 1979, 6():6353-6357.
53. Xu W, Bak S, Decker A, Paquette SM, Feyereisen R, Galbraith DW:
Microarray-based analysis of gene expression in very large gene families: the cytochrome P450 gene superfamily of
Ara-bidopsis thaliana. Gene 2001, 272:61-74.
54. Dellaporta SL, Wood J, Hicks JB: A plant DNA minipreparation: Version II. Plant Mol Biol Rep 1983, 1:19-21.
55. Smyth GK: Limma: Linear Models for Microarray Data. In Bio-informatics and Computational Biology Solutions using R and Bioconductor Edited by: Gentleman RC, Dudoit S, Irizarry R, Huber W. New York: Springer; 2005:397-420.
56. Gentleman RC, Carey VJ, Bates DM, Bolstad B, Dettling M, Dudoit S, Ellis B, Gautier L, Ge Y, Gentry J: Bioconductor: open software development for computational biology and bioinformatics.
Genome Biol 2004, 5:R80.
57. Smyth GK, Speed T: Normalization of cDNA microarray data.
Methods 2003, 31:265-273.
58. Smyth GK, Michaud J, Scott HS: Use of within-array replicate spots for assessing differential expression in microarray experiments. Bioinformatics 2005, 21(9):2067-2075.
59. Smyth GK: Linear models and empirical Bayes methods for assessing differential expression in microarray experiments.
Statistical Applications in Genetics and Molecular Biology 2004, 3:3. 60. Liu K, Muse SV: PowerMarker: an integrated analysis
environ-ment for genetic marker analysis. Bioinformatics 2005,
21:2128-2129.
61. Page RD: TreeView: an application to display phylogenetic trees on personal computers. Comput Appl Biosci 1996,
12:357-358.