Iranian Journal of Electrical and Electronic Engineering, Vol. 15, No. 3, September 2019 375
A Three-Dimensional Analysis of Silicone Rubber Insulators
Under Different Environmental Conditions Considering the
Corona Rings Effect
S. Hajiaghasi*, Z. Rafiee*(C.A.), A. Salemnia* and T. Soleymani Aghdam*
Abstract: Since the insulators of transmission lines are exposed to different environmental conditions, it is important task to study insulators performance under different conditions. In this paper, silicone rubber insulators performance under different environmental conditions including rainy, icy, salt and cement are proposed and exactly is studied. Electric fields (E-fields) and voltage distributions along the insulator under various conditions have been evaluated. Moreover, the corona rings effects on insulator performance under these conditions have been presented. A 230 kV silicone rubber insulator is selected, modeled and simulated with finite element method (FEM) using the COMSOL software. The simulation is repeated for different environmental conditions and efficiency of corona ring for each scenario is evaluated. The results indicate that environmental conditions have a significant effect on the insulator performance and the corona ring somewhat alleviate the adverse effect of environmental conditions on the insulator performance.
Keywords: Corona Ring, Electric Field, Finite Element Method (FEM), Insulator, Potential Distribution, Rubber Insulator.
1 Introduction1
IGH-VOLTAGE lines and substations insulators are one of the most important components for safe and secure electric power transmission [1]. Generally, high-voltage insulators are constructed from glass, porcelain, and silicone rubber [2] where the silicone rubber insulators are currently used due to its superiority in comparison with porcelain and glass insulators [3, 4]. However due to the weak bonds of polymer materials, silicone rubber insulators are more vulnerable and susceptible to chemical changes [5]. The effects of electric and environmental stresses such as the energizing voltage, corona, arcing, and pollution causes the insulator to be damaged and aged. Moreover, various weather conditions play several roles in the flashover and aging of silicone rubber insulators they
Iranian Journal of Electrical and Electronic Engineering, 2019. Paper first received 31 October 2018 and accepted 06 February 2019. * The authors are with the Faculty of Electrical Engineering, Shahid Beheshti University (SBU), Tehran, Iran.
E-mails: [email protected], [email protected],
[email protected] and [email protected]. Corresponding Author: Z. Rafiee.
cause to increase electric field intensity at the insulator surface [6]. If the electric field (E-field) in any regions on the insulators exceeds critical values, flashover may occur in the insulator [7].
Water droplets, icicle, rainy and foggy weather, environment pollution such as salt, and cement increase E-field in some parts on the insulators [8]. Calculation of stress levels on an insulator exposed to different environment, provides an important insight into the safety measures pertaining. Silicone rubber based polymeric insulators long term performance under DC stress with controlled climatic conditions is investigated in [13]. The results show that the loss of insulation properties, degradation of material properties in both bulk and surface level is detected. Color fading mechanism of high transmission line silicone rubber is investigated in [14], where the results indicate a positive correlation between silicone rubber’s microstructural change and color fading. The development of leakage current on vertical and horizontal strings of room temperature vulcanized coated porcelain suspension insulators in salt-fog chamber are presented in [15]. Horizontal strings temporarily lose their hydrophobicity and leakage current develops which is somewhat higher
H
Iranian Journal of Electrical and Electronic Engineering, Vol. 15, No. 3, September 2019 376 for alumina-trihydrate filled than silica filled coatings
which could lead to flashover at a higher salinity. Corona rings improve insulator performance in several ways as, audible noise reduction, uniform E-field distribution and decrease in maximum E-field intensity [9]. Corona rings are usually used at both ends of silicone rubber insulators at voltage levels higher than 345 kV [10, 11]. Moreover, dimensions and the locations of the corona rings significantly impacts the E-field distributions and some studies have been conducted to find the optimum tuning parameters of corona rings for a typical insulator [12]. Despite the different methods being applied, FEM-based software is mostly used for potential and E-field distribution calculation along insulators even [16, 17]. A two-dimensional FEM has been used for simulation of E-field distribution on ceramic insulators [18]. In [20] FEM-based software has been used to study the E-field and potential distribution of different types of porcelain disc insulators.
In this paper, a three-dimensional model is used to analyze the distribution of the E-field intensity and potential on the insulator under various conditions. Although several papers have been devoted to the distribution of E-field and potential in insulators, none of them studied the rainy, icy, salt, and cement pollution conditions along with the corona ring. The distribution of the electric field and the potential on a silicone rubber insulator with and without the effect of the corona ring is analyzed to derive its impact for different conditions. Moreover, the impact of one and two corona rings on potential and E-field have been explored and compared during normal and various environmental conditions. COMSOL software has been used to evaluate the potential distribution and E-field intensity of silicone rubber insulators which includes a piece of a deteriorated insulator in the 230 kV transmission lines. The remaining of this paper is organized as follows: In Section 2, the FEM principals is presented and explained. The simulation results and findings are described in Sections 3 4, and 5. Finally, this paper conclusion is presented in Section 6.
2 FEM Principals
Environmental and atmospheric conditions impact the electric field distribution along insulators, as inappropriate environmental conditions create corona on insulators causing electrical discharge on the insulator which ultimately leads to insulator failure.
2.1 Modeling the Insulator
3D FEM is used for insulator modeling under various conditions. FEM is a powerful computational analytical method for solving continuous problems in different engineering disciplines. Using variety of mathematical
theorems, a discrete differential equation with given conditions for an E-field, FEM produces a linear/nonlinear system of equations which should be solved. FEM proceeds from following step to build and solve the equations to calculate E-field:
Step 1- Drawing of the insulator geometry Step 2- Meshing of the geometry
Step 3- Determination of material type Step 4. Determination of boundary conditions Step 5. Solving the problem
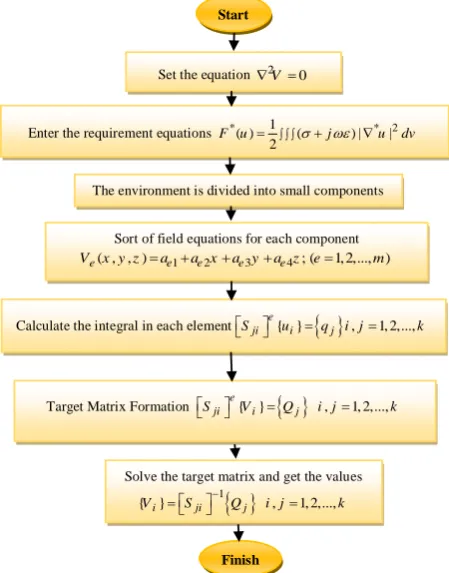
E-field distribution is directly obtained by minus gradient of electric potential distribution. The partial differential equation that describes the voltage potential distribution within any given region is derived as flowchart shown in Fig. 1. The various parameters and variables in the flowchart are presented in Appendix 1.
3 Insulator Modeling and Simulation
The FEM method is a powerful modeling and simulation tools which achieves a high resolution compared to other modeling and simulation tools because this method divides the model into small parts in which every parts with considering the different boundary conditions are solved. Another advantage of the FEM is ability to examine various parameters of the insulator including electrical fields, potential, field lines, current, and other parameters. In this paper, a 230 kV
Flowchart of E-field distribution calculation in COMSOL Start
Set the equation 2V0
Enter the requirement equations *( ) 1 ( ) | * |2 2
F u j u dv
The environment is divided into small components
Sort of field equations for each component
1 2 3 4
( , , ) ; ( 1, 2,..., )
e e e e e
V x y z a a xa ya z e m
Calculate the integral in each elementSjie{ }ui
qj
i j, 1, 2,...,kTarget Matrix Formation Sjie{Vi}
Qj
i j, 1, 2,...,kSolve the target matrix and get the values
1
{Vi}Sji Qj i j, 1, 2,...,k
Finish
Fig. 1 Flowchart of E-field distribution calculation in COMSOL software.
Iranian Journal of Electrical and Electronic Engineering, Vol. 15, No. 3, September 2019 377
Fig. 2 Dimensions of the insulator intended for analysis.
Table 1 Different parameters of the under study insulator. Specifications of the insulator intended for performance evaluation
Rated Voltage 230 kV
The Maximum Voltage 245 kV
Tolerable Load value 160 kN
Tolerable Impulse Voltage 1100 kV
Tolerable Voltage in Frequency Power 480 kV
Fig. 3 Meshing insulator in the software environment.
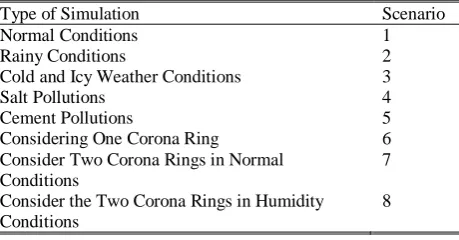
Table 2 Different simulation scenarios.
Type of Simulation Scenario
Normal Conditions 1
Rainy Conditions 2
Cold and Icy Weather Conditions 3
Salt Pollutions 4
Cement Pollutions 5
Considering One Corona Ring 6
Consider Two Corona Rings in Normal Conditions
7
Consider the Two Corona Rings in Humidity Conditions
8
silicone rubber insulator having relative dielectric constant of 4.3 is selected for analysis. Dimensions of the insulator are given in Fig. 2 and Table 1 shows the parameters of the insulator.
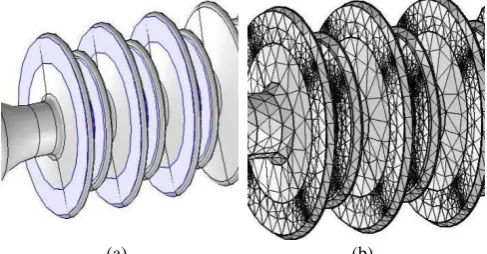
In order to model and examine the various parameters in FEM software, the model must be drawn up as 3D with high accuracy. SOLID WORK software is used to accurate drawing of the model. In this analysis, shells and core of the insulator are modeled with silicone rubber material and initials and ends of the insulator are modeled using iron. In order to model the different conditions, different materials have been used according to the pollutions and a box is intended to create it. The insulator modeling in COMSOL software is shown in Fig. 3. Fortunately, COMSOL software can create geometry mesh for different amounts of mesh. Moreover, in typical cases, the mesh size can be made smaller in certain areas to provide more accurate responses.
4 Insulator Analysis Under Variuse Conditions
The insulator has been studied for different conditions which are presented in Table 2.
4.1 Normal Condition
For the first mode, the insulator is simulated in normal operation mode. In this case, 230 kV applied to conductor connection point to the insulator. The
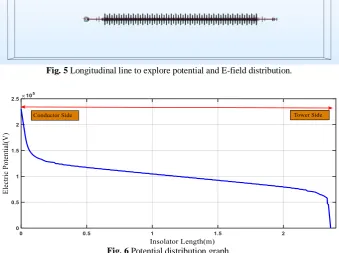
potential distribution over the insulator is shown in Fig. 4(a). It is clear that the conductor potential at the connection point is maximum and the tower potential at the connection point is zero. Also, the E-field lines along the insulator are shown in Fig. 4(b). In order to study the potential and E-field along the insulator, a line along the insulator is assumed similar to Fig. 5. Fig. 6 shows the potential distribution along the insulator. The potential at the conductor side is equal to the rated voltage of the line and the potential is reduced by approaching the connection to the tower. As seen, the potential distribution along the insulator is symmetrical.
4.2 Water Droplets Effects on Insulator Performance
Study of E-field and potential distribution along silicone rubber insulators under humidity conditions is very important for a deep understanding of flashover mechanism. However, the rain water is pure, its combination with background pollutions can create problems on insulator. The modeling of water drops on insulator surface is shown in Fig. 7. In this study E-field lines along the insulator in normal condition and in presence of the water droplets are given in Fig. 8. Table 3 shows the properties of the materials such as relative permittivity, conductivity and thickness of pollution layer and water droplets used for simulation.
Iranian Journal of Electrical and Electronic Engineering, Vol. 15, No. 3, September 2019 378 (a)
(b)
Fig. 4 a) Potential distribution along the insulator and b) E-field intensity and field lines distribution along the insulator.
Fig. 5 Longitudinal line to explore potential and E-field distribution.
Fig. 6 Potential distribution graph. As shown in Figs. 8(a) and 8(b), water droplets distort
the E-field along the insulator. The E-field near the tower and conductor connection point are higher. The presence of a water droplet causes significant deviation
in the arrangement of potential lines and the E-field direction around the droplet. For the simulated sheds, the E-field intensity has increased at the top of the water droplet.
Iranian Journal of Electrical and Electronic Engineering, Vol. 15, No. 3, September 2019 379
Table 3 Material properties of FEM model.
Properties Silicone Rubber Iron Pollution Layer Water Droplet Icicle (Ice) Air Salt Cement
Permittivity εr 6 1 8 81 70 1.02 3 12
Conductivity 1×10-14 1.12×10⁻⁷ 100 500 1 0 17.6 25
Thickness – – 100 μm 2 mm Variable – 100 μm 100 μm
Fig. 7 Modeling of water droplets on the insulator.
(a) (b)
Fig. 8 a) E-field lines in the insulator in normal conditions and b) E-field lines in presence of the water droplets.
Fig. 9 Modeled icicles on the insulator shed. Fig. 10 Potential distribution along the insulator in icy condition. Water droplets composed environmental pollution
play a major role in flashover and aging of silicone rubber insulators, which include:
Droplets increase the electric field due to its high conductivity and permittivity.
Corona of surface water droplets causes the aging of the insulator sheds.
Corona discharge eliminates the hydrophobic property of parts of the surface and causes the expansion of droplets and their joining.
4.3 Cold and Icy Conditions
In this section, the modeling of the insulator is carried out under cold and icy conditions. The detailed parameters of icicles used in simulation are given in Table 3 and the layout is depicted in Fig. 9.
The potential distribution along the insulator for this
mode is given in Fig. 10. In general, high amount of ice and water around the conductor affects the potential magnitude around the insulator, and the severity of this effect depends on the pollution degree of ice and air. Moreover, icicles location plays a vital role where going far from the conductor, the icicles impact on potential distribution is minimized.
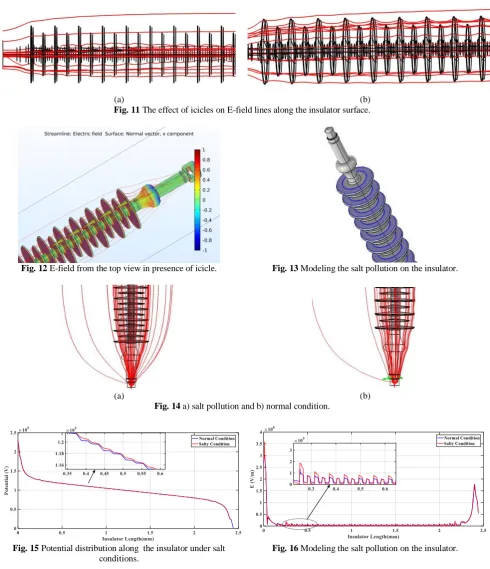
Figs. 11 and 12 show the field lines around the icicles. For this study, the icicle dielectric constant is considered to be 2/3. As can be seen, it is clear that the E-field lines around the icicle have increased. In icy conditions, the E-field intensity has a significant increase in vicinity of icicles on the insulator surface which leads to corona.
4.4 Salt Pollution Condition
When the transmission lines cross the areas with salt pollution, insulator performance can be decreased.
Iranian Journal of Electrical and Electronic Engineering, Vol. 15, No. 3, September 2019 380 According to Fig. 13, salt pollution on the insulator has
been considered on a few of the insulator sheds because of many number of the insulator sheds. In the following, relative permittivity, conductivity and thickness of the salt on the insulator has been given in Table 3.
The electric field lines distribution around the sheds are presented in Fig. 14. It is observed that electric field
is concentrated towards the polluted sheds. The potential distribution along the insulator for salt pollution is presented in Fig. 15. As seen, the potential around salt points has increased. The electric field lines along the horizontal line are plotted and compared in Fig. 16. Similar result is derived as the E-field is increased near the polluted sheds.
(a) (b)
Fig. 11 The effect of icicles on E-field lines along the insulator surface.
Fig. 12 E-field from the top view in presence of icicle. Fig. 13 Modeling the salt pollution on the insulator.
(a) (b)
Fig. 14 a) salt pollution and b) normal condition.
Fig. 15 Potential distribution along the insulator under salt conditions.
Fig. 16 Modeling the salt pollution on the insulator.
Iranian Journal of Electrical and Electronic Engineering, Vol. 15, No. 3, September 2019 381 The electric fields on the salted surface are also
presented in Fig. 17. It can be seen that the electrical electric field around the salted levels of the insulator has increased relatively.
4.5 Cement Factories Pollution
This section investigates the cement factories pollution. The detailed parameters of modeled cement layers is given in Table. 3. Fig. 18 illustrates the cement polluted insulator. Fig. 19 shows the electric field lines along the insulator. Also, Fig. 20 shows electric field lines around the insulator in detail and Fig. 21 shows the electric field distribution along the insulator. By comparing these shapes with the insulator in normal condition, the electric field has been increased over the
cement pollution.
A comparison has been made between the increased electric field intensity in cement pollution and normal conditions which is shown in Fig. 22. It is clear that the increase of the E-field intensity along the insulator is not uniform due to the polluted sheds near conductor. Table 4 shows the approximate percentage of E-field increase for this type of contamination.
5 Corona Ring Effect on Insulator
Corona ring affects the insulator performance because of impact on E-field distribution. In the following, corona ring effects on the insulator in presence of several type of environmental pollution are perused.
(a) (b)
Fig. 17 Fields around the salt layers. Fig. 18 a) modeling of cement pollution and b) meshing on the insulator.
(a) (b)
Fig. 19 Electric field along the insulator for cement pollution: a) Infected mode and b) Healthy mode.
Fig. 20 Lines and magnitude of the electric field lines along the insulator for cement pollution.
(a) (b)
Fig. 21 Electric field along the insulator for cement pollution: a) Infected mode and b) Healthy mode.
Fig. 22 Electric field intensity for conventional conditions and for cement polution.
Iranian Journal of Electrical and Electronic Engineering, Vol. 15, No. 3, September 2019 382 5.1 Investigation of the Insulator by Considering the
One Corona Ring
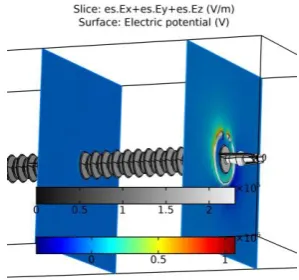
In this section, the corona ring impact on the rainy and icy conditions is investigated. One corona ring is considered on the conductor side of insulator as shown in Fig. 23(a). The potential distribution along the insulator is given in Fig. 23(b). As depicted in Fig. 23(b) potential distribution along the insulator is uniform.
Fig. 24 shows the E-field lines around the insulator. Once the corona ring is setup on the insulator, the E-field lines diverge from the sides of the sheds and towards the ring. Thus, the E-field intensity decreases on the sheds near the conductor connection point. E-field intensity reduction can prevent damage to the insulator.
Corona ring performance in adverse weather condition is also studied. Fig. 25 represents the insulator under the cover of icicles with a single corona ring. The resultant electric field distribution along the insulator indicates that the amount of E-field around the icicle has decreased compared to insulator in which has not been used the corona ring.
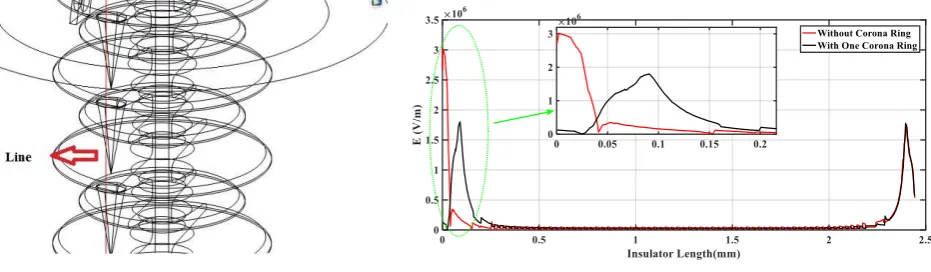
For precise investigation of icicle effects on the insulator, E-field distribution has been compared for two states i.e. with and without one corona ring installation. A hypothetical line on the icicle, as shown in Fig. 25 has been considered for both cases. Fig. 26 shows the absolute value (|Ex+Ey+Ez|) of the E-field
intensity. By comparing the E-field for two cases in presence of corona ring, the E-field intensity has decreased.
5.2 Investigation of the Insulator by Considering the Two Corona Ring
In this section, the modeling of the insulator is performed with two corona rings in which a ring on the conductor side and a ring on the tower side are considered. Fig. 27 shows E-field lines along the insulator with two corona rings.
The numerical value of the E-fields along the insulator in presence one corona ring in the conductor side is given in Fig. 28. As it can be seen, the E-field intensity along the corona ring is larger than both sheds and the surrounding rod.
Table 4 the percentage increase in the electric field of the insulator in the longitudinal direction. Environmental Conditions Number of Corona Rings Increasing in the Intensity of the Electric Field
Cement Pollution – 25%
Ordinary Weather – Criterion
(a) (b) (a) (b)
Fig. 23 a) considering the corona ring on the conductor side and b) distribution of potential in the insulator.
Fig. 24 E-field lines around the insulator: a) with corona ring and b) without corona ring.
Fig. 25 Modeling the icicle on the insulator with respect to the corona ring.
Fig. 26 Absolute of E-field intensity along the insulator with a corona ring.
Iranian Journal of Electrical and Electronic Engineering, Vol. 15, No. 3, September 2019 383 5.3 Modeling and Analysis of Two Corona Loops in
High Humidity Conditions
When there is fog, the moisture is high. This moisture can decrease insulator performance. In such cases, two corona rings are used on the insulators and investigated insulator performance in presence of fog. In this section, an insulator modeling is carried out under high humidity conditions. E-field lines distribution in Fig. 29(a) and potential distribution along the insulator are shown in Fig. 29(b).
In order to better investigate effects of the corona ring, the insulator with and without two corona rings ring has been compared in high humidity condition. Fig. 30, the absolute value (|Ex+Ey+Ez|) of E-field distribution
described in the previous sections is drawn up. It is known that the E-field intensity is decreased in spite of the presence high humidity conditions.. According to E-field distribution, using the corona rings, the insulator performance improves in different environmental conditions that this improvement will depend on different factors, such as pollution type, air humidity and other parameters.
In the following, the comparison of the E-field intensity along the insulator with one and two corona rings is given in Table 5. With regard to the results, it is clear that when the corona ring is used, the E-field intensity decreases in polluted points in cold weather conditions. This reduction in the conductor side when using one corona ring and in the conductor side and tower side when using two corona rings occur. Depending on the results, it is clear that regardless of economic issues, the use of corona rings on both sides of the insulator improves the insulator performance under different polluted conditions of.
6 Conclusions
In this paper, the accurate performance analysis of the silicone rubber insulators is studied for normal and different weather conditions. With regard to the results, the weather situation and pollution change the potential distribution significantly along the insulator surface which depends on the amount of capacitors formed on the insulator sheds but this change is not as large as the electric field. Moreover, according to the results, it is
(a) (b)
Fig. 27 E-field lines around the conductor and tower for the insulator with two corona rings.
Fig. 28 Numerical value of the E-field around the conductor with two corona rings.
(a) (b)
Fig. 29 a) distribution of E-fieldlines in an insulator with two corona rings and b) potential distribution along the insulator with
two corona rings.
Fig. 30 E-field distribution along the insulator with 2 corona rings.
Table 5 The percentage reduction in E-field intensity using the corona ring. Environmental Conditions Number of
Corona Rings
Reduced E-field Intensity on Conductor Side
Reduced E-field Intensity on Tower Side
Cold Weather 1 150% 0%
Cold Weather 2 250% 30%
Iranian Journal of Electrical and Electronic Engineering, Vol. 15, No. 3, September 2019 384 clear that pollution has a direct impact on the shape and
density of the E-field. In other words, due to changes in environmental conditions and environmental pollution increase, the E-fields distribution along the insulator has changed in which the E-field intensity increases in polluted points caused a flashover on the insulator. According to the results, it is clear that icy and rainy condition has a direct impact on the shape and intensity of the E-field lines. The increase in icy pollution on the insulator is caused the increased of E-field intensity in polluted points. Using corona rings at low voltage levels in the mentioned conditions, can be reduced the of polluted effects on the E-field intensity along the insulator. The results of this research can be used to design and maintenance insulators.
Appendix 1
Abbreviations of Fig. 1.
σ Tangent of the dielectric loss.
Ε Dielectric constant of dielectric material.
ω Angular frequency.
ae1, ae2, ae3 Computational coefficients for a triangle
element e.
Qj the vector of free terms
Ve(x,y) Computational coefficient for a triangle
element e and m.
{ui} Vector of unknown potentials at the knots.
F(v) Cartesian system of coordinates.
References
[1] J. M. Lowe, M. Secklehner, and V. Hinrichsen, “Investigation of surface charges on polymeric insulators and the influence of sessile water droplets,” in 13th International Electrical Insulation
Conference (INSUCON), pp. 1–7, 2017.
[2] S. Asokan and M. Ravindran, “Analysis and modeling of thermal plant pollution performance in high tension ceramic post insulator with Epoxy Resin coatings,” in Third International Conference on Advances in Electrical, Electronics, Information, Communication and Bio-Informatics (AEEICB), pp. 306–310, 2017.
[3] E. S. M. El-Refaie, M. K. Abd Elrahman, and M. K. Mohamed, “Electric field distribution of optimized composite insulator profiles under different pollution conditions,” Ain Shams Engineering Journal, Oct. 2016.
[4] Y. Gao, X. Liang, Y. Liu, W. Bao, S. Li, and C. Wu, “Effect of electrical stress on glass fiber reinforced polymer used in high voltage composite insulator under wet environment,” Composites Science and Technology, Vol. 155, pp. 151–159, Feb. 2018.
[5] L. Cheng, R. Liao, L. Yang, and F. Zhang, “An optimized infrared detection strategy for defective composite insulators according to the law of heat flux propagation considering the environmental factors,” IEEE Access, Vol. 6, pp. 1–1, 2018.
[6] I. A. Joneidi, A. A. Shayegani, and H. Mohseni, “Electric field distribution under water droplet and effect of thickness and conductivity of pollution layer on polymer insulators using finite element method,” International Journal of Computer and Electrical Engineering, Vol. 5, No. 2, pp. 266–270, 2013.
[7] A. Kumar, A. Shashikala, “Electric field modelling of composite high voltage insulators,” in Annual IEEE India Conference, pp. 1–4, 2009.
[8] W. Que and S. A. Sebo, “Electric field and potential distributions along non-ceramic insulators with water droplets,” in Proceedings: Electrical Insulation Conference and Electrical Manufacturing and Coil Winding Conference (Cat. No. 01CH37264), pp. 441–444, 2001.
[9] S. Ilhan, A. Ozdemir, and H. Ismailoglu, “Impacts of corona rings on the insulation performance of composite polymer insulator strings,” IEEE Transactions on Dielectrics and Electrical Insulation, Vol. 22, No. 3, pp. 1605–1612, Jun. 2015.
[10]A. J. Phillips, J. Kuffel, A. Baker, J. Burnham, A. Carreira, E. Cherney, W. Chisholm, M. Farzaneh, R. Gemignani, A. Gillespie, and T. Grisham, “Electric fields on AC composite transmission line insulators,” IEEE Transactions on Power Delivery, Vol. 23, No. 2, pp. 823–830, Apr. 2008.
[11]IEEE Power Engineering Society. Transmission and Distribution Committee, Institute of Electrical and Electronics Engineers, and IEEE-SA Standards Board, IEEE guide for application of composite insulators. Institute of Electrical and Electronics Engineers, 2002.
[12]J. Li, Z. Peng, Y. Feng, X. Fu, and T. Xie, “Electric field calculation and grading ring optimization of composite insulator for 500kV AC transmission lines,” in 10th IEEE International Conference on
Solid Dielectrics, pp. 1–4, 2010.
[13]A. R. Verma and B. S. Reddy, “Aging studies on polymeric insulators under DC stress with controlled climatic conditions,” Polymer Testing, Vol. 68, pp. 185–192, Jul. 2018.
[14]Y. Xia, X. Song, Z. Jia, and X. Wang, “Mechanism and quantitative characterization of color fading phenomenon of HTV composite insulators silicone rubber,” in 12th International Conference on the
Properties and Applications of Dielectric Materials (ICPADM), pp. 748–751, 2018.
Iranian Journal of Electrical and Electronic Engineering, Vol. 15, No. 3, September 2019 385 [15]S. Ilhan and E. A. Cherney, “Comparative tests on
RTV silicone rubber coated porcelain suspension insulators in a salt-fog chamber,” IEEE Transactions on Dielectrics and Electrical Insulation, Vol. 25, No. 3, pp. 947–953, Jun. 2018.
[16]R. D. Palhade, V. B. Tungikar, G. M. Dhole, and S. M. Kherde, “Simulation of structural, thermal and electrical load for high voltage ceramic cap and pin disc insulator assembly,” International Journal of Manufacturing, Materials, and Mechanical Engineering (IJMMME), Vol. 3, No. 1, pp. 66–79, Jan. 2013.
[17]M. Ashouri, M. Mirzaie, and A. Gholami, “3-D FEM calculation of potential distribution along porcelain string insulators,” International Journal on Engineering Applications (IREA), Vol. 1, No. 3, pp. 194–200, May 2013.
[18]T. Zhao and M. G. Comber, “Calculation of electric field and potential distribution along nonceramic insulators considering the effects of conductors and transmission towers,” IEEE Transactions on Power Delivery, Vol. 15, No. 1, pp. 313–318, 2000.
[19]B. Subba Reddy, N. A. Sultan, P. M. Monika, B. Pooja, O. Salma, and K. Ravishankar, “Simulation of potential and electric field for high voltage ceramic disc insulators,” in 5th International
Conference on Industrial and Information Systems, 2010, pp. 526–531.
S. Hajiaghasi was born in Qazvin, Iran, in 1987. He is currently Ph.D. student of Electrical Engineering at Shahid Beheshti University, Tehran, Iran. His research interests include power electronic, electrical machines, renewable energy and microgrids.
Z. Rafiee received her B.Sc. degree in Power Electricity Engineering from the Department of Electrical Engineering, Bu Ali Sina University, Hamadan Iran, in 2006 and M.Sc. degree in Power Electricity Engineering from the Department of Electrical Engineering, Bu Ali Sina University, Hamadan Iran, in 2010. She studies Ph.D. in Electrical Engineering in Shahid Beheshti University. Her research interests are in stability in power system, protection of network, optimization control algorithms, power system stabilizer and, distributed generation, application of neural network and fuzzy logic in electricity.
A. Salemnia received the B.Sc. and M.Sc. degrees from Iran University of Science and Technology (IUST), Tehran, Iran, in 1983 and 1990, respectively, and the Ph.D. degree from Polytechnic Institute of Lorraine (INPL), France, in 1996, all in Electrical Engineering. He joined Shahid Beheshti University, Tehran, Iran, in 1990, where he is currently an Assistant Professor. His research interests include power quality, harmonics and active filtering.
T. Soleymani Aghdam received his B.Sc. and M.Sc. degree in Power Electrical Engineering from Amirkabir University of Technology and Shahid Beheshti University, Tehran, Iran in 2009 and 2012 respectively. He is currently pursuing his Ph.D. program in Electrical Engineering Department of Shahid Beheshti University. His research interest includes power system relaying and protection, active distribution networks and microgrids.
© 2019 by the authors. Licensee IUST, Tehran, Iran. This article is an open access article distributed under the terms and conditions of the Creative Commons Attribution-NonCommercial 4.0 International (CC BY-NC 4.0) license (https://creativecommons.org/licenses/by-nc/4.0/).