www.astesj.com
Power-Energy Simulation for Multi-Core Processors in
Bench-marking
Mona A. Abou-Of*,1, Amr A. Sedky2, Ahmed H. Taha2
1Assistant Professor, Department of Computer Engineering, Pharos University in Alexandria, Alexandria, Egypt 2Undergraduate Student, Department of Computer Engineering, Pharos University in Alexandria, Alexandria, Egypt
A R T I C L E I N F O A B S T R A C T
Article history:
Received: 21 December, 2016 Accepted: 19 January, 2017 Online: 28 January 2017
At Microarchitectural level, multi-core processor, as a complex System on Chip, has sophisticated on-chip components including cores, shared caches, interconnects and system controllers such as memory and ethernet controllers. At technological level, architects should consider the device types forecast in the International Technology Roadmap for Semiconductors (ITRS).
Energy simulation enables architects to study two important metrics simultaneously. Timing is a key element of the CPU performance that imposes constraints on the CPU target clock frequency. Power and the resulting heat impose more severe design constraints, such as core clustering, while semiconductor industry is providing more transistors in the die area in pace with Moore’s law. Energy simulators provide a solution for such serious challenge.
Energy is modelled either by combining performance benchmarking tool with a power simulator or by an integrated framework of both performance simulator and power profiling system.
This article presents and asses trade-offs between different architectures using four cores battery-powered mobile systems by running a
custom-made and a standard benchmark tools. The experimental results assure the Energy/ Frequency convexity rule over a range of frequency settings on different number of enabled cores.
The reported results show that increasing the number of cores has a great effect on increasing the power consumption. However, a minimum energy dissipation will occur at a lower frequency which reduces the power consumption. Despite that, increasing the number of cores will also increase the effective cores value which will reflect a better processor performance.
Keywords :
Multi-Core Processors Energy simulator Power Profiling Systems Performance Benchmarks Convexity Rule
System Clock Speed
1
Introduction
Microprocessor performance has helmed its indus-try for four decades. Reducing power consumption has become a stringent design principle especially for battery-driven devices. Limiting the increase in CPU clock frequency, because of low-power constraints and high energy efficiency, has become a real chal-lenge for improving microprocessor performance over the next generation. So, other aspects in microproces-sor architecture (Instruction Set) and compilers
opti-mizations have to be considered in order to optimize the offered workload. In addition, other factors in mi-croprocessor hardware implementation must be taken into account in order to speed up this workload exe-cution time such as using many cores.
In this paper, we make the case for exploring the trade-off between low power and energy efficiency over a wide range of clock frequencies. We do the experiments on different battery-powered Laptops and Smartphones in [1] on a single core. We en-face two problems: the choice of power
measure-*Mona A. Abou-Of, [email protected]
ment tools and the choice of performance bench-mark tools. An accurate reliable power measure-ment software has to be selected in such a way to be running on Linux platform for Laptop devices like Powerstat (Power consumption calculator for Ubuntu Linux. Available: http://www.hecticgeek.com), or running on Android platform for Smartphones like Powertutor [2]. To capture the transitions be-tween power states, two different finite state ma-chines (FSM) based power modeling scheme [3] are implemented: The standard CoreMark benchmark (Industry-standard benchmarks for embedded sys-tems. Available: http://www.eembc.org/coremark), executed on Linux OS, represents a disk with tail power state model that writes the running power on a disk file and stays at high power state for a pe-riod after the active I/O activity. The custom-made Fibonacci benchmark, written with Java on Android, represents a free model that returns to the base state without inactivity period.
In summary, this paper makes the following contribu-tions:
• We make laboratory experiments for explor-ing the relationship between processor perfor-mance, power consumption and energy effi -ciency over a range of clock frequencies on dif-ferent number of enabled cores.
• We represent the experimental setup in order to obtain reliable results.
• We represent a detailed implementation on dif-ferent laptops and Smartphones operating sys-tems.
• The plotted results assure that minimum energy dissipation is always achieved even with diff er-ent workloads, and at a certain clock frequency but with a limited performance, lower power consumption and without optimization realiza-tion.
• We have proved the Energy/ Frequency convex-ity rule on multi-core (instead of one core) pro-cessors [4].
• Such observations can be fed into an intelligent DVFS scheduling, power management module of an operating system, on multi-core proces-sors, which can achieve energy and power sav-ings without impacting the performance.
• We have proved that increasing number of cores has a great effect on increasing the power con-sumption. However, a minimum energy dissi-pation will occur at a lower frequency which reduces the power consumption. Despite that, increasing the number of cores will also increase the effective cores value which will reflect a bet-ter processor performance.
The rest of this paper is organized as follows: Section 2 presents the existing energy modeling
approaches. Section 3 formulates the problem with some equations. In section 4 the experi-mental results are evaluated and analyzed. Fi-nally, section 5 concludes the paper.
2
Related Work
Most of the existing system energy modeling ap-proaches combine between power profiling sys-tems and performance benchmark tools. SPEC has developed SPECpower ssj2008 (S.P.E. Cor-poration. specpower ssj2008 benchmark suite. Available: http://www.spec.org/power ssj2008) focusing on server computer consumption, and EEMBC has introduced EnergyBench
establish-ing a framework for adding energy to the
metrics of the EEMBC’s performance bench-marks (E.T.E.M.B. Consortium. energybench ver-sion 1.0 power/energy benchmarks. Available: http://www.eembc.org/benchmark/power sl.php). McPAT [5] is a fully-integrated power, area and tim-ing modeltim-ing framework. It models all types of power dissipation and provides an integrated solution for multithreaded and multi-core processors. McPAT power modeling is combined with Sniper perfor-mance simulation in [6].
2.1
Power Profiling Systems
Existing power measurement methods are
lim-ited in two ways. First, some systems
[3,7,8] and Monsoon power monitor (Available: http://www.msoon.com/LabEquipment/PowerMonitor) generate their models by using external hardware lab equipments like sensors, meters, and data acquisi-tion devices. Second, other systems like Powerstat, [2,9,10] are self-modeling. They construct their mod-els without external circuitry. They use built-in bat-tery sensors or the smart batbat-tery interface fuel gauge IC; or read system files available on mobile systems. Integrated sensors are provided on CPUs [11] such as Intel processors [12] and AMD processors [13], on GPU cards [14], or on motherboards equipped with a Baseboard Management Controller (BMC) monitor-ing chip [15].
Some of this systems are Event-based as in [3,5] or per-component power measurements in addition to the total power as in [5,7,9,16,17]. Others modeled power measurements by applications as in [2]. Industry simulators are typically cycle-accurate that run at a speed of 1 to 10 kHz. Academic simulators, such as [18,19] are not truly cycle-accurate compared to real hardware, and therefore they are faster, with simulation speeds in the tens to hundreds of KIPS (kilo simulated instructions per second) range. They do not scale well to large multi-core systems.
2.2
Performance Benchmark Tools
SPECpower ssj2008 benchmark and the Apache benchmarking tool (ab - apache benchmarking tool.
Available: http://httpd.apache.org/docs/2.2/programs /ab.html) are used for HTTP server traffics. The SPECpower ssj2008 is the first industry standard SPEC benchmark that evaluates the power and performance characteristics of volume server class and multi-node class computers.The widespread used benchmark in industry and academia is SPEC CPU2006 [20]. EEMBC has benchmarks for general-purpose performance analysis including CoreMark, MultiBench(multicore), and FPMark (floating-point).
3
Problem Formulation
The basic relationships among computer perfor-mance, power consumption and energy efficiency are expressed as follows:
P rocessor P erf ormance= 1/CP U Execution time (1)
Energy Ef f iciency= 1/dissipated Energy (2)
Energy=P ower∗CP U Execution time (3)
As shown in [21], the power consumed by a pro-cessor is directly proportional with the clock fre-quency (f).
In order to study the impact of clock speed on the processor performance without DVFS scheduling, the CPU Execution time (tx) is computed as:
tx=Instruction Count∗CP I∗T cycle (4)
where T cycle equals 1/f and CP I is the average number of cycles per instruction.
i.e. tx is function of (1/f), and improving the per-formance requires decreasingtxand speeding up the CPU frequency. Or
tx=N umber of clock cycles/f (5)
in case of single core. And
tx=N umber of clock cycles/(f ∗ce) (6)
in case of multi-core whereceis the effective cores pa-rameter which reflects the degree of the execution par-allelization achievement.
Equation (3) shows that, in order to minimize the energy, power should be reduced. This can be achieved by using low clock frequency. On the other side, reducingtxrequires high clock frequency. This trade-offbetween lower power and better perfor-mance leads to the existence of an optimum point for minimal energy usage with a tight performance im-provement at a certain specific CPU frequency (fm). The goal of the presented experiments in this paper is to search for such minimal energy when the CPU fre-quency is varied and find the optimum frefre-quencyfm for a varied number of cores.
4
Experimental Setup
The presented experiments measure the power and the execution time while running different workloads on specific Dynamic Voltage and Frequency Scaling (DVFS) mobile system settings over a 0.6 GHz to 1.7 GHz range of CPU frequencies.
The variation of CPU frequency settings needs the CPU frequency information of the used mobile de-vice. These settings demand the resetting of the power management policy, the disabling of some cores; and the setting of the only enabled cores with one of its frequency values in parallel with its upper frequency limit.
The experiments are implemented on three diff er-ent battery-powered mobile systems shown in Table 1: two Intel Laptops (Acer and Dell) and one ARM Smartphone (Samsung A5), on different Operating Systems Ubuntu and Android respectively in [1] and extended to multi-core on the two Laptops only. The offered workloads were CoreMark, the standard benchmark tool for Laptops and a custom-made Fi-bonacci benchmark for the Smartphone and also for the Acer and Dell Laptops. The Fibonacci bench-mark is implemented, in Java, iteratively for 2E8 it-erations. The execution time is measured via those performance benchmark tools.
The power consumed by these performance bench-mark tools is measured by different power profiling systems: Powerstat on Linux O.S. and Powertutor [2] on Android. Both systems use the built-in smart bat-tery interface to measure power at rate 1 Hz while the battery is discharging. Powerstat measures the to-tal power while Powertutor measures also an individ-ual power per application. Both power profiling sys-tems have to be running by at least one minute before running the performance benchmark tools giving the chance to the power to be stabilized.
4.1
How to measure power?
For Laptops with Linux platforms, Powerstat is used to measure the power consumed by the running Core-Mark. Two factors are considered: Powerstat mea-sures the total power of the Laptops and CoreMark is a disk with tail powerstate model. Steps to measure CoreMark consumed power (Pc):
1. Reset the power management policy.
2. Operate the frequency scaling governor in userspace mode.
3. Enable onlyiCPU cores and disable the others.
4. Set a certain frequency for all running cores.
5. Run Powerstat.
6. Wait for two minutes until the power is stabi-lized.
Table 1: Simulated Mobile Systems Characteristics
Parameter Acer Aspire 1 Dell Inspiron15 Samsung Galaxy A5
Processor 4xIntel(R) Atom(TM)CPU
N2600 @1.60GHz
4x Intel(R) Core(TM) i5-4210U CPU @1.70GHz
Quad-core 1.2GHz
Cortex-A53
Memory 2G RAM 4G RAM 2G RAM
Operating System Ubuntu 14.04.3 LTS Ubuntu 13.04 Android OS, v4.4.4
Kernel Linux 3.13.065
generic(i686)
Linux 3.8.0 0-19
generic(i686)
3.10.28-4197997 dpi@SWDD5006-1
8. Examine the Powerstat log file, register the power before and a while after the execution time of the CoreMark until the completion of CoreMark I/O and take the average power with-out running the CoreMark (Ps). Ps presents the average power of the system and the Powerstat.
9. Compute the average total power between Start and End-time of CoreMark execution by averag-ing power batches (Pt).
10. ComputePc=Pt−Ps
11. Repeat steps from 5 to 10 in order to get 10 batches and get the averagePc.
12. Repeat steps from 5 to 11 with all available CPU frequencies.
13. Repeat steps from 3 to 12 foridifferent number of cores (1 to 4)
A sample output of Power measured by Power-stat with DVFS scheduling and another with 1.6 GHz fixed CPU frequency setting are shown by the Instan-taneous Power Profiles in Fig. 1.
The resulting power profile shows that the power with DVFS scheduling returns the base state (7.5 watts) 30 seconds earlier than the one with fixed 1.6 GHz CPU frequency setting and also drops about 0.7 watts. This DVFS scheduling saves about 30 sec * 0.7 watts or 21 joules.
5 6 7 8 9
0 10 20 30 40 50 60 70 80 90 100 110 120 130 140 150 160
Power (W)
Time (sec)
DVFS 1.6GHz
Figure 1: Instantaneous Power Profile when CPU is fixed at 1.6 GHz compared to CPU power with DVFS scheduling.
For Smartphones with Android platforms, Powertutor is used for power management. Referring to the steps described above to measure the CoreMark consumed power, apply the first 7 steps with interchanging Pow-erStat with Powertutor and CoreMark with Fibonacci Java code. No need to compute the average consumed power Pc for benchmark since Powertutor measures power for each individual application separately and register it in its log file. Then, repeat steps from 5 to 7 with all available frequencies and cores.
5
Experimental Results and
Anal-ysis
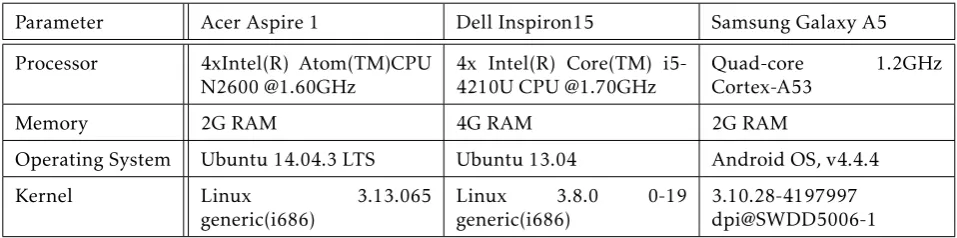
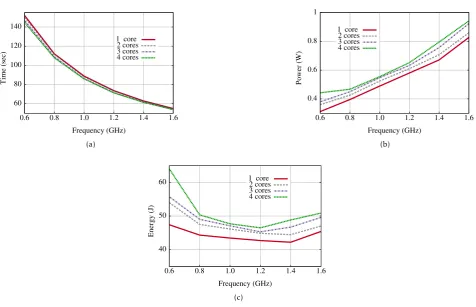
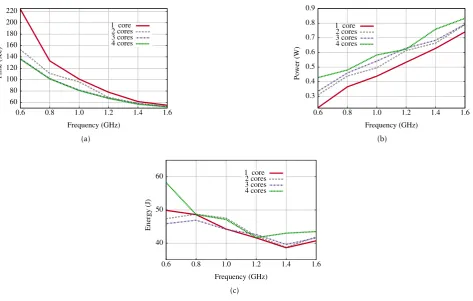
This section illustrates the relationship between the CPU execution time, the power consumption, and the dissipated energy over a 0.6 GHz to 1.7 GHz range of CPU frequencies. We formulate sixteen experiments on one, two, three and four enabled cores. The half of the experiments run over Linux OS using the CoreMark Benchmark on an Acer and Dell Laptops as shown in Figures 2 and 3. The other half run the custom-made Fibonacci Java code over Linux OS on Acer and Dell Laptops as shown in Figures 4 and 5. The CoreMark offered Workload is set to 200,000 iterations while The Fibonacci offered Workload is set to 2E8 iterations.
Figures 2(a), 3(a), 4(a) and 5(a) plot the time results in seconds of the four different number of enabled cores experiments with the variation of the CPU frequency. The sixteen time curves prove (6). They demonstrate that the CPU execution timetxdecreases at higher clock rates and/or a higher effective cores value (ce). Although different workloads are offered to the Acer Laptop, they approximately spent the sametx. This time is much lower when executing the same loads on the higher specifications of Dell Lap-top. The Dell Laptop is much faster than the Acer one.
60 80 100 120 140
0.6 0.8 1.0 1.2 1.4 1.6
Time (sec)
Frequency (GHz) 1 core 2 cores 3 cores 4 cores
(a)
0.4 0.6 0.8 1
0.6 0.8 1.0 1.2 1.4 1.6
Power (W)
Frequency (GHz) 1 core
2 cores 3 cores 4 cores
(b)
40 50 60
0.6 0.8 1.0 1.2 1.4 1.6
Energy (J)
Frequency (GHz) 1 core 2 cores 3 cores 4 cores
(c)
Figure 2: Running CoreMark Benchmark on Acer Laptop. Although increasing number of cores increases the power consumption, there is always an optimal frequency for minimum energy.
of the sixteen experiments ensure that the processor power is proportional to CPU frequency [21]. In ad-dition, incrementing the number of enables cores also increases the power.
All figures (2, 3, 4 and 5) illustrate that increasing frequencies decreases the execution time while in-creasing the consumed power by the processor. They also show that increasing the number of cores has a great effect on increasing the power consumption.
This trade-off between execution time and power, with the variation of frequencies, leads to the convex energy curves in Figures 2(c), 3(c), 4(c) and 5(c). The energy is computed by (3). The Acer Laptop has minimal energy with the CoreMark benchmark atfm =1.4 GHz when one or two cores are enabled, and at fm =1.2 GHz when three or four cores are enabled. While it has a minimal energy atfm= 1.4 GHz for the Fibonacci benchmark when one, two or three cores are enabled and fm = 1.2 GHz when four cores are enabled. The advanced Dell Laptop has a minimal energy at fm = 1.4 GHz with CoreMark benchmark when a single core is enabled,fm= 1.2 GHz when two or three cores are enabled, and fm = 1.1 GHz when the four cores are enabled. While it has a minimal energy at fm = 1.4 GHz with Fibonacci benchmark when one or two cores are enabled andfm= 1.3 GHz when three or four cores are enabled.
All of the sixteen experiments demonstrate that a
minimal energy can be obtained at an optimum fre-quencyfm. Referring to the execution time in Figures 2(a), 3(a), 4(a) and 5(a) at those fm frequencies, a tight performance improvement can be achieved: about 75% in Acer and 65% in Dell Laptops from those of the largest frequencies in case of a single core.
20 40 60
0.8 1.0 1.2 1.4 1.6 1.8
Time (sec)
Frequency (GHz) 1 core
2 cores 3 cores 4 cores
(a)
1 2 3 4 5 6 7
0.8 1.0 1.2 1.4 1.6 1.8
Power (W)
Frequency (GHz) 1 core
2 cores 3 cores 4 cores
(b)
60 70 80 90 100 110
0.8 1.0 1.2 1.4 1.6 1.8
Energy (J)
Frequency (GHz) 1 core
2 cores 3 cores 4 cores
(c)
Figure 3: Running CoreMark Benchmark on Dell Laptop. Although increasing number of cores increases the power consumption, there is always an optimal frequency for minimum energy.
60 80 100 120 140 160 180 200 220
0.6 0.8 1.0 1.2 1.4 1.6
Time (sec)
Frequency (GHz) 1 core 2 cores 3 cores 4 cores
(a)
0.3 0.4 0.5 0.6 0.7 0.8 0.9
0.6 0.8 1.0 1.2 1.4 1.6
Power (W)
Frequency (GHz) 1 core
2 cores 3 cores 4 cores
(b)
40 50 60
0.6 0.8 1.0 1.2 1.4 1.6
Energy (J)
Frequency (GHz) 1 core 2 cores 3 cores 4 cores
(c)
40 60 80 100
0.8 1.0 1.2 1.4 1.6 1.8
Time (sec)
Frequency (GHz) 1 core
2 cores 3 cores 4 cores
(a)
1 2 3 4 5
0.8 1.0 1.2 1.4 1.6 1.8
Power (W)
Frequency (GHz) 1 core
2 cores 3 cores 4 cores
(b)
100 110 120 130 140 150 160
0.8 1.0 1.2 1.4 1.6 1.8
Energy (J)
Frequency (GHz) 1 core
2 cores 3 cores 4 cores
(c)
Figure 5: Running Fibonacci Benchmark on Dell Laptop. Although increasing number of cores increases the power consumption, there is always an optimal frequency for minimum energy.
6
Conclusion
Energy efficiency improvement can’t be achieved by exploring the hardware implementation of the micro-processor design only. Referring to (4), the CPU per-formance is also improved by a good design of in-struction set architecture (ISA).
ISA optimization decreases the program Instruction Count and the CPI. Such optimization has a direct impact on minimizing the offered workload, conse-quently it reduces the power by decreasing the CPU utilization.
Improving processor performance by hardware im-plementation as rising the CPU frequency has a greater side effect on the power. Another factor like CPI has to be considered. High-level of paral-lelism, including superscaler implementation based on instruction-level parallelism or multi-processing architecture where many core (MTC) are integrated, can achieve a better CPI. Using Multi-core processor, as detected by the experiments, reduces the execution time without extra power while enhancing the energy efficiency.
The demonstrated experiments assure the trade-off between optimizing the energy efficiency and improv-ing the processor performance. Both always affect the power consumption while changing the CPU frequen-cies. Furthermore, we have proved that increasing number of cores has a great effect on increasing the power consumption. However, a minimum energy dissipation will occur at a lower frequency which
re-duces the power consumption. Despite that, increas-ing the number of cores will also increase the effective cores value which will reflect a better processor per-formance.
Conflict of Interest No conflict of interest.
References
1. MA. Abou-Of, AH. Taha, AA. Sedky, “Trade-offBetween Low Power and Energy Efficiency in Benchmarking.” in 7th International Conference on Information and Communica-tion Systems. IEEE Conference PublicaCommunica-tions, 2016. 2. L. Zhang, B. Tiwana, Z. Qian, Z. Wang, RP. Dick, ZM.
Mor-ley, L. Yang “Accurate Online Power Estimation and Auto-matic Battery Behavior Based Power Model Generation for Smartphones.” in 8th IEEE/ACM/IFIP International Con-ference on Hardware/Software Codesign and System Syn-thesis. ACM, 2010.
3. A. Pathak, YC. Hu, M. Zhang, P. Bahl, YM. Wang “Fine-grained Power Modeling for Smartphones Using System Call Tracing.” in 6th Conference on Computer Systems. ACM, 2011.
4. K. De Vogeleer, G. Memmi, P. Jouvelot, F. Coelho “The En-ergy/Frequency Convexity Rule: Modeling and Experimen-tal Validation on Mobile Devices.” in International Con-ference on Parallel Processing and Applied Mathematics. Springer Berlin Heidelberg, 2013.
5. S. Li, JH. Ahn, RD. Strong, JB. Brockman, DM. Tullsen, NP. Jouppi “McPAT: An Integrated Power, Area, and Tim-ing ModelTim-ing Framework for Multicore and Manycore Ar-chitectures.” in 42nd Annual IEEE/ACM International Sym-posium on Microarchitecture. ACM, 2009.
Conference on Parallel Architectures and Compilation Tech-niques. ACM, 2012.
7. S. Guti´errez-Verde, O. Bened´ı-S´anchez, D. Su´arez-Gracia, JM. Mar´ın-Herrero, V. Vi ˜nals-Y ´ufera “Processor Energy and Temperature in Computer Architecture Courses: a Hands-on Approach.” in Workshop Hands-on Computer Architecture Ed-ucation. 2009.
8. R. Ge, X. Feng, S. Song, HC. Chang, D. Li “Powerpack: En-ergy profiling and analysis of high-performance systems and applications.” IEEE Transactions on Parallel and Distributed Systems,21(5), 658-671, 2010.
9. M. Dong, L. Zhong “Self-constructive High-rate System En-ergy Modeling for Battery-powered Mobile Systems.” in 9th International Conference on Mobile systems, Applications, and Services. ACM, 2011.
10. R. Murmuria, J. Medsger, A. Stavrou, JM. Voas “Mobile Ap-plication and Device Power Usage Measurements.” in 6th International Conference on Software Security and Reliabil-ity (SERE). IEEE, 2012.
11. D. Hackenberg, T. Ilsche, J. Schuchart, R. ch ¨one, WE. Nagel, M. Simon, I. Georgiou “Hdeem: High definition energy effi-ciency monitoring.” in Proceedings of the 2Nd International Workshop on Energy Efficient upercomputing, E2SC’14. IEEE Press, 2014.
12. Intel Corporation “Intel®64 and IA-32 Architectures Soft-ware Developer’s Manual. Number 253669-053US”, 2015. 13. Advanced Micro Devices “AMD BIOS and Kernel
Devel-oper’s Guide (BKDG) for AMD Family 15h Models 00h-0Fh Processors”, 2013.
14. M. Burtscher, I. Zecena, Z. Zong “Measuring GPU power with the K20 builtin sensor.” in Proceedings of Workshop on General Purpose Processing Using GPUs, GPGPU-7. ACM, 2014.
15. Intel Corporation “Intelligent Platform Management Inter-face Spec”, 2013.
16. C. Isci, M. Martonosi “Runtime Power Monitoring in High-end Processors: Methodology and Empirical data.” in 36th annual IEEE/ACM International Symposium on Microarchi-tecture. IEEE Computer Society, 2003.
17. A. Shye, B/ Scholbrock, G. Memik “Into the Wild: Studying Real User Activity Patterns to Guide Power Optimizations for Mobile Architectures.” in 42nd Annual IEEE/ACM In-ternational Symposium on Microarchitecture. ACM, 2009.
18. N. Binkert, B. Beckmann, G. Black, SK. Reinhardt, A.Saidi, A. Basu, J. Hestness, DR. Hower, T. Krishna, S. Sardashti et al. “The gem5 simulator” ACM SIGARCH Computer Archi-tecture News,39(2), 17, 2011.
19. MT. Yourst“PTLsim: A Cycle Accurate Full System x86-64 Microarchitectural Simulator.” in 2007 IEEE International Symposium on Performance Analysis of Systems & Software. IEEE, 2007.
20. JL. Henning“SPEC CPU2006 benchmark descriptions” ACM SIGARCH Computer Architecture News,34(4), 1-17, 2006.