The Impact of Log Moisture Content
on Chip Size Distribution When Processing
Eucalyptus Pulpwood
Jaco-Pierre van der Merwe, Pierre Ackerman, Reino Pulkki, Dirk Längin
Chip moisture content and especially its uniformity impact kraft pulping. However, the effect of pulp log moisture content on chip quality during chip production is not well known. Chip size distribution is important in kraft pulping as it impacts chemical use, pulp quality and recovery. This study investigated the influence of two pulp log drying periods (1 and 2 weeks) on chip moisture content and chip size distribution when chipping eucalypt pulp logs. In ad
-dition, the effect of three log classes (base, middle and top logs) on chip moisture content and chip size distribution were also analysed. Within the respective log classes, moisture content of chips produced from logs dried for 2 weeks was 5.5% to 13.2% lower than moisture content of chips produced from logs dried for 1 week. Chip moisture content also decreased with de
-creasing log size for both log drying periods. One week dried logs produced chips with 1.0% less over-thick chips than 2 week dried logs (1.5% versus 2.5%). One week dried logs also produced chips with 4.2% to 7.2% less accepts than chips produced from 2 week dried logs within respective log classes. Across both drying periods, over-thick chip production increased with decreasing log size, while the amount of accepts produced decreased with decreasing log size. Logs dried for 2 weeks produced chips with significantly less under-sized chips than logs dried for 1 week. Two week dried logs produced chips with 4.4% to 7.7% less pins and 0.7% to 1.0% less fines than 1 week dried logs within respective log classes. For both log drying periods, the amount of under-sized chips produced increased with decreasing log size. Keywords: Pulp logs, eucalyptus, moisture content, chip size
Previous studies have investigated the impact of log moisture on chip size distribution, when producing chips for the bioenergy market (Spinelli et al. 2011, Mihelič et al. 2015). However, little is known on how log moisture content or log drying period length influ-ence wood chip quality (i.e. thickness, size distribution and chip fracturing) during chip production, when producing chips from eucalypt pulp logs in a planta-tion setting. Chip quality is important as it influences pulp recovery and quality in kraft pulping (True 2006, Macleod 2007, Gulsöy 2012).
Pulp log (from here on referred to as log) moisture content (MC) influences mechanical wood properties such as wood hardness, strength and processing ability (Niedźwiecki 2011). Physical log properties such as log size (length and diameter), degree of debarking, log surface damage and wood density influence the rate of moisture loss. Logs with bark experience slower mois-ture loss as opposed to debarked logs or tree sections
1. Introduction
Commercial forestry is practiced on 1.273 million ha or 1.1% of South Africa’s total surface area. South African commercial forests serve various wood based industries, of which the pulp and paper industry is the largest (FES 2011). During 2011, the industry produced a total 18.5 million m3 of roundwood, of which
12.6 million m3 was harvested for pulp and paper
pro-duction. Revenue for these pulp log sales amounted to EUR 279 million and pulp product sales from pri-mary processing plants was EUR 799 million (FSA 2013). Fast growing eucalypt hardwood species sup-ply 83% of wood resources used for pulp and paper manufacturing (FES 2011).
(Connel 2003, Röser et al. 2011). Sapwood is more ex-posed to climatic elements after debarking and, there-fore, has higher moisture loss rates when compared to heartwood (Defo and Brunette 2007, Färlin 2008).
Freshly harvested logs lose moisture while in stor-age either in the plantation, at roadside or at the mill (Röser et al. 2011). Various storage practices such as stack geometry, orientation to sun and wind, locality and individual log exposure will either accelerate or inhibit the rate of log drying (Persson et al. 2002, Defo and Brunette 2007, Färlin 2008, Gjerdrum and Salin 2009, Phanphanich and Mani 2009, Röser et al. 2011, Eisenbies et al. 2014, Erber et al. 2014, Routa et al. 2015). Smaller log stacks dry quicker due to higher log surface exposure and log stacks sheltered from the wind and sun will have slower drying rates (Persson et al. 2002, Defo and Brunette 2007, Färlin 2008).
Seasonal variations in temperature, precipitation, relative humidity, wind speed and wind direction will influence log drying rates (Gjerdrum and Salin 2009, Defo and Brunette 2007, Röser et al. 2011). Log mois-ture loss is greater at higher ambient temperamois-tures, low atmospheric humidity and/or when logs are ex-posed to a prevailing wind (Persson et al. 2002, Connel 2003, Defo and Brunette 2007, Gjerdrum and Salin 2009, Röser et al. 2011). Precipitation replenishes log moisture and will reduce moisture loss (Defo and Bru-nette 2007, Gjerdrum and Salin 2009, Röser et al. 2011). Processing efficiencies and pulp yield can be di-rectly related to chip quality, as chip quality plays an important role in pulp recovery (MacLeod 2007). Chip moisture content, and especially uniformity, have a major impact on the kraft pulping process (Pulkki 1991). The quality of chips derived from chippers is expressed in terms of chips size distribution: i.e., the percentage of accepted chips (prime and small-size chips), over-size chips, over-thick chips, pins and fines, and whether the chips contain any impurities in the form of bark, knots and rot. In kraft pulping, chemical penetration times vary in relation to chip size, thick-ness and uniformity. Uniform chips lead to more uni-form pulping conditions and higher pulp recovery (Pulkki 1991, Twaddle and Watson 1992a, Twaddle and Watson 1992b, Twaddle and Watson 1992c, Ma-cLeod et al. 1995, Uhmeier 1995, Hartler 1996, Uhmei-er and PUhmei-ersson 1997, BrodUhmei-erick et al. 1998, TessiUhmei-er et al. 1999, Bjurulf 2005, Ding et al. 2005, Bjurulf 2006, True 2006, MacLeod 2007, Balakrishnan 2008, Färlin 2008, Santos et al. 2008, Hellström 2010, Walton et al. 2010, Mafia et al. 2012, Patt et al. 2012).
Timber freshness is expressed in terms of the MC in the wood itself and will influence chip size distributions during chip production (Qian et al. 1994, Hellström
2008, Hellström 2010, Isokangas 2010, Niedźwiecki 2011). An increase in chip thickness during chip pro-duction has been observed, with decreasing log MC. When log MC is very high or low, chip size and unifor-mity will be negatively affected. Logs with very low MC produce greater quantities of undesirable small chips (fines and pins) and large chips (sized and over-thick chips) due to decreasing wood plasticity. At high-er MC, the wood is softhigh-er and greathigh-er quantities of pins and fines are produced (Pulkki 1991, Uhmeier and Pers-son 1997, PersPers-son et al. 2002, Bjurulf 2006, WatPers-son and Stevenson 2007, Färlin 2008, Hellström 2008, Niedźwiecki 2011, Mihelič et al. 2015). No studies could be found to indicate optimal MC for chipping as wood processing is a function of the interactions between wood density and MC (Niedźwiecki 2011).
Watson and Stevenson (2007) investigated the in-fluence of seasonal variations in log MC of softwood and hardwood species on chip size and uniformity and their effect on kraft pulping. The authors found that over-sized chip production increased with de-creasing seasonal log MC. While as MC increased, under-sized chips production increased.
No literature was found as to how log MC influ-ence size and uniformity of eucalypt chips, nor have critical log moisture values been associated with euca-lypt chip quality.
The objective of the study was to determine the influence of two log drying periods and three log size classes on the quality of chips produced in relation to chip size distribution, including any fracturing, chip MC and chip uniformity.
2. Materials and methods
2.1 Site selection, treatments and harvestingThe study was done near Kwambonambi in the Northern KwaZulu-Natal forestry region of South Af-rica. The coastal region is subject to sub-tropical cli-mates, with mean annual temperature and
precipita-Table 1 Study site and tree details
Species E. grandis x urophylla
Age, years 8
Establishment spacing, m 3x2.5
SI 26.20
MAI (6 years), m3 ha-1 yr-1 31.4
DBH, cm 15–20
tion of 22˚C and 1196 mm, respectively (Dovey 2012). An even-aged Eucalyptus grandis×urophylla cloned compartment of relatively uniform tree size was se-lected for the study (Table 1). The trees were harvested during spring, September 2012, when eucalyptus sap-flow has been observed to be high in the Kwambon-ambi area (Dye et al. 2004).
Size distribution and MC of chips produced from logs dried over 2 drying periods were compared. This includes drying period 1 – as fresh as possible (in this case 1 week drying); and period 2 – two weeks of dry-ing before chippdry-ing was initiated.
In addition, a distinction was made between 3 log size classes and it was taken into account how class related to chip size distribution and uniformity with log drying period. Three logs were removed from ev-ery tree (base, middle and top logs). The top log was the third log up the tree, but was not necessarily the last possible log available from any specific tree.
For this study, 120 trees were felled in harvester settings with a single grip harvester with up to 5 feed roller passes along the log surface. A harvester setting comprised of 10 trees (5 rows wide and 2 rows deep), and 60 trees were allocated to each of the log drying treatment. Log drying periods were randomly as-signed within the experimental design. Trees within each setting were colour coded according to log drying period and tree position. Each tree was also sequen-tially numbered.
From each of the 120 tree, three 5.5 m logs were processed: one from the base, one from the middle and one from the top of the tree. The study produced 360 individual logs. There were equal numbers of logs for each of the log classes (base, middle and top logs). Trees with growth deformities, such as double leaders and butt sweep, within the experimental layout were excluded and formed part of the buffer zones to main-tain design continuity.
A SP Maskiner 591LX harvesting head mounted on a tracked Hitachi IS200 excavator base was used for the study. The feed roller pressures were pre-calibrat-ed for tree size (DBH) and the particular bark charac-teristics (thickness and adherence to the stem) to mi-nimise potential log surface damage induced by the feed roller before the study commenced.
A Timberpro TF840-B forwarder extracted and load-ed the log assortments directly onto a timber truck. The load was securely covered with a tarpaulin to limit moisture loss during transport to the chipping facility.
Logs were chipped in a Bandit 250 XP mobile disc chipper. Chipper maintenance was done by a chipper technician prior to chipping. Chipper maintenance
included knife change and anvil clearance adjust-ments. The chipper knife angles were fixed at 45˚.
Logs were separated and stacked according to the drying period which they would be subjected to. When the logs reached the predetermined drying pe-riod, chipping was initiated. The logs were manually fed into the chipper to avoid potential grapple induced log surface damage from the mechanical loader. The chips were ejected from the chipper spout by means of the standard blower into an industrial tumbler. The tumbler container opening was covered by plastic bags, to prevent any chips from escaping the contain-er. Chips produced from individual logs were mixed thoroughly in the tumbler for one minute before a 12l sample was extracted. Samples were immediately placed in plastic bags and sealed to avoid further moisture loss. Each log tag information was copied onto the bag containing the chips produced from it. The remaining chips were discarded.
The green mass of each sample was recorded be-fore being repacked into brown paper bags to facili-tate moisture loss while in storage. Individual log information was replicated onto the paper bag. Sam-ples were stored off the ground for 1 month to allow for air drying.
Subsequently, the chip samples were screened for 5 min according to SCAN-CM 40:94 standards into 5 chip size classes (over-sized, over-thick, accepted, pins and fines) using a mechanical chip size screener (SCAN-Test 1994). Each of the 1800 individual frac-tioned chip class sub-samples (5 chip class sub-sam-ples per chip sample), were marked for identification and bagged separately. Chip class sub-samples were dried at a temperature of 105˚C for 24 h according to SCAN-CM 39:94 standards to determine dry matter content. Individual chip class sub-samples were ex-pressed as a mass percentage of the total sample bone dry mass (SCAN-Test 1994).
Chip MC was calculated for individual samples ac-cording to D4442-07 standards for the direct moisture content measurement of wood and wood-base materi-als (ASTM International 2007).
2.2 Statistics
depen-dent of each other (Milton and Arnold 1999). When significant differences were found between treatments or treatment interaction effects (α=0.05), significant dif-ferences between individual means were determined using a post hoc Bonferroni t-test, as ANOVA residuals were normally distributed. The least square means (LSM) method was used for the representation of sig-nificant treatment interactions.
3. Results
3.1 Chip moisture contentThe interaction between log drying period and log class had a significant effect on wood chip MC (p<0.001), Table 2.
Two week dried top logs with a MC of 31.8% pro-duced chips 12.1% lower in MC than chips propro-duced from two week dried base logs (31.8% versus 43.9%)
and 6.2% lower in MC than chips produced from two week dried middle logs (31.8% versus 38.1%). Two week dried top logs also produced chips 17.6% lower in MC than chips produced from one week dried base logs (31.8% versus 49.4%), 16.1% lower in MC than chips produced from one week dried middle logs (31.8% versus 47.9%) and 13.1% lower in MC than one week dried top logs (31.8% versus 45.0%). Two week dried middle logs with a MC of 38.1% produced chips 5.9% lower in MC than two week dried base logs (38.1% versus 43.9%). Two week dried middle logs also pro-duced chips 11.3% lower in MC than one week dried base logs (38.1% versus 49.4%), 9.9% lower in MC than one week dried middle logs (38.1% versus 47.9%) and 6.9% lower in MC than one week dried top logs (38.1% versus 45.0%). Two week dried base logs with a MC of 43.9% produced chips 5.5% lower in MC than one week dried base logs (43.9% versus 49.4%) and 4.0% lower in MC than one week dried middle logs (43.9% versus 47.9%).
One week dried top logs with a MC of 45.0% pro-duced chips 4.4% lower in MC than one week dried base logs (45.0% versus 49.4%) and 2.9% lower in MC than one week dried top logs (45.0% versus 47.9%). One week dried middle logs with a MC of 47.9% pro-duced chips 1.5% lower in MC than one week dried base logs (47.9% versus 49.4%).
3.2 Chip size distribution
Chip size and uniformity differed significantly in relation to log drying period (Table 3), log class (Table 4) and the interaction between the treatments (Table 5).
Table 3 Means table for over-size chips, over-thick chips, accept chips, pin chips and fines produced from logs subject to respective drying periods, expressed as a percentage
Log drying period Chip size distribution, %
Over-size Over-thick Accepts Pins Fines
1 week 0.08±0.02 1.5±0.08a 74.2±0.36 20.8±0.30 3.5±0.044
2 weeks 0.15±0.04 2.5±0.10b 79.9±0.27 14.8±0.20 2.6±0.045
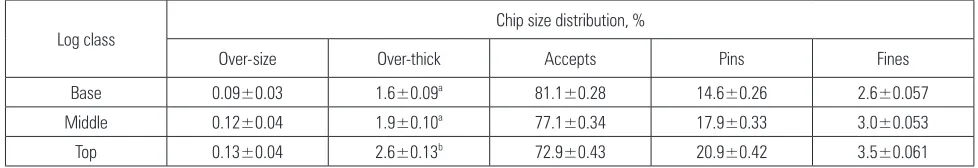
Table 4 Means table for over-size chips, over-thick chips, accept chips, pin chips and fines produced from respective log classes, expressed as a percentage
Log class Chip size distribution, %
Over-size Over-thick Accepts Pins Fines
Base 0.09±0.03 1.6±0.09a 81.1±0.28 14.6±0.26 2.6±0.057
Middle 0.12±0.04 1.9±0.10a 77.1±0.34 17.9±0.33 3.0±0.053
Top 0.13±0.04 2.6±0.13b 72.9±0.43 20.9±0.42 3.5±0.061
Table 2 Effect of log drying period and log class on chip MC
Log drying period Log class MC, %
1 week
Base 49.4±0.31e
Middle 47.9±0.32d
Top 45.0±0.30c
2 weeks
Base 43.9±0.24c
Middle 38.1±0.27b
No significant interactions were observed between drying period and log class (p=0.370) and the amount of over-sized chips produced. The individual main ef-fects of drying period and log class also had no sig-nificant effect on the amount of over-sized chips pro-duced (p=0.085 and p=0.711), (Table 3, Table 4 and Table 5).
Main effect log drying period and log class had a significant effect on the amount of over-thick chips pro-duced (p<0.001), (Table 3 and Table 4). One week dried logs produced 1.0% less over-thick chips than logs dried for two weeks (1.5% versus 2.5%). Base logs produced 1.0% less over-thick chips than top logs (1.6% versus 2.6%). Middle logs produced 0.7% less over-thick chips than top logs (1.9% versus 2.6%).
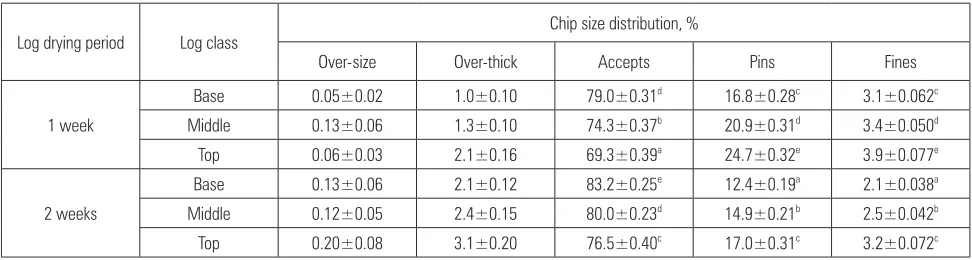
The interaction between log drying period and log class had a significant effect on amount of accepts duced (p<0.001), (Table 5). One week dried top logs pro-duced 9.7% less accepts than one week dried base logs (69.3% versus 79.0%) and 5.0% less accepts than one week dried middle logs (69.3% versus 74.3%). One week dried top logs also produced 13.9% less accepts than two week dried base logs (69.3% versus 83.2%), 10.7% less accepts than two week dried middle logs (69.3% versus 80.0%) and 7.2% less accepts than two week dried top logs (69.3% versus 76.5%). One week dried middle logs produced 4.7% less accepts than one week dried base logs (74.3% versus 79.0%). One week dried middle logs also produced 9.0% less accepts than two week dried base logs (74.3% versus 83.2%), 5.7% less accepts than two week dried middle logs (74.3% versus 80.0%) and 2.2% less accepts than two week dried top logs (74.3% versus 76.5%). One week dried base logs produced 4.2% less accepts than two week dried base logs (79.0% versus 83.2%).
Two week dried top logs produced 6.7% less ac-cepts than two week dried base logs (76.5% versus 83.2%) and 3.5% less accepts than two week dried
middle logs (76.5% versus 80.0%). Two week dried top logs also produced 2.5% less accepts than one week dried base logs (76.5% versus 79.0%). Two week dried middle logs produced 3.2% less accepts than two week dried base logs (80.0% versus 83.2%).
The interaction between log drying period and log class had a significant effect on amount of pins pro-duced (p<0.001), (Table 5). Two week dried base logs produced 2.5% less pins than two week dried middle logs (12.4% versus 14.9%) and 4.6% less pins than two week dried top logs (12.4% versus 17.0%). Two week dried base logs also produced 4.4% less pins than one week dried base logs (12.4% versus 16.8%), 8.4% less pins than one week dried middle logs (12.4% versus 20.9%) and 12.3% less pins than one week dried top logs (12.4% versus 24.7%). Two week dried middle logs produce 2.1% less pins than two week dried top logs (14.9% versus 17.0%). Two week dried middle logs also produce 1.9% less pins than one week dried base logs (14.9% versus 16.8%), 5.9% less pins than one week dried middle logs (14.9% versus 20.9%) and 9.8% less pins than one week dried top logs (14.9% versus 24.7%). Two week dried top logs produced 3.8% less pins than one week dried middle logs (17.0% versus 20.9%) and 7.7% less pins than one week dried top logs (17.0% versus 24.7%).
One week dried base logs produced 4.0% less pins than one week dried middle logs (16.8% versus 20.9%) and 7.9% less pins than one week dried top logs (16.8% versus 24.7%). One week dried middle logs produced 3.9% less pins than one week dried top logs (20.9% versus 24.7%).
The interaction between log drying period and log class had a significant effect on amount of fines pro-duced (p=0.016), (Table 5). Two week dried base logs produced 0.4% less fines than two week dried middle logs (2.1% versus 2.5%) and 1.1% less fines than two week dried top logs (2.1% versus 3.2%). Two week
Table 5 Means table for over-size chips, over-thick chips, accept chips, pin chips and fines produced for the interaction between log drying periods and log classes, expressed as a percentage
Log drying period Log class Chip size distribution, %
Over-size Over-thick Accepts Pins Fines
1 week
Base 0.05±0.02 1.0±0.10 79.0±0.31d 16.8±0.28c 3.1±0.062c
Middle 0.13±0.06 1.3±0.10 74.3±0.37b 20.9±0.31d 3.4±0.050d
Top 0.06±0.03 2.1±0.16 69.3±0.39a 24.7±0.32e 3.9±0.077e
2 weeks
Base 0.13±0.06 2.1±0.12 83.2±0.25e 12.4±0.19a 2.1±0.038a
Middle 0.12±0.05 2.4±0.15 80.0±0.23d 14.9±0.21b 2.5±0.042b
dried base logs also produced 1.0% less fines than one week dried base logs (2.1% versus 3.1%), 1.3% less fines than one week dried middle logs (2.1% versus 3.4%) and 1.8% less fines than one week dried top logs (2.1% versus 3.9%). Two week dried middle logs produced 0.7% less fines than two week dried top logs (2.5% ver-sus 3.2%). Two week dried middle logs also produced 0.6% less fines than one week dried base logs (2.5% versus 3.1%), 0.9% less fines than one week dried mid-dle logs (2.5% versus 3.4%) and 1.3% less fines than one week dried top logs (2.5% versus 3.9%). Two week dried top logs produced 0.2% less fines than one week dried middle logs (3.2% versus 3.4%) and 0.7% less fines than one week dried top logs (3.2% versus 3.9%).
One week dried base logs produced 0.3% less fines than one week dried middle logs (3.1% versus 3.4%) and 0.8% less fines than one week dried top logs (3.1% versus 3.9%). One week dried middle logs produced 0.5% less fines than one week dried top logs (3.4% ver-sus 3.9%).
4. Discussion
4.1 Moisture contentPrevious studies have found that drying rates in-creased with decreasing logs size, hence the lowest chip MC was expected to be recorded for chips pro-duced from the smaller top logs (Hartsough et al. 2000, Connel 2003, Defo and Brunette 2007).
Chip MC varied according to log drying period and log classes used for chip production. Differences in chip MC produced from the log classes were great-er during the second week of drying (Table 2). For 2 week dried logs, the MC of chips produced from top logs was 6.3% lower than that of middle logs (31.8% vs. 38.1%) and chips produced from middle logs were 5.8% lower than base logs (38.1% vs. 43.9%). However, chips produced from 1 week dried top logs were 2.9% lower in MC than chips produced from middle logs (45.0% vs. 47.9%) and chips produced from middle logs were 1.5% lower in MC than chips produced from base logs (47.9% vs. 49.4%). The relatively low rate of moisture loss during the first week of drying was most likely due to the logs being protected by a tarpaulin for 6 days during the transport from the harvesting site to the chipping facility 1800 km to the south-west of the country (Persson et al. 2002, Gjerdrum and Salin 2009).
Differences in chip MC also gradually increased with decreasing log size when compared to chips pro-duced from the different log section classes subjected to 1 and 2 week drying periods. Two week dried base logs produced chips 5.5% lower in MC than 1 week
dried base logs (43.9% vs. 49.4%), 2 week dried middle logs produced chips 9.8% lower in MC than 1 week dried middle logs (38.1% vs. 47.9%) and 2 week dried top logs produced chips 13.2% lower in MC than 1 week dried top logs (31.8% vs. 45.0%).
4.2 Chip size distribution
The methodology developed for this study to in-vestigate the influence of log drying period and log size on chip quality is unique. The method applied to separate chip fractions produced during chipping was sound in relation to the study objectives. However, an additional screen separating small sized accepts from prime sized accepts during screening would have been beneficial to better understand the trends ob-served regarding chip size distributions and the fac-tors affecting them. Unfortunately, the necessary equipment was not available.
The main effects, as well as the interactions between the main effects, had no significant influence on over-size chip produced. Previous studies have shown that chips produced from horizontal feed disc chippers have significantly less over-size chips than chips produced from drop feed disc chippers (Twaddle and Watson 1992a, Twaddle and Watson 1992d, Nati et al. 2014). It has been found that logs fed into drop feed chippers have highly variable log orientations during chipping (Isokangas 2010). Logs from the thin ends of trees are often forced into chipping knives causing fracturing and even breakages due to uncontrolled log feeding speeds (Isokangas 2010). These factors could often lead to greater over-size chip production (Isokangas 2010).
Watson and Stevenson (2007) found that the amount of over-thick chips produced during chipping increased with decreasing log MC. One week dried logs produced chips with significantly less over-thick chips than 2 week dried logs (1.5% versus 2.5%).
In addition, the interactions between drying period and log class had a significant effect on the percentage of accept chips produced (Table 5). One week dried logs produced chips with significantly less accept chips than 2 week dried logs. This trend was also ob-served within each log section class. One week dried top logs produced chips with 7.2% less accept chips than 2 week dried top logs (69.3% vs. 76.5%). One week dried middle logs produced chips with 5.7% less accept chips than 2 week dried middle logs (74.3% vs. 80.0%) and 1 week dried base logs produced chips with 4.2% less accept chips than 2 week dried base logs (79.0% vs. 83.2%). The percentage of accept chips pro-duced during chipping is a function of the percentage of undesirable chip size fractions produced. As the percentage of under-sized and over-sized chip frac-tions increases, the proportion of accept chips corre-spondingly decreases.
Individual log sections also had a significant effect on the amount of accept chips produced during chip production. With decreasing log size, the percentage of accept chips produced decreased linearly. The trend was also observed for chips produced from logs dried for both 1 week and 2 week drying periods (Table 5). Comparing log sections dried for 1 week, it was found that top logs produced chips with 5.0% less accept chips than middle logs (69.3% vs. 74.3%) and middle logs produced chips with 4.7% less accept chips than base logs (74.3% vs. 79.0%).
Comparing log section classes dried for 2 weeks it was found that top logs produced chips with 3.5% less accept chips than middle logs (76.5% vs. 80.0%) and middle logs produced chips with 3.2% less accept chips than base logs (80.0% vs. 83.2%). The effect of wood MC on chip size and uniformity has been inves-tigated internationally and it was shown that chips produced from logs with low or high MC produced greater amounts of non-optimum chips during chip-ping (Pulkki 1991, Uhmeier and Persson 1997, Watson and Stevenson 2007, Färlin 2008, Hellström 2010, Niedźwiecki 2011, Spinelli et al. 2011 and Mihelič et al. 2015). Surface wood dried quicker than sub-surface wood (Defo and Brunette 2007). With log surface to volume ratios increasing with decreasing log size, smaller logs have a larger portion of surface wood with greater drying rates leading to larger portions of excessively dry wood and lower proportions of accept chips produced (Bassler 1987, Pulkki 1991, Uhmeier and Persson 1997, Defo and Brunette 2007, Färlin 2008, Hellström 2008). After the 1 week drying period, the surface wood is dryer than the sub-surface wood, which then negatively affects accept chip production (Araki 2002, Defo and Brunette 2007, Watson and Ste-venson 2007, Niedźwiecki 2011).
Interactions between the drying period and log class also had a significant effect on the amount of pins produced during chip production (Table 5). Two week dried logs produced chips with significantly less pins than 1 week dried logs. This trend was also observed within each log class. Two week dried base logs pro-duced chips with 4.4% less pins chips than 1 week dried base logs (12.4% vs. 16.8%). Two week dried middle logs produced chips with 6.0% less pins than 1 week dried middle logs (14.9% vs. 20.9%) and 2 week dried top logs produced chips with 7.7% less pins than 1 week dried top logs (17.0% vs. 24.7%).
Moreover, log class had a significant effect on the amount of accept chips produced during chip produc-tion. With decreasing log size, the percentage of pins produced increased linearly. The trend was also ob-served for chips produced from logs dried for both 2 week and 1 week drying periods. Comparing log sec-tions dried for 2 weeks, it was found that base logs produced chips with 2.5% less pins than middle logs (12.4% vs. 14.9%) and middle logs produced chips with 2.1% less pins than top logs (14.9% vs. 17.0%).
Comparing log sections dried for 1 week, it was found that base logs produced chips with 4.1% less pins than middle logs (16.8% vs. 20.9%) and middle logs produced chips with 3.8% less pins than top logs (20.9% vs. 24.7%). Wood MC has been found to have a significant impact on chip size and uniformity. Espe-cially when wood moisture content was excessively high or low, the amount of non-optimum chips pro-duced increased (Pulkki 1991, Uhmeier and Persson 1997, Watson and Stevenson 2007, Färlin 2008, Hell-ström 2010, Niedźwiecki 2011, Spinelli et al. 2011 and Mihelič et al. 2015). As previously mentioned, surface wood dried faster than sub-surface wood (Defo and Brunette 2007). As log surface to volume ratios in-creased with decreasing log size, smaller logs have larger portions of surface wood with greater drying rates that lead to larger portions of excessively dry wood and greater amounts of pins produced (Bassler 1987, Pulkki 1991, Uhmeier and Persson 1997, Defo and Brunette 2007, Färlin 2008, Hellström 2008). After the 1 week drying period, the surface wood is dryer than the sub-surface wood, which results to the pro-duction of greater quantities of pins (Araki 2002, Defo and Brunette 2007, Watson and Stevenson 2007, Niedźwiecki 2011).
dividual log classes, the fines content difference in-creased with increasing log size. Two week dried base logs produced chips with 1.0% less fines than 1 week dried base logs (2.1% vs. 3.1%), 2 week dried middle logs produced chips with 0.9% less fines than 1 week dried middle logs (2.5% vs. 3.4%) and 2 week dried top logs produced chips with 0.7% less fines than 1 week dried top log classes (3.2% vs. 3.9%). A higher rate of moisture loss for smaller sized logs may explain why smaller sized logs have a smaller difference in the amount of fines produced, as smaller logs may be closer to optimum log MC for limiting fines produc-tion during chipping. It can be concluded that log MC has a significant effect on fines production (Bassler 1987, Araki 2002, Watson and Stevenson 2007, Niedźwiecki 2011).
Chip fines content also increased with decreasing log size for chips produced from logs dried for respec-tive drying periods. One week dried base logs pro-duced chips with 0.3% less fines than 1 week dried middle logs (3.1% vs. 3.4%) and 1 week dried middle logs produced chips with 0.5% less fines than 1 week dried top logs (3.4% vs. 3.9%).
Two week dried base logs produced chips with 0.4% less fines than 2 week dried middle logs (2.1% vs. 2.5%) and 2 week dried middle logs produced chips with 0.7% less fines than 2 week dried top logs (2.5% vs. 3.2%). Log surface to volume ratios increased ex-ponentially as log size decreased; therefore, smaller log classes have greater proportions of exposed sur-face wood with low MC. Larger proportions of drier surface wood potentially led to greater quantities of chip fines during chip production (Araki 2002, Watson and Stevenson 2007, Niedźwiecki 2011).
5. Conclusion
A study to determine the impact of log drying pe-riod on wood chip size distributions was conducted. The study included 2 log drying periods with logs dried for 1 week and 2 weeks, respectively. In addition, the effect of log size on the production of chip size distributions was analysed. Trees included in the study were harvested during the relatively wet spring months in the Kwambonambi area in Northern Kwa-Zulu-Natal of South Africa. The logs samples were chipped at a chipping facility located in the Western-Cape province of South Africa. The chip sample anal-ysis was done at Stellenbosch University.
Results show that drying period and log size class had a significant impact on chip size fractions pro-duced during chipping (over-thick chips, accepts, pins and fines). Drying period and log class had a
signifi-cant effect on the amount of over-thick chips pro-duced. One week dried log classes produced 1.0% less over-thick chips than 2 week dried log classes (1.5% vs. 2.5%). Over-thick chip production also increased with decreasing log size. Base logs produced 1.0% less over-thick chips than top logs (1.6% vs. 2.6%) and middle logs produced 0.7% less over-thick chips than top logs (1.9% vs. 2.6%).
In addition, the interaction between log drying pe-riod and log class had a significant effect on accept chip production. One week dried logs produced sig-nificantly less accept chips than 2 week dried logs across all log classes. One week dried base logs pro-duced 4.2% less accepts than 2 week dried base logs (79.0% vs. 83.2%). Likewise, 1 week dried middle logs produced 5.7% less accepts than 2 week dried middle logs (74.3% vs. 80.0%) and 1 week dried top logs pro-duced 7.2% less accepts than 1 week dried top logs (69.3% vs. 76.5%). Accept chip production also de-creased with decreasing log size for logs subject to both log drying periods.
Moreover, results show that the interaction be-tween log drying period and log class had a significant effect on the amount of pins produced during chip-ping. Two week dried logs produced significantly less pins than 1 week dried logs across all log classes. Two week dried base logs produced 4.4% less pins than 1 week dried base logs (12.4% vs. 16.8%). Meanwhile, 2 week dried middle logs produced 6.0% less pins than 1 week dried middle logs (14.9% vs. 20.9%) and 2 week dried top logs produced 7.7% less pins than 1 week dried top logs (17.0% vs. 24.7%). The production of pins also increased with decreasing log size for logs subject to both drying periods.
Finally, findings demonstrate that the interaction between log drying period and log class had a signifi-cant effect on chip fines production. Two week dried logs produced less fines when compared to 1 week dried logs. Further, 2 week dried base logs produced 1.0% less fines than 1 week dried base logs (2.1% vs. 3.1%). Meanwhile, 2 week dried middle logs produced 0.9% less fines than 1 week dried middle logs (2.5% versus 3.4%) and 2 week dried top logs produced 0.7% less fines than 1 week dried top logs (3.2% versus 3.9%). Fines production also increased with decreas-ing log size for both log drydecreas-ing periods.
6. Recommendations
Þ Debarking practices Þ Log MC
Þ Tree size.
Log MC greatly influences chip size and unifor-mity during chip production. Infield log drying peri-ods need to be adjusted according to climatic condi-tions, tree species and tree size. Log assortments extracted from individual trees during harvesting vary in size, and therefore will have a wide range of drying rates. Thus, log drying periods need to be suited to a variety of log assortments to ensure that log MC is as close as possible to the optimal MC for chip produc-tion. This is also essential to ensure uniformity in chip moisture content.
Additionally, it was found that tree size has a sig-nificant effect on chip quality. With decreasing log size, the amount of undesired chip fractions produced dur-ing chippdur-ing increased. As such, plantation compart-ments scheduled for annual harvesting operations should be revised to avoid the harvesting of under-sized trees. Forestry companies should consider ad-justing plantation felling ages to ensure larger tree size at the time of felling. Closer investigation is needed to determine the optimum tree size to facilitate debark-ing, and to maximize chip quality and pulp value re-covery. Further research is also needed to determine the best MC range for chipping from a chip quality point of view.
Acknowledgments
Thanks and appreciation to Mondi Forests for the allocation of a study area and for financing the project. Thanks to Bandit South Africa for assistance in chip-ping operations.
7. References
Araki, D.S., 2002: Fibre recovery and chip quality from de-barking and chipping fire-damaged stems. Report, Forest Engineering Research Institute of Canada, 32 p.
ASTM international, 2007: Standard Test methods for direct moisture content measurement of wood and wood-base ma
-terials, 6 p.
Balakrishnan, J., 2008: Effect of wood storage and seasonal variations of hardwoods on pulp and paper properties. MEng Thesis, University of New Brunswick, 7–25.
Bassler, G.A., 1987: Producing pulp quality chips in the woods: A short term study on three portable delimber-de
-barker systems. Master thesis, Oregon State University, 135 p. Biermann, C.J., 1996a: Wood and fiber fundamentals. In: Bier
-mann, C.J. (ed.). Handbook of pulping and papermaking, 2nd
edition. Oxford, Academic Press 2: 13–50.
Biermann, C.J., 1996b: Pulping fundamentals. In: Biermann, C. J. (ed.) Handbook of pulping and papermaking, 2nd edition.
Oxford, Academic Press 3: 55–97.
Bjurulf, A., 2006: Chip Geometry: Methods to impact the ge
-ometry of market chips. Doctoral Thesis, Swedish University of Agricultural Sciences, 43 p.
Bjurulf, A., 2005: Effects on chip size distribution when an extra screen is added in SCAN-CM 40:01. TAPPI Journal 4(4): 28–31.
Broderick, G., Cacchione, E. Héroux, Y., 1998: The importance of distribution statistics in the characterization of chip quality. TAPPI Journal 81(2): 131–142.
Cáceres, C.B., Hernández, R.E., Koubaa, A., 2016: Effects of log position in the stem and cutting width on size distribution of black spruce chips produced by a chipper-canter. Wood and Fiber Science 48(1): 1–18.
Clarke, C., Palmer, B., Gounden, D., 2008: Understanding and adding value to Eucalyptus fibre. Southern Forests: A Journal of Forest Science 70(2): 169–174.
Connel, M.J., 2003: Log Presentation : Log damage arising from mechanical harvesting or processing. Forestry and For
-est Products Report No. PN02.1309. Commonwealth Scien
-tific and Industrial Research Organisation, Yarralumla, 64 p. Dang, V.Q., Nguyen, K.L., 2008: A universal kinetic model for characterisation of the effect of chip thickness on Kraft pulp
-ing. Bioresource technology 99(5): 1486–1490.
Defo, M., Brunette, G., 2007: Application of a mathematical model to the analysis of the influence of length and diameter on log drying rate. Wood and Fiber Science 39(1): 16–27. Ding, F., Benaoudia, M., Bédard, P., Lanouette, R., Lejeune, C., Gagné, P., 2005: Wood chip physical quality definition and measurement. Pulp and Paper Canada 106(2): 27–32. Dovey, S.B., 2012: Effects of clear felling and residue manage
-ment on nutrient pools, productivity and sustainability in a clonal eucalypt stand in South Africa. Doctoral thesis, Stel
-lenbosch University, 246 p.
Dye, P., Versfeld, D., 2007: Managing the hydrological impacts of South African plantation forests: an overview. Forest Ecol
-ogy and Management 251(1–2): 121–128.
Dye, P., Jacobs, S., Drew, D., 2004: Verification of 3-PG growth and water-used predictions in twelve Eucalyptus plantation stands in Zululand, South Africa. Forest Ecology and Manage
-ment 193(1–2): 197–218.
Eisenbies, M.H., Volk, T.A., Pate, A., 2014: Changes in feed
-stock quality in willow chip piles created in winter 1 from a commercial scale harvest. Biomass and Bioenergy 86: 180–190. Erber, G., Routa, J., Kolström, M., Kanzian, C., Sikanen, L., Stampfer, K., 2014: Comparing two different approaches in modelling small diameter energy wood drying in logwood piles. Croatian Journal of Forest Engineering 35(1): 15–22. Färlin, A., 2008: Analysis of chip quality and value at Norske Skog Pisa Mill. Master thesis, Swedish University of Agricul
-tural Science, 16–48.
South Africa. Department of Agriculture, Forestry and Fisher
-ies, Pretoria, 138 p.
Forestry South Africa, 2013: Abstract of South African for
-estry facts for the year 2010/2011. Department of Agriculture, Forestry and Fisheries, Johannesburg, 1 p.
Gjerdrum, P., Salin, J., 2009: Open-air drying of scots pine transmission poles prior to creosote treatment. The 7th Inter
-national Conference: Wood Science and Engineering in the Third Millennium, International Union of Forest Research Organizations, Brasov, Romania, 95–102.
Gulsöy, S.K., 2012: Factors affecting Kraft pulp yield. Kasta
-monu University, Journal of Forestry Faculty 12(1): 144–156. Hartler, N., 1996: Achievement and significance of optimal chip quality. TAPPI Journal 79(2): 259–264.
Hartsough, B., Spinelli, R., Pottle, S., Klepac, J., 2000: Fiber recovery with chain flail delimbing/debarking and chipping of hybrid poplar. Journal of Forest Engineering 11(2): 37–41. Hellström, L.M., 2010: On the wood chipping process – a study on basic mechanisms in order to optimize chip prop
-erties for pulping. Doctoral thesis, Mid Sweden University, 46 p.
Hellström, L.M., 2008: Fracture processes in wood chipping. Licentiate thesis, Mid Sweden University, 32 p.
Isaksson, P., Gradin, P.A., Hellström, L.M., 2013: A numerical and experimental study regarding the influence of some proc
-ess parameters on the damage state in wood chips. Holzfor
-schung 67(6): 691–696.
Isokangas, A., 2010: Analysis and management of wood room. Doctoral thesis, University of Oulu, 118 p.
Kearney, D., James, R., Montagu, K., Smith, R.G.B., 2007: The effect of initial planting density on branching characteristics of Eucalyptus pilularis and E. grandis. Australian Forestry 70(4): 262–268.
Laitinen, J., 2001: Determination of residual bark in debarked pulpwood using image analysis. TAPPI Journal 84(1): 1–10. MacLeod, M., 2007: The top ten factors in Kraft pulp yield. Paper and Timber 89(4): 1–7.
MacLeod, J.M., McPhee, F.J., Kingsland, K.A., Tristram, R.W., O’Hagan, T.J., Kowalska, R.E., Thomas, B.C., 1995: Pulp strength delivery along complete Kraft mill fiber lines. TAPPI Journal 78(8): 153–160.
Mafia, R.G., Santos, P.C, Demuner, B.J., Massoquete, A., Sartório, R.C., 2012: Eucalyptus wood decay: effects on pro
-ductivity and quality of cellulose. Forest Pathology 42(4): 321–329.
Malan, F.S., 2003: The wood quality of the South African tim
-ber resource for high-value solid wood products and its role in sustainable forestry. The Southern African Forest Journal 198(1): 53–62.
Mihelič, M., Spinelli, R., Magagnotti, N., Poje, A., 2015: Perfor
-mance of a new industrial chipper for rural contractors. Bio
-mass and Bioenergy 83: 152–158.
Milton, J.S., Arnold J.C., 1999: Introduction to probability and statistics: principles and applications for engineering and the
computing sciences. ISBN-10: 007246836X, 2nd edition, New
York: McGraw-Hill, 819 p.
Nati, C., Eliasson, L., Spinelli, R., 2014: Effect of chipper type, biomass type and blade wear on productivity, fuel consump
-tion and product quality. Croatian Journal of Forest Engineer
-ing 35(1): 1–7.
Niedźwiecki, Ł., 2011: Energy requirements for comminution of fibrous materials – qualitative chipping model. Master the
-sis, Linnaeus University, 74 p.
Patt, R., Kordsachia, O., Süttinger, R., 2012: Ullmann’s ency
-clopedia of industrial chemistry. 8th edition. Wiley-VCH, ed.
Wiley-VCH Verlag GmbH, 477–534.
Persson, E., Sjöström, M., Sundblad, L., Wiklund, S., Wil
-helmsson, L., 2002: Färskt virke–en utmaning för skogsbruk och virkesmätning [Fresh wood-a challenge for forestry and timber measurement]. Resultat: Skogforsk Report No.8. Sk
-ogforsk, 1–4.
Phanphanich, M., Mani, S., 2009: Drying characteristics of pine forest residues. BioResources 5(1): 108–121.
Pulkki, R., 1991: A literature synthesis on the effects of wood quality in the manufacture of pulp and paper. Technical Note TN-171. Forest Engineering Research Institute of Can
-ada 10 p.
Qian, Y., Tessier, P.J.C., Dumont, G.A., 1994: Fuzzy logic mod
-elling and optimization of a wood chip refiner. TAPPI Journal 77(2): 181–186.
Röser, D., Mola-Yudego, B., Sikanen, L., Prinz, R., Gritten, D., Emer, B., Väätäinen, K., Erkkilä, A., 2011: Natural drying treat
-ments during seasonal storage of wood for bioenergy in dif
-ferent European locations. Biomass and Bioenergy 35(10): 4238–4247.
Routa, J., Kolström, M., Ruotsalainen, J., Sikanen, L., 2015: Validation of prediction models for estimating the moisture content of small diameter stem wood. Croatian Journal of For
-est Engineering 36(2): 111–119.
Santos, A.J., Anjos, A., Simões, R.M.S., 2008: Influence of kraft cooking conditions on the pulp quality of Eucalyptus globu
-lus. Appita Journal 61(2): 148–155.
Scandinavian pulp and paper board testing committee, 1994: Wood chips for pulp production, size distribution, SCAN-CM 39:94: 1–2.
Scandinavian pulp and paper board testing committee, 1994: Wood chips for pulp production, size distribution, SCAN-CM 40:94: 1–4.
Spinelli, R., Magagnotti, N., Paletto, G., Preti, C., 2011: Deter
-mining the impact of some wood characteristics on the per
-formance of a mobile chipper. Silva Fennica 45(1): 85–95. Spinelli, R., Hartsough, B., 2001: A survey of Italian chipping operations. Biomass and Bioenergy 21(6): 433–444.
Svedman, M., Tikka, P., Luhtanen, M., 1998: Effects of soft
-wood morphology and chip thickness on pulping with a dis
-placement Kraft batch process. TAPPI Journal 81(7): 157–168. Tessier, P., Broderick, G., Desrochers, C., 1999: Chip size dis
-tribution for an ultra-high-yield sulphite process. TAPPI Jour
Tikka, P., Tähkänen, H., Kovasin, K., 1993: Chip thickness vs. Kraft pulping performance: Experiments by multiple hanging baskets in batch digesters. TAPPI Journal 76(3): 131–136. True, G.R., 2006: Pins and fines: a small cause of big losses. TAPPI Frontline Focus 2(12): 2–3.
Twaddle, A., 1997: The influence of species, chip length, and ring orientation on chip thickness. TAPPI Journal 80(6): 123– 131.
Twaddle, A.A., Watson W.F., 1992a: Shortwood vs. longwood chipping what impact on chip distribution? TAPPI Journal 75(6): 107–111.
Twaddle, A.A., Watson W.F., 1992b: Quantification of factors affecting chip quality from disc chippers. TAPPI Journal 75(10): 135–140.
Twaddle, A.A., Watson W.F., 1992c: Survey of drum debarkers in roundwood chipping yards of south eastern United States. TAPPI Journal 75(11): 105–107.
Twaddle, A.A., Watson W.F., 1992d: Survey of disc chippers in roundwood chipping yards of south eastern United States. TAPPI Journal 75(12): 77–81.
Uhmeier, A., Persson, K., 1997: Numerical Analysis of Wood Chipping. Holzforschung 51(1): 83–90.
Uhmeier, A., 1995: Some fundamental aspects of wood chip
-ping. TAPPI Journal 78(10): 79–86.
Walton, S.L., Hutto, D., Genco, J.M., van Walsum, G.P., van Heiningen, A.R.P., 2010: Pre-extraction of hemicelluloses from hardwood chips using an alkaline wood pulping solution fol
-lowed by Kraft pulping of the extracted wood chips. Indus
-trial and Engineering Chemistry Research 49(24): 12638– 12645.
Watson, W.F., Stevenson, R., 2007: The effect of seasonal vari
-ation in wood moisture content on chip size and Kraft pulp
-ing. In Engineering, Pulping and Environmental Conference: Innovations in Engineering, Pulping and Environmental. Jacksonville, Florida, USA: Technical Association of the Pulp and Paper Industry, 1–8.
Received: February 05, 2016. Accepted: March 18, 2016.
Authors’ address:
Jaco-Pierre van der Merwe, MSc. e-mail: [email protected] Pierre Ackerman, PhD.* e-mail: [email protected] Stellenbosch University
Department of Forest and Wood Science Private Bag X1, Matieland
SOUTH AFRICA Reino Pulkki, PhD.
e-mail: [email protected] Stellenbosch University
Department of Forest and Wood Science Private Bag X1, Matieland
SOUTH AFRICA Lakehead University
Faculty of Forestry and Forest Environment 955 Oliver Road,
Thunder Bay, Ontario CANADA
Dirk Längin, PhD.
e-mail: [email protected] Mondi
380 Old Howick Road Hilton 3245