Using fuzzy c-means clustering algorithm for
common lecturer timetabling among departments
Hamed Babaei1, Jaber Karimpour2, Sajjad Mavizi3
Received (2015-12-04) Accepted (2017-01-29)
Abstract — University course timetabling problem is one of the hard problems and it must be done for each term frequently which is an exhausting and time consuming task. The main technique in the presented approach is focused on developing and making the process of timetabling common lecturers among different departments of a university scalable. The aim of this paper is to improve the satisfaction of common lecturers among departments and then minimize the loss of resources within departments. The applied method is to use a collaborative search approach. In this method, at first all departments perform their scheduling process locally; then two clustering and traversing agents are used where the former is to cluster common lecturers among departments and the latter is to find unused resources among departments. After performing the clustering and traversing processes, the mapping operation in done based on principles of common lecturers constraint in redundant resources in order to gain the objectives of the problem. The problem’s evaluation metric is evaluated via using fuzzy c-means clustering algorithm on common lecturer constraints within a multi agent system. An applied dataset is based on meeting the requirements of scheduling in real world among various departments of Islamic Azad University, Ahar Branch and the success of results would be in respect of satisfying uniform distribution and allocation of common lecturers on redundant resources among different departments .
Index Terms — Common Lecturer TimeTabling Problem (CLTTP), Fuzzy c-means Clustering Algorithms, Multi-Agent Systems, , University Course TimeTabling Problem (UCTTP).
I. INTRODUCTION
T
he goal of the university course timetablingproblem ( UCTTP) is to find a method to allocate whole events to fix predefined timeslots
and rooms, where all constraints within the
problem must be satisfied. Events include
students, teachers and courses where resources encompasses the facilities and equipment’s of classrooms such as theoretical and practical rooms. Also timeslots include two main components, namely daily and weekly timeslots which it varies from one institution to another. However, each classroom also has its own components allocated to those classrooms (the capacity of theory and practical rooms), number of blackboards and whiteboards related to each theory and practice classroom and etc. [1, 2, and 3].
1. Description of the Problem
UCTTP is a hybrid optimization problem in the class of NP-hard problems occur at the beginning of each semester of universities and includes the allocation of events (courses, teachers and
students) to a number of fixed timeslots and
rooms. This problem must satisfy both hard and soft constraints during allocation of events to resources, so that the possible timetables are obtained after full satisfaction of whole hard constraints and also soft constraints to increase and promote the quality of possible generated timetables as necessary. There are some problems
and complexities in UCTTP process; firstly, the
scheduling process is an NP-complete problem, then it could not be solved in the polynomial time
classes because of the exponential growth of this problem and the existence of some variations
1- Department of Computer Engineering, Islamic Azad University, Ahar Branch, Ahar, Iran.
2- Department of Computer Sciences, University of Tabriz, Tabriz, Iran.
in the fast growth of students’ numbers in this problem, so we must seek heuristic approaches. Secondly, the number of constraints (hard and
soft) in this problem differs from one institution
to another. Therefore, the main aim of all of the
mentioned algorithms is to maximize the number of soft constraints satisfied in the final timetables
[1, 2, 3, and 4].
2. The basic definitions of the problem
Event: a scheduled activity, like: teacher, course, and student.
Timeslot: a time interval in which each event is scheduled, like: weekly timeslot such as Tuesday and daily timeslot such as 8 a.m. to 9 a.m. and etc.
Resource: resources are used by events, like: equipment’s, rooms, timeslots and etc.
Constraint: a constraint is a restriction in scheduling of events, categorized into two types of hard and soft constraints, like the capacity of classrooms, given timeslot and etc.
People: People include lecturers and students and are a part of events.
Conflict: the confliction of two events with
each other, like: scheduling of more than one teacher for one classroom at the same time.
3. Different types of constraints in the problem Constraints in UCTTP problem are classified
into two classes of hard and soft constraints.
Hard constraints must be satisfied in the problem
completely so that the generated solution would
be possible and without conflict; no violation
is allowed in these constraints. Soft constraints
are related to objective function; objective function is to maximize the number of satisfied
soft constraints. Unlike hard constraints, soft
constraints are not necessarily required to satisfy; but as the number of these satisfied constraints
increases, the quality of solutions of objective function increases. In the following, a list of hard and soft constraints presented which are taken from literature [1, 2, 3, 4, 5, 6, and 7].
1)Hard Constraints
A teacher could not attend two classes at the same time.
A course could not be taught in two different
classes at the same time.
A teacher teaches only one course in one room at each timeslot.
At each daily timeslot in one room only one
group of students and one teacher could attend. A teacher teaches for only one group of students at each daily timeslot.
There are some predefined courses which are
scheduled in a given timeslots.
The capacity of the classrooms should be proportional to the number of students of the given course.
2) Soft Constraints
The teacher can have the choice to suggest priority certain timeslots for her/his courses either public or private times.
A teacher may request a special classroom for a given course.
The courses should be scheduled in a way that the empty timeslots of both teacher and student to be minimized.
Timetabling of the courses should be conducted in a way that the courses not scheduled
at evening timeslots, as it is possible; unless
an evening timeslot has been requested by a particular teacher.
The lunch break is either 12 p.m. to 13 p.m. or 13 p.m. to 14 p.m., usually.
The start time of classes may be 8 a.m. and the ending time may be 20:30 p.m. (evening), usually.
The maximum teaching hours for teachers in a
classroom are 4 hours.
The maximum learning hours for students is
4 hours.
Scheduling should be conducted in a way that one or a group of students not attend university for one timeslot in a day.
4. Mathematical formulation of the problem Formal definition of UCTTP problem
includes n: the number of events E={e1, e2, ... , en}, k: the number of timeslots T={t1, t2, … , tk},
m: the number of rooms R={r1, r2, … , rm}, L: the number of rooms’ features F={f1, f2 , ... , fl}
and s: the set of students S={s1, s2, ... , ss}. For
example, if the number of daily timeslots is 9 and
the number of weekly timeslots is 5, then the total timeslots will be T= 9 × 5 =45.
The input data for each sample problem (data sets) include the size and features of each room, the number of students in an event and information
about conflicting events. So, we should know
the procedure of measuring violation and non-violation of hard and soft constraints in order to
At first the penalty function per violation from
soft constraint must be calculated for each solution which is corresponding to a timetable, as bellow [3, 5, 6, and 7]:
PF (S) = ∑SC 𝑊𝑊𝑊𝑊𝑗𝑗𝑗𝑗
×
(−1)𝑗𝑗𝑗𝑗=1 (1)
In Eq. (1), S is the solution, Wj is the weight of each soft constraint (value 0 means non-violation, value 1 means violation and -1 shows the cost of each violation per soft constraint) and
SC is the number of soft constraints. However,
PF represents the penalty function. Value of objective function per solution considering hard constraints can be calculated as:
OF (S) = ∑𝐻𝐻𝐻𝐻𝐻𝐻𝐻𝐻𝑖𝑖𝑖𝑖=1𝑊𝑊𝑊𝑊𝑖𝑖𝑖𝑖
×
(−1)+ PF (S) (2)In Eq. (2), Wi is the weight of each hard constraint where value 0 means non-violation, value 1 means violation and -1 shows the cost of each violation per hard constraint. Also HC and
OF are the number of hard constraints, and the objective function, respectively. Always the value
of first term of right hand side of the Eq. (2) is
equal to zero �Wi×(−1) = 0 HC
i=1
, this means that the
violation of hard constraints is not feasible. So OF(S) = 0 + PF(S), consequently OF(S) = PF(S).
In order to determine the violation of solutions, from hard and soft constraints, results of sample
problems are stored in 5 matrixes namely
STUDENT-EVENT, EVENT-CONFLICT, ROOM-FEATURES, EVENT-FEATURES and EVENT-ROOM which is introduced in the following.
Each event is met by each student which is
stored in the matrix STUDENT-EVENT. This matrix called matrix A is a k × n matrix. If the
value of Ui,j in the matrix Ak,n be 1, then student
iϵS must attend event jϵs, otherwise, its value will
be 0. The matrix size is
k
×
n
=
S
×
n
. TheEVENT-CONFLICT matrix is an n × n matrix
with two arbitrary events which could be
scheduled in the same timeslots. This matrix called matrix B is used to quickly identify events
which potentially allocated to same timeslots.
ROOM-FEATURES matrix is a m × l matrix
which shows the features of each room; this matrix called matrix C. If the value of Ci,j be 1, then each iϵR has a feature of jϵF, and otherwise
its value will be 0. The matrix size is
F
m
l
m
×
=
×
. The EVENT - FEATUREmatrix also called matrix D is a n × l matrix and
represents the features required by each event. Namely, event iϵE requires features of jϵF, if and only if di,j=1. The matrix size is
n
×
l
=
n
×
F
.Finally the EVENT-ROOM matrix called G matrix is an n × m matrix which represents the
list of possible rooms so that each event could be
allocated in those rooms. This matrix represents the quick identification of all rooms in terms of
their size and features for each appropriate event.
The matrix size is n × m [1, 3, 5, 6, and 7].
5.The approaches used in the study of UCTTP The first definition of timetabling has been
presented as three sets of: 1) teachers, 2) classrooms
and 3) timeslots (Gotlib, 1963). Approaches
used to solving the UCTTP problem up to now are as follows: 1) Operational Researches (OR) based techniques including graph coloring theory based technique, IP/LP method and Constraint
Based Satisfaction(s) technique (CPSs); 2)
Metaheuristic approaches also including Case Base Reasoning method (CBR), population based approaches and single solution based approaches where the population based approaches includes
Genetic Algorithms (GAs), Ant Colony
Optimization (ACO), Memetic Algorithm (MA), Harmonic Search Algorithm (HAS) and single solution algorithms also includes Tabu Search Algorithm (TS), Variable Neighborhood Search (VNS), Randomized Iterative Improvement with Composite Neighboring algorithm (RIICN),
Simulated Annealing (SA) and Great Deluge Algorithm (GD); 3) multi criteria and multi objective approaches; 4) intelligent novel approaches such as hybrid approaches, artificial
intelligence based approaches, fuzzy theory based approaches and 5) distributed multi agent systems approach [1, 2, 3, 5, 6, and 7].
6. Motivation and historical perspective of the problem
system is considered, it means that there is a network of agents cooperates with each other to solve problems which are out of capability of each single agent [8]. Recently, using distributed multi agent systems based approach to solve UCTTP problem has been applied by [9] where in the this method, a solution is used to deal with UCTTP problem using distributed environment and an interface agent -which is responsible
to cooperate different timetabling agents-
collaborate with each other to improve the solution of common goal. The initial timetables are generated for multi agent systems by using multiple hybrid metaheuristics which are a combination of graph coloring metaheuristics
and local search in different methods. The hybrid
metaheuristics provide the capability to generate possible solutions for all samples of both Socha et al. (2002) and international competitions timetabling 2002 datasets. However, recently, [10] has used distributed agents to create UCTTP by considering hard (necessary) and soft (desirable) constraints. Also, he presented fairly meeting of distribution in allocating resources in his Ph.D. thesis. There are two types of agents in that model which are year- programmer agent and rooms’ agent. However, there are four principles
to efficiently organize agents, including: 1) queue
and the sequential queue algorithm, 2) queue and interleaved queue algorithm, 3) round robin and sequential round robin algorithm and 4) round robin and interleaved round robin algorithm. The problem formulation and dataset have been adopted from the third section of ICT-2007. The obtained result ensures the consistency of interleaved round robin principle for year-programmer agents in the system and the fairest chance in obtaining the required resources. To
optimal fuzzy classification of students, [11] has
used a fuzzy function to solve UCTTP genetic programming problem. The aim was to separate the students of populous classes. This separation
has led to reduce the amount of conflict of
students’ courses in weekly program. Here,
at first the fuzzy c-mean clustering algorithm
divides students into c classes and then, according to the criteria of distance of clusters’ centers, density of each cluster, co-entrance of students of each cluster and dimension ratio of clusters by using a fuzzy function, the value of clustering is determined so that by selecting the appropriate
features (courses), the best classification of
students is obtained. However, recently [12] has
used a novel clustering technique based on FP-Tree to solve UCTTP where the given technique is done to classify students based on their selective
courses who submitted for the next semester.
The aim of this clustering is to solve scheduling of courses where in the previous semesters the submission of students in some courses due to simultaneous scheduling has been prevented,
while in this technique no conflict would happen over scheduling of exams since no two exams at
the same time would be taken for courses by two identical groups of students.
7. Claim
In this article our main goal is to schedule
common lecturers (CLTTP) among different
departments based on redundant resources among departments. Clustering algorithms have been used to schedule common lecturers within a distributed system based approach. Since the system uses a distributed multi agent architecture so in order to reach the goal of CLTTP problem, two agents, clustering and traverser, are considered, respectively. The clustering agent performs the act of clustering common lecturers among departments within clusters according to the common, semi-common and uncommon priorities, constraints and features of lecturers so that lecturers who are similar and closer to each other in terms of selecting priorities and constraints are places within high value clusters (primary and more dense clusters) in order to be allocated to their demanded and prioritized resources. After clustering process, the mapping of these clusters is done due to the clusters of common lecturers among departments in to traversed groups of redundant resources among departments collected by traverser agent. The research performed in this article is to present a
new and different approach of timetabling problem
to develop and make the process of timetabling common lecturers among departments over
existing (redundant) resources in departments of
II. RELATED WORK
Those approaches solved UCTTP problem by now include the mentioned methods in section
1. Operational research approaches
Graph coloring approach is on how to model
a UCTTP problem by using a non-directional graph where [13] has used vertices as events, colors as time slots and edges as constraints in a graph to solve timetabling problem where no
two adjacent vertices have co-colors; since a sign of conflict has been authenticated in the
time table. Another hybrid approach has also been proposed to solve UCTTP problem using genetic algorithm by [14] which reduces the
cost of finding the number of minimum required
colors to color a graph with this hybrid method. In [15], IP method (integer programming) has been presented to solve UCTTP problem where the goal is to allocate a set of courses among lecturers and groups of students and also a set of weekly and daily time period pairs. Again, [16]
has presented an IP-based two-step simplification
method where during step 1, the classes require sequence are scheduled by allocating courses to given days and times and during step 2, ensuring the sequence of those courses requiring more than one time period for the same student groups is also done.
2. Meta heuristic approaches
In [17], a genetic algorithm has been used in respect of ordering a university timetabling where the intersection rate was 70% and no hard constraint was violated and the applied constraints were almost on room’s occupation and capacity. However, [18] has proposed a
new GA technique to solve UCTTP problem
which uses a learner machine. The results of this technique include minimization of the number of violated soft constraints, high usage of available rooms and reduction of lecturers’ workload. Of course applying ant colony optimization algorithm by [19] to UCTTP problem after submission has been done according to ITC-2007 dataset where ants allocate events to rooms and time slots based on two types of pheromone Tijs
and Tjky . This algorithm has performed well on timetabling and generated good results during longer. Applying a hybrid ant colony system has been proposed to solve UCTTP problem in [20],
where two types of hybrid ant systems including combination of SA with AC and combination of TS with AC have been presented. A number of ants perform entire allocation of courses to
time slots based on a predefined list. Selection
of time slots’ probabilities is done by ants to allocation courses using heuristic information and an indirect coordinator mechanist among
agents (Stigmergic) and existing activities within
an environment. The memetic algorithm has been done using [21] to solve UCTTP problem via combination of local search method in genetic algorithm. One of the local searches is done on events and the other one is performed on time slots.
The Tabu search algorithm has been applied
by [22] for the first time to allocate students to
courses and also balance the number of students
within whole submitted group where the first
phase is: generating a set of solutions for a student, and the second phase is: combining a set of solutions and applying Tabu search with local strategies and the third phase is also: allocating room and improving allocation, while without changing the initial allocation of
courses to timeslots. In [23], the influence of
neighborhood structures has been presented on Tabu search algorithm to solve UCTTP problem
where the effect of simple and swap transitions
has been tested on Tabu search operations based on neighborhood structures. Here, four new neighborhood structures have been used and compared. To solve UCTTP problem, the combination of kempe neighborhood chain has been presented in simulated annealing algorithm by [24] where one of the hard constraints of
reformulation is done by relaxation and then this constraint is created in the form of relaxed soft constraint. However, the relaxation problem
is analyzed in two steps: 1- to create a feasible solution, a heuristic based graph is used and 2- a simulated annealing algorithm has been used to minimize the violations of soft constraints (in the second phase, a kempe neighborhood chain based heuristic has been used).
[25] Also has used directed local search strategy in genetic algorithm to solve UCTTP problem where the directed search strategy uses
a data structure to create offspring that stores the extracted information of good individuals
of previous generations in itself. The results are satisfactory with this local search combined in
allocations and minimize the violations from soft constraints. The variable neighborhood search algorithm (VNS) has been presented by [26] to solve UCTTP problem which proposes the base
VNS and then states some modifications to each solution which apply an exponential Monte Carlo
acceptance criterion. However, the main idea of applying Monte Carlo acceptance criterion was to improve the heuristics by admitting the best solution with given probability so that the number of promised neighbors would be found.
3. Modern intelligent approaches
A hybrid algorithm has been presented by [27] which is the combination of sequential heuristic and simulated annealing to solve UCTTP problem on ITC-2002 dataset. This method includes three phases: Phase 1: using a sequential heuristic to
generate feasible time tables; phase 2: applying
simulated annealing to minimize the number of soft constraints’ violations and phase 3: uses simulated annealing to increase the improvement of the generated time tables’ quality. Recently, a multi population hybrid genetic algorithm has been proposed by [28] to solve UCTTP problem
based on three genetic algorithms FGARI, FGASA and FGATS. In this algorithm, fuzzy
logic is used to evaluate the number of violations
from soft constraints in fitness function to deal
with real worlds data which are ambiguous and non-deterministic and random methods, local search, simulated annealing and Tabu search
would also be beneficial in addition to fuzzy
method to improve inductive search in order to meet the need of search ability.
To solve UCTTP problem, [29] has presented a fuzzy multi criteria heuristic ordering method where the ordering of events has been done according to three independent heuristics simultaneously using fuzzy methods. The sequential combination of three heuristics is ordered as follows: 1- the highest degree, 2- saturation degree and 3- enrollments degree and the fuzzy weight of an event is also used to represent what problem the event has to be scheduled. The ordered events are allocated to the last time slot with the least value of penalty cost as a descending manner while the feasibility is maintained throughout whole process. A fuzzy solution has been presented by [30] based on memetic approach to solve university timetabling where a time table has been compared with both genetic and memetic algorithm and its results may
satisfy the existing constraints simultaneously
in a shorter time interval. The aim was to use fuzzy logic as a tool to local search in memetic algorithm. [31] Has proposed the fuzzy genetic heuristic idea to solve UCTTP problem where the genetic algorithm has been applied by using indirect representation based on the features of integrating events and modeling the fuzzy set to evaluate the violation from soft constraints in the objective function according to uncertainty of real world data. Here, a degree of uncertainty which is in an objective function is considered for each soft constraint and this uncertainty is evaluated by formulation of soft constraint violation parameter in objective function by using fuzzy membership functions.
III. THE PROPOSED METHOD
In [8], an agent could observe and receive everything through sensors from its environment and then perform within environment via the
stimulus. Agents are classified into various
classes based on their applications including the following agents: 1-autonomous, 2-intelligent, 3-reactive, 4-pro-active, 5-learner, 6-mobile, 7-collaborative/communicative. So, agents must have a common language and a communicative media to communicate and cooperate with each other where these two components are vital among agents.
1. Common lecturers timetabling problem among departments
common lecturers over redundant resources among departments. Therefore, to solve a CLTTP problem, the solution in the form of distributed multi agent system accompanied with applying clustering algorithms must follow the process of minimizing the collision of common lecturers among departments. Fig. 1 represents a holistic view on CLTTP problem in a tree structure.
Fig.1: The tree structure of common lecturers’ timetabling problem among departments
2. Frameworks and infrastructures of the proposed algorithm
The proposed algorithm consists of four agents: 1-time table (each ith department or agent, TAi; i=1,2,...), 2-mediator agent (MA), 3-clustering agent (CA) and 4-traverser agent
(TraA) which have been shown in fig.2, with their relations in three phases. The first phase
includes steps 1 and 2 which are planned by the timetabling agent to produce feasible with no
conflict time tables. Of course, in this phase, the identification and collection of common lecturers
among departments is done by the mediator agent in step 3, the second phase includes steps 4, 5 and 6 which performs the process of clustering common lecturers among departments within the clustering agent to make uniform distribution on the traversed redundant resources of each department by the traverser agent and the third phase consists of steps 7 and 8 where the process of mapping the common lecturers’ clusters is done in redundant resources based on the constraints of common lecturers and send the time tables with
the capability of planning to each department for a semester.
Fig.2: The general view of CLTTP problem’s schematic
1) The first phase
The first phase includes the hard constraints related to lecturers of each department satisfied by
TAi agent and contains the following constraints: 1- a lecturer could not teach more than 6 hours per day, 2- a lecturer could not be in more than one department at the same time slot, simultaneously, 3- a lecturer could not be in two classes at one or more departments in one day or at the same time slot, 4- a class is allocated to one lecturer at one time slot, and 5- two lecturers could not be in the same class of a department at the same time. Fig.2 show the lecturers timetabling algorithms on the resources related to each department by
TAi agent. Between the first and the second
phases, the mediator agent (MA) studies the
operation of extracting common lecturers among
departments accompanied with their features to
cluster in the next step without any conflict based
on the aim of the problem which is to time table the common lecturers among departments and sends them to their related departments (TAi) in
order to modify the conflicts when it discovers a conflict and inconsistency in the time tables
of common lecturers among departments. And then the time tables of common lecturers of each
department fixed in the respect of the problem
aim by the mediator agent are sent during step 3 to the clustering agent (CA).
2) The second phase
resources among departments (among TAi agents) (step 5). Of course, before entering step 5, all busy and redundant resources have been determined entirely through time tables of each department (TAi) in step 6 and sent to step 5 by TraA agent to perform traversing and grouping. In the second phase, two ideas have been proposed where the former is to consider two new agents of CA and TraA in the architecture of multi agent system and perform the mapping process by CA in TraA and the latter is to state a clustering method coinciding the type of problem called fuzzy c-means clustering to perform the process of clustering common lecturers among departments applied within CA agent. The algorithms of two CA and TraA agents have been
shown in fig. 4 and 5.
3) The third phase
In the third phase, the process of mapping priorities and requirements of common lecturers is presented to uniformly distribute and allocate redundant resources among departments. In
the last step of the third phase (step 8) the final
solution (timetabling of common lecturers among departments for one semester) is sent to all the departments based on each department’s (TAi)
identification codes after the process of mapping
clustering agents in the traversed redundant resources in TraA agent.
4) Clustering and traversing in the second phase
In the second phase, the clustering of common lecturers among departments is performed in the clustering agent (CA) by two algorithms of k-means, fuzzy c- means clustering and the proposed funnel-shape clustering where the clustering process is described through four features of each common lecturer as: desirable daily time slots, undesirable daily time slots, desirable weekly time slots and undesirable weekly time slots. Following the process of clustering common lecturers among departments based on their features, traversing and grouping of the redundant resources is done by TraA agent
as fig. 3.
Fig.3: The structure of grouping redundant resources among departments in TraA
5) The complete description of adapted fuzzy c-means clustering algorithm’s details
In this method, the applied formula to solve the common lecturers time tabling among faculties problem in order to cluster the common lecturers by fuzzy c-means clustering algorithm have been obtained by [32].
After stating the priorities and soft constraints of each common lecturer among departments based on equation 3, now in this equation let consider
Lk as the kth common lecturer,
k slots WeeklyTime as
the kth weekly time slot,
k lots
DailyTimes as the kth
daily time slot, Departementk as kth department and k
m as the membership degree of each common
lecturer.
] 9 . 0 ,1 . 0 [
; ∈
=
= k
k k
k k
k WeeklyTimeslot Departement DailyTimeslot
L µ µ
(3)
In equation 4, the default pattern of primary
matrixes is represented as UDep(0)WeeklyTimeslots
related to each department and each weekly timeslot and the values of membership degree of each common lecturers is denoted by mik per row
or daily timeslot per department are represented as following: each daily time slot DailyTimeslots( )1−7
from 8-9:301 to 19-20:307 as one cluster which would be 7 clusters and weekly timeslots
( )1−7
slots
WeeklyTime from Saturday (1) to Friday (7) and Dep as five departments Departement(1−5)
30 columns (common lecturers). The resulted
matrix is represented as equation 5.
30 , 7 30 , 7 71 30 , 1 11 7 6 5 4 3 2 1 ) 0 ( ... ... ... ... ... ... ... ... ... ... 30 : 20 19 30 : 18 17 30 : 16 15 30 : 14 13 13 12 30 : 11 10 30 : 9 8 ) 7 1 ( ) 5 1 ( − − − − − − − = − − µ µ µ µ slots WeeklyTime Dep U (4)
6) The steps of adapted fuzzy c-means clustering for CLTTP problem
By given initial matrix of U( )0 for each
common lecturer among departments, we have the following steps:
1- Finding the centers of each i cluster according to j feature of each common lecturer among departments would be calculated by equation 6. After describing the structure of each j feature of common lecturers in equation
7, now the rule of finding the center of cluster
must be presented in terms of equation 8 which is consistent with the common lecturers’ timetabling problem. It must be noted that since the common lecturers have been distributed among departments, then the equation 8 must be cycled
among all five departments (Dep=1,2,...,5) based on three features and priorities of each common lecturer determined by parameter vi per given common lecturer.
∑
∑
= = × = n k ik nk ik kj
ij X V 1 2 1 2 µ µ (6) ( )
(jisDepartementsjisWeeklyTimeslots jisDailyTimeslots)
X X X X j j j n
k kj kj kj
j n k j k kj 3 2 1 , , 1 3 , 1 , 1 , , 3 2 1 3 2 1 → + + =
∑
∑
= = = = = (7){
, , ,}
; ,1 ,7; ,1 ,3 ; 1 25 1 1 2 1 3 1 2 = = = × =
∑
∑
∑
∑
= = = = j i v v v v XV Dep n i i i ij
k ik
n
k ik j kj
ij
µ µ
(8)
In equation 6, parameters k = 1,...,n , mik and
Xkj , represent the number of common lecturers among departments, the membership degree of each common lecturer due to ith cluster and
the contribution amount of each kth common
lecturer to jth feature. Equation 7 is the extension
of variable Xkj of each common lecturer over three parameters or features (priority) Xkj1 of departments, Xkj2 is the daily time slot and Xkj3 is the weekly time slot.
2- Obtaining the distance of each k common lecturer out of cluster i over the lecturers placed
in the centers of each i cluster and extending the
distance of fuzzy c- means clustering would be applied to be compatible with common lecturers’ timetabling problem based on equation 9. In equation 9, let dik be the distance parameter of kth common lecturer over ith cluster and two
parameters Xkj and Vij represent the ratio of kth
common lecturer over each feature j (department, weekly time slot and daily time slot), respectively and the other parameter would be the variable of
finding the center of ith cluster over feature j of
each kth common lecturer.
3- Now, we must obtain the updating process mik of elements of initial matrix elements U(0)
called the values of membership degree in order
to reach matrix U(1) based on equation 10.
(
)
( ) ( ) ( )2
3 3 2 2 2 2 1 1 7 , , 1 ; 30 , , 1 3 1 2 ) ( i k i k i k i k
j kj ij
i k ik V X V X V X V X V X d d − + − + − → − = − = = = =
∑
(9) ( ) ( ) ( ) 1 7 1 2 7 , , 1 ; 30 , , 1 ; 7 , , 1 ; , 1 , 0 1 − = = = = = + → ∑
z r zk r ik z k i r r ik d d µ (10)In equation 10, the parameters would be as the following: r is the counter and representing
the number of matrix’s cycles, i as ith cluster ( i = 1,...,c ), k means the kth common lecturer, and Z represents the number of clusters. Now, after computing each updated value of mik based on
equation 10, matrix U(1) is formed as equation 11.
4- At each step, in order to terminate
the updating process of matrix U(r) to U(r+1), equation 12, the matrix norm rule, must be used to terminate the execution of fuzzy c- means
clustering algorithm. Equation 12 would be the
main rule to update the elements of matrix U(0)
namely Xik s in k- means clustering.
However, it must be said that the iteration process of equation 12 is in a way that we would
reach to an optimal solution matrix U(*) and this
procedure follows the U(r=0)→U(r=1)→→U(∗)
rule. Equation 13 represents how to apply equation 12 for common lecturer timetabling
problem. Step 4 is the final phase of fuzzy c-
means algorithm for the membership of each common lecturer so that when the equation 13 fails, the restoration would continue from the
step 1 with recently created matrix U(1) so that we could reach a new matrix U(2) which is the updated matrix U(1) and so on.
(11)
( ) ( ) max ( )1 ( )0 ; 0.1 0.01, 0,1,2,... ,
1 − = − ≤ = =
+ U or r
U r r i k µik µik εL εL (12)
( ) ( ) ( ) ( ) ( ) ( ) ( ) ( ) ( ) ( ) ( ) ( ) ( ) ( ) ( ) ( ) ( ) ( ) ( ) ( ) ( ) ( ) ( ) ( ) ( ) ( ) ( ) ( ) ( ) ( ) L k i r r U U ε µ µ µ µ µ µ µ µ µ µ µ µ µ µ µ µ µ µ µ µ µ µ µ µ µ µ µ µ ≤ − − − − − − − − − − − − − − = − = = = = 0 30 , 7 1 30 , 7 0 71 1 71 0 30 , 6 1 30 , 6 0 61 1 61 0 30 , 5 1 30 , 5 0 51 1 51 0 30 , 4 1 30 , 4 0 41 1 41 0 30 , 3 1 30 , 3 0 31 1 31 0 30 , 2 1 30 , 2 0 21 1 21 0 30 , 1 1 30 , 1 0 11 1 11 30 , 1 ; 7 , , 1 0 1 max
(13)
(
d)
Objectivefunction vU
J n
k c
i ik ik ;
) , ( 1 1 2 2
∑ ∑
= = ×5- After terminating each membership matrix U’s updating, the value of objective function must be obtained in terms of two parameters mik and dikbased on equation 14.
In equation 14, k is the number of common lecturers, c is the number of clusters, mik is the membership degree of each kth common lecturer
in ith cluster and d
ik is also the distance of kth
common lecturer over the common lecturers within the center of ith cluster in c cluster.
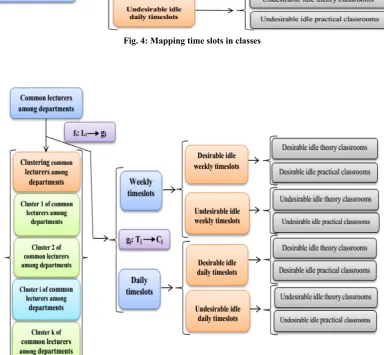
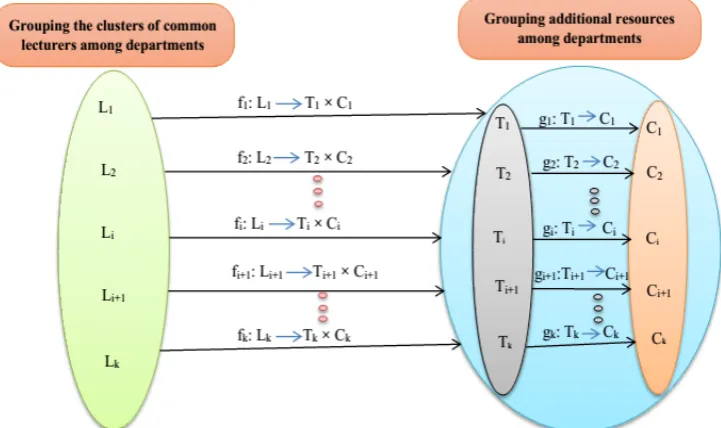
Before mapping these functions, the way of independently mapping of function g has
been shown in fig. 4 for the resources of each department and the function f within fig. 5 has
been represented to map the common lecturers among departments in additional resources.
Fig. 4: Mapping time slots in classes
3. Mapping
In the third phase the mapping function is as
i i i
i L T C
f : → × , where fi is the mapping function of
priorities and requirements of common lecturers (soft constraints of common lecturers), Lis are the representative clusters of common lecturers among departments, Tis represent additional time slots among departments and Cis also represent additional classes among departments. However, before mapping function f, the mapping of function f must also been performed by agent
TraA for the resources among departments as
j j
j T C
g : → . Fig. 6 presents the way of mapping
two functions f and g for the common lecturers to the additional resources among departments.
IV. RESULTS AND EXPERIMENTS
To test the structure of the proposed algorithm, we consider a data set including 30 lecturers, 5 departments (computer engineering, electronic engineering, civil engineering, humanity science and mathematics), 7 weekly time slots (Saturday, Sunday, Monday, Tuesday, Wednesday, Thursday, Friday), 7 daily time slots (8-9:30, 10-11:30, 12-13, 13-14:30, 15-16:30, 17-18:30 and 19-20:30) and 13 classrooms per department (3 practical classes an 10 theoretical classes). The properties of the system to implement include a CPU with
2.13 GHZ speed, 3GB RAM and Win7 operating
system and the implementation tools also include 1) C#.net 2010 programming language, 2) using
SQL server 2008 software for querying from the databases and 3) reporting by Crystal Report v.13. Total number of resources in the university equals to (7×7×5×(10+3))÷5 and if we want to calculate the separate resources of each department we would have and the total number of the remained additional resources is obtained
as [(7×7×5×(10+3))−(7×7×(10+3))]. The fuzzy
c-means clustering algorithms must be performed
to find the loss percent of additional resources per
department so that the minimized percent of additional resources per department,
( )
(7×7×10+3)×100;D= ,1,5
DepD , is obtained as the
dedicated resources of each department divided by whole resources of departments, therefore, each Dth department minimizes the loss percent
of its additional resources.
1. The criteria of evaluating the CLTTP problem’s purposes
After using the fuzzy c-means clustering algorithm and allocating to (additional) resources, the following relations are presented to evaluate the criteria of the paper. Equation 15, CTDS1(i),
computes the descending satisfaction percent of each common lecturer among departments’ features at each cluster and equation 16, CTDS2(ij),
also obtains the descending satisfaction percent of each common lecturer among departments’ priorities and features among clusters and over
each cluster.
Equation 15 is calculated per cluster. The numerator of this equation means how many requirements and features of the kth common lecturer in ith cluster presented initially as a report
(selections and requirements of each department
also could be considered) have been satisfied
and the denominator of this equation represents the total number of requests, priorities and requirements of kth common lecturer at that ith cluster which is the sum of satisfied priorities and requirements accompanied with the dissatisfied
priorities at ith cluster for the kth common lecturer
and the satisfaction percent of kth common
lecturer’s feature is obtained at ith cluster.
In equation 15, the ith cluster with i=1,....,c;c=7
shows the k number of common lecturers
k=1,....,n;n=30 and WikSC constraints satisfied for Xik common lecturer (kth lecturer at ith cluster). In
this equation, SC const
Total expresses all the constraints
of common lecturers at each cluster per common
lecturer. For example,
(
X11+X12+X13)
means thefeature of common lecturer 1 has been satisfied at
cluster 1.
Equation 16, represents the amount of competitiveness among clusters in terms of satisfaction percent of requirements, constraints and priorities of common lecturers among departments of each cluster, it means that we
could find that at which ith cluster which kth common lecturer has more satisfied priorities
and requirements over other common lecturers within each ith cluster and other j cluster with
j=i+1,i+2,... .
The numerator of this fraction must compute the satisfaction percent of each kth common
lecturer in terms of each ith cluster and the
obtain that percent over other j cluster and the
denominator of this fraction must find the sum
of whole satisfactions of each common lecturer at ith cluster with whole dissatisfactions of each
common lecturer at ith cluster and then this
iterates per j remained clusters so that the percent of real satisfactions of each cluster with their common lecturers would be obtained over whole satisfactions and dissatisfaction of per cluster and then the satisfaction percent of each cluster could be obtained over common lecturers and their allocation priority to the additional resources by dividing and averaging the obtained values of each cluster.
In equation 16, i=1,....,c is the number of clusters, WiSC is the satisfaction percent of
common lecturers’ constraints of ith cluster and j also represents the number of other clusters in addition to ith cluster where j=i+1,....,c and c=7.
In this equation, the value of must be calculated
in terms of the number of satisfied constraints
for kth common lecturer at ith cluster over total
number of ith cluster’s constraints for the common
lecturers within this cluster. After obtaining a percent for each ith cluster and common lecturers of those clusters, we could observe that which
clusters have maximum satisfaction degree or minimum violation, so at first that cluster would
have the priority of allocation and after reaching for instance to ith cluster, now we must look
for those common lecturer within ith cluster whose satisfaction percent is the highest or they have minimum violation percent over his/her features and requirements and this is done upon
(
)
(
)
(
1 2 3) (
11 12 13)
(
301 302 303)
30 1 3 1 1 1 1 1 1 1 1 ) (
1 100 100
X X X X X X X X X X L Total L W Total X W CTDS n k m j n
k k k k
k ik r Const n k Const k r Const n k ik Const ik r const SC const n k ik SC ik i
j = + + = + + + + + +
equation15.
We could obtain the loss percent of additional resources among departments after clustering and mapping process per department based on equation 17.
100 × =
b a
ERWA (17)
In equation 17, ERWA:(ExtraResourcesWaste)After
means the loss of additional resources after clustering and mapping processes. Here, a represents the number of the remained additional resources of each department after allocation and
b corresponds to the total number of existing
resources at each department. To realize ERWA
equation, each department must apply its resources’ allocation process to each common lecturer selectively (from the common lecturer himself/herself) and mandatory (from each department). The remained additional resources among departments equals to the subtraction of total number of departments’ resources to the allocated resources by common lecturers and trainings of each department.
2. The performance of fuzzy c-means clustering algorithm over dataset
Based on the dataset presented in the first part
of section 4, now we could test the fuzzy c-means clustering algorithm on them. In Fig. 7, the fuzzy c-means clustering algorithm based on section 3.3.1 and performing the sequence of rules on the compatible fuzzy c-means algorithm with common lecturers time tabling problem have been
represented. In Fig. 7, buttons Execute Fuzzy
c-means Algorithm, Traverser Agent and epsilon show the performing of fuzzy c-means algorithm, the traverser agent and the value of parameters
ε=0.9, respectively. 9 columns in Fig. 7, each one
from left to right are shown as the sequence of X3 (faculty feature), X2 (weekly timeslot feature), X1 (daily timeslot feature), fuzzy computed value (this column is performed based on section 3.3.1 and corresponding to the compatible relations with common lecturers time tabling problem), class code (theory, practical), common lecturer’s code, weekly timeslot code, daily timeslot code and faculty code. It must be said that the fuzzy
value is performed after clicking button Execute
Fuzzy c-means Algorithm with considering the value of epsilon=0.9. In Fig. 7, button traverser agent in the section 4.4, would present the way of traversing additional resources of faculties accompanied with mapping the common lecturers to those additional resources. Column 4, which is the computed fuzzy value, is obtained after applying the relation on compatible fuzzy c-means clustering algorithm based on section 3.3.1.
3. Comparison of adopted k-means and proposed funnel-shape clustering algorithm with the fuzzy c-means clustering algorithm adopted
In this section, we have shown the process of comparing k-means, fuzzy c-means and funnel-shape clustering algorithms in Fig.s 9, 10 and 11, respectively and also provided a brief comparison as distinct for each faculty based on each 3 clustering algorithms in Fig. 12. In Fig.
12, we have shown a final pie chart in terms of
common lecturers satisfaction percent based on each clustering algorithm.
In Fig. 9, the comparison result of k-means algorithm’s satisfaction is shown for each 25 common lecturers among faculties as 3D (three dimensional). In this Fig., three length, width and height dimensions represent the common lecturer’s code, the faculty code and the satisfaction percent of common lecturers, respectively.
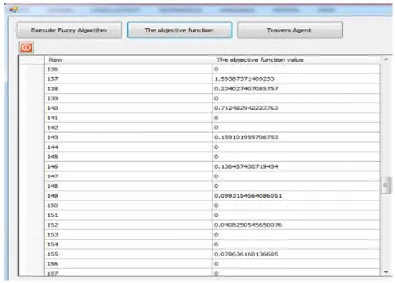
In Fig. 8, objective function in fuzzy c-means clustering algorithm computed.
Fig. 8: The result of objective function computed in fuzzy c-means clustering algorithm
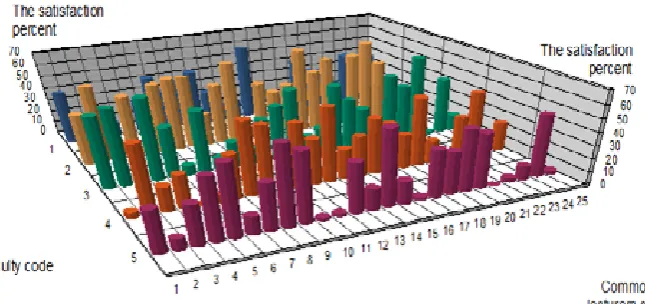
In Fig. 10, the comparison result of fuzzy c-means algorithm’s satisfaction of each 25 common lecturers among faculties is shown as 3D (three dimensional). In this Fig., three length, width and height dimensions represent the common lecturers’ code, the faculty code and the satisfaction percent of common lecturers, respectively.
In Fig. 11, the comparison result of funnel-shape algorithm’s satisfaction of each 25 common lecturers among faculties is shown as 3D (three dimensional). In this Fig., three length, width and height dimensions represent
the common lecturers’ code, the faculty code and the satisfaction percent of common lecturers, respectively.
In Fig. 12, the minimum and maximum
satisfaction percent of common lecturers among faculties have been shown for 5 faculties, 25 common lecturers corresponding to the dataset
and 3 clustering algorithms. In the first five Fig.s,
the satisfaction percent of common lecturers is shown based on each clustering algorithm per
faculty and finally the pie chart in the Fig. 12
shows the summary of satisfaction percent of common lecturers among faculties separately and
Fig. 10: The satisfaction percent of common lecturers based on fuzzy c-means algorithm
in terms of clustering algorithms. The satisfaction percent of k-means, fuzzy c-means and funnel-shape clustering algorithms are as 28.19%, 38.6% and 33.2 %.
4. Traversing (additional) resources among departments and mapping the clusters of common lecturers by fuzzy c-means clustering algorithm
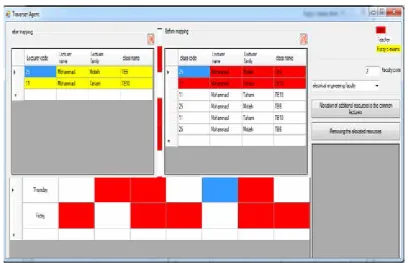
Fig. 13 show the way of mapping the clusters of common lecturers to the additional resources of each 5 faculties by using fuzzy c-means clustering algorithm.
In this shape, by clicking the button of deleting the allocated resources, all previously allocated resources per faculty are removed and by selecting the button of allocating the additional resources to the common lecturers, the act of emptying the stack of common lecturers’ clusters list is done to map to the additional resources among faculties.
Since the assumptions related to the constraints and resources have been considered constant per faculty, so the allocation is done based on two selections where one is from the education (the related group) of each faculty and the other one is from the common lecturers among faculties.
Fig. 12: The descending satisfaction percent of priorities of common lecturers among departments based on clustering algorithms
In Fig. 13, the red color shows the education (group) selections of each faculty, the white color represents the selections of each common lecturer, In Fig. 13 the yellow color show the allocations of selections of each common lecturer to their constraints and priorities in fuzzy c-means clustering algorithms after mapping process.
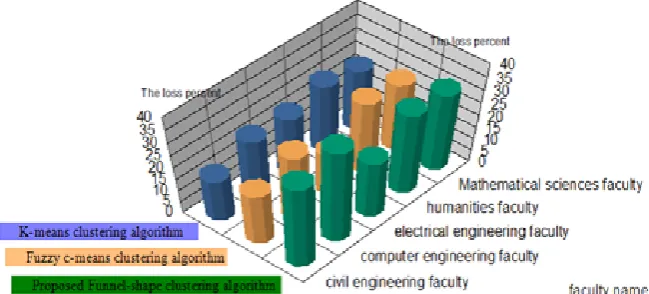
Fig. 14 shows the additional resources loss
percent per five faculties corresponding to each
clustering algorithm.
Table 1 shows the overall result of each three algorithms based on three clustering algorithms.
However, here we could say that the first goal
is to minimize the loss of additional resources of faculties for clustering algorithms from the
maximum to minimum fuzzy c-means clustering
(41.288%), funnel shape clustering (the proposed funnel) (32.55%) and k-means clustering (26.16%) and the second goal is to satisfy the priorities of common lecturers among faculties in a descending manner where for clustering
algorithms from the maximum to minimum as
fuzzy c-means clustering (38.6%), the proposed funnel clustering (33.2%) and k-means clustering (28.1%).
Fig. 14: Minimizing the loss of additional resources among departments through clustering algorithms
Table 1: Comparison of clustering algorithms based on research goals
The proposed clustering Standard clustering
Research goals The proposed funnel-shape
clustering k-means
clustering Fuzzy c- means
clustering
32.55% 26.16%
41.288% Loss minimization Faculties
additional resources
33.2% 28.1%
38.6% Descending satisfaction of
5. Discussion
In this section, effects of the proposed method’s
advantages and disadvantages are discussed.
a. Disadvantages
Variability of lecturers’ constraints and
priorities in department where in the real context,
it is not possible to satisfy all the requirements and
priorities of involved events in a desirable extent
and for this purpose a descending satisfaction is considered.
Limitation of appropriate and desirable resources in system to perform lecturers’ timetabling process and traversing resources.
Not applying meta-heuristic and hybrid
methods which leads to relative loss of efficiency
of proposed algorithm in generating tables with
primary timetabling ability within the existing
agents in the system.
b. Advantages
Considering the priorities of lecturers
specifically and their constraints in order to
uniformly distribution over available resources. In timetabling lecturers, most of their clear
features are employed sufficiently.
Applying multi agent system based method to increase the autonomy of each department’s timetabling where this autonomy prevents unplanned collisions and allocations among agents within distributed environment.
V. CONCLUSION
In this article, the obtained results from the CLTTP problem’s purposes through the proposed approach include: 1- the proposed method results in a descending satisfaction from the priorities (soft constraints) of common lecturers among departments to allocate additional resources and 2- the loss of additional resources (unused) at each minimized department which represents the allocation of common lecturers to resources with an improving process. The future approach to solve UCTTP problem would be to work on multi agent based methods as a distributed architecture and apply modern syntactic and fuzzy meta-heuristic approaches where for
example we can use meta-heuristic algorithms
for two agents TAi and MA in order to increase throughput in generating and improving time
tables. In this problem we can use fuzzy c-means clustering algorithm by applying features weight learning (soft constraints of common lecturers) in generating more improved time tables based on common lecturers among departments where this
algorithm could be executed after performing the
process of mapping function f and transferring time tables to each agent (department). It must be noted that this method could be used to generate
improved time tables in the first phase for each
department locally. However, various types of events and resources’ features within CLTTP
problem could be considered in different kinds of
clustering methods and various mapping methods could be used in such clustering approaches.
REFERENCES
[1] Babaei, H., Karimpour, J., Hadidi, A., “A survey of approaches for university course timetabling problem,” Computers & Industrial Engineering 86 (2015), pp. 43–59, 2015.
[2] Feizi-Derakhshi, M. R., Babaei, H., Heidarzadeh, J., “A Survey of Approaches for University Course TimeTabling Problem,” Proceedings of 8th International Symposium on Intelligent and Manufacturing Systems, Sakarya University Department of Industrial Engineering, Adrasan, Antalya, Turkey, pp. 307-321, 2012.
[3] Obit, J. H., Developing Novel Meta-heuristic, Hyper-heuristic and Cooperative Search for Course Timetabling Problems, Ph.D. Thesis, School of Computer Science University of Nottingham, 2010.
[4] Gotlib, C. C., “The Construction of Class-Teacher
TimeTables,” Proc IFIP Congress, Vol. 62, pp. 73-77, 1963. [5] Asmuni, H., Fuzzy Methodologies for Automated University Timetabling Solution Construction and Evaluation, Ph.D. Thesis, School of Computer Science University of Nottingham, 2008.
[6] Lewis, M. R., Metaheuristics for University Course Timetabling, Ph.D. Thesis, Napier University, 2006.
[7] Redl, T. A., A Study of University Timetabling that
Blends Graph Coloring with the Satisfaction of Various
Essential and Preferential Conditions, Ph.D. Thesis, Rice
University, Houston, Texas, 2004.
[8] S. Srinivasan, J. Singh, V. Kumar, Multi-Agent based Decision Support System Using Data Mining and Case Based Reasoning, IJCSI International Journal of Computer Science Issues, Vol. 8, Issue 4, No 2, July 2011.
[9] Obit, J. H., Landa-Silva, D., Ouelhadj, D., Khan Vun, T., Alfred, R., “Designing a Multi-Agent Approach System for Distributed Course TimeTabling,” IEEE, 2011.
[10] Wangmaeteekul, P., Using Distributed Agents to Create University Course TimeTables Addressing Essential Desirable Constraints and Fair Allocation of Resources, Ph.D. Thesis, School of Engineering & Computing Sciences Durham University, 2011.
Clustering Algorithm to Group Students in A Course into
Smaller Sections,” Springer-Verlag Berlin Heidelberg, LNCS 3616, pp. 147–160, 2005.
[12] Shatnawi, S., Al -Rababah, K., Bani-Ismail, B., “Applying a Novel Clustering Technique Based on FP- Tree to University Timetabling Problem: A Case Study,” IEEE, 2010.
[13] D. DeWerra, An Introduction to TimeTabling, European Journal of Operational Research, 19: pp. 151-162, 1985.
[14] G.M. Asham, M.M. Soliman, A.R. Ramadan, Trans Genetic Coloring Approach for Timetabling Problem, Artificial Intelligence Techniques Novel Approaches &
Practical Applications, IJCA, pp. 17-25, 2011.
[15] S. Daskalaki, T. Birbas, E. Housos, An integer programming formulation for a case study in university timetabling, European Journal of Operational Research, 153 (2004), pp. 117–135, 2004.
[16] S. Daskalaki, T. Birbas, Efficient solutions
for a university timetabling problem through integer programming, European Journal of Operational Research, 160 (2005), pp. 106–120, 2005.
[17] P. Khonggamnerd, S. Innet, On Improvement
of Effectiveness in Automatic University Timetabling Arrangement with Applied Genetic Algorithm,
978-0-7695-3896-9, IEEE, 2009.
[18] O. MK. Alsmadi, Z. S. Abo-Hammour, D. I. Abu-Al-Nadi, A. Algsoon, A Novel Genetic Algorithm Technique
for Solving University Course Timetabling Problems, 978-1-4577-0690-5/11, IEEE, 2011.
[19] A. Mayer, C. Nothegger, A. Chwatal, G. Raidl,
Solving the Post Enrolment Course Timetabling Problem by Ant Colony Optimization, In Proceedings of the 7th International Conference on the Practice and Theory of Automated Timetabling, 2008.
[20] M. Ayob, G. Jaradat, Hybrid Ant Colony Systems
For Course Timetabling Problems, 2nd Conference on Data Mining and Optimization 27-28 October 2009, Selangor, Malaysia, IEEE, pp. 120-126, 2009.
[21] N. S. Jat Y. Shengxiang, A Memetic Algorithm
for the University Course Timetabling Problem, 20th
IEEE International Conference on Tools with Artificial
Intelligence, IEEE, pp. 427-433, 2008.
[22] R. Alvarez, E. Crespo, J. M. Tamarit, Design and Implementation of a Course Scheduling System Using Tabu Search, European Journal of Operational Research 137, pp. 512-523, 2002.
[23] C. H. Aladag, G. Hocaoglu, A. M. Basaran, The effect of neighborhood structures on tabu search algorithm in solving course timetabling problem, Expert Systems with
Application, 36 (2009), pp. 12349–12356, 2009.
[24] M. Tuga, R. Berretta, A. Mendes, A Hybrid Simulated Annealing with Kempe Chain Neighborhood for the University Timetabling Problem, 6th IEEE/ACIS International Conference on Computer and Information Science (ICIS 2007), 2007.
[25] Y. Shengxiang, N.S. Jat, Genetic Algorithms with Guided and Local Search Strategies for University Course
Timetabling, IEEE Transactions on Systems, MAN, and Cybernetics-PART C: Applications and Reviews, Vol. 41, No. 1, January 2011.
[26] S. Abdullah, E.K. Burke, B. McColloum, An Investigation of Variable Neighborhood Search for University Course Timetabling, In The 2th Multidisciplinary Conference on Scheduling: Theory and Applications, NY, USA, pages 413-427, 2005.
[27] P. Kostuch, The University Course Timetabling Problem with a Three-Phase Approach, In Lecture Notes in Computer science, pages 109-125, Springer-Berlin / Heidelberg, 2005.
[28] M. Shahvali Kohshori, M. Saniee Abadeh, Hybrid
Genetic Algorithms for University Course Timetabling,
IJCSI International Journal of Computer Science Issues, Vol. 9, Issue 2, No 2, March 2012.
[29] H. Asmuni, E.K. Burke, J.M. Garibaldi, Fuzzy
multiple heuristic ordering for course timetabling, The Proceedings of the 5th United Kingdom Workshop on Computational Intelligence (UKCI05), London, UK, pp 302-309 (2005b).
[30] A. Golabpour, H. Mozdorani Shirazi, A. Farahi,
M. kootiani, H. beige, A fuzzy solution based on Memetic algorithms for timetabling, International Conference on MultiMedia and Information Technology, IEEE, pp. 108-110, 2008.
[31] A. Chaudhuri, D. Kajal, Fuzzy Genetic Heuristic
for University Course Timetable Problem. Int. J. Advance. Soft Comput. Appl., Vol. 2, No. 1, ISSN 2074-8523, March 2010.
[32] Ross, j., T., “Fuzzy Logic with Engineering Applications,” John Wiley & Sons Ltd, University of New