Microscopic Parameters in the Excited State of Toluene
and Some of Its Haloderavatives
A.M.O. Abdul Raheem,
1,*I. Iweibo,
2and N. Obi-Egbedi
21Chemistry Department, University of Ilorin, PMB 1515, Ilorin, Nigeria 2Chemistry Department, University of Ibadan, Ibadan, Nigeria
Received: 2 May 2009 / Revised: 30 November 2009 / Accepted: 2 January 2010
Abstract
The Ultraviolet-visible (UV) spectra of toluene, ortho-bromo and para-bromo
toluene in different solvents have been studied. The electric dipole moments and
polarizabilities in the molecular excited electronic states were determined. It was
found that the electric dipole moments for the excited states (µ*) and the ground
states (µ) of these compounds are equal, and the change in dipole moment is zero.
This implies, in part, little or no change in potential energy surfaces of the ground
and the excited states. The negative values obtained for the change in
polarizabilities (
∆α
) for the Lb state in various transitions indicate contraction in
the excited state relative to the ground state, because the polarizability is
proportional to the molecular volume.
Keywords: Microscopic; Dipole moment; Polarizability; Toluene; Haloderivatives
* Corresponding author, Tel.: +2348035952356, Fax: +2348023416862, E-mail: [email protected]
Introduction
Extensive studies on the electronic absorption spectra of different compounds have been reported [1-3], however, few works were reported specifically on benzene and its various derivatives [4-5]. Perturbation of electronic spectra of benzene and some of its derivatives have been previously investigated by a number of workers both experimentally and theoretically by electronic absorption spectroscopy and molecular orbital calculations [6-8]. It was well established that the electronic transition 1Lb is symmetry forbidden but appears at longer wavelength on substitution at various positions on the benzene ring [7,9]. Recently, the electronic and vibrational spectra of benzene and some of its derivatives have been reported, [10] and of all the systems of benzene and its
derivatives, the 1B2u ← 1A1g electronic system (lying
around λ = 2600 nm) has been studied in great detail. In
view of the limited studies, particularly in the second
system (groups that can resonate with benzene π
electrons through the process of hyper – conjugation) it was felt that an extension of the studies to the infrared and electronic absorption spectra of some more di substituted benzenes would be worthwhile as this would enable one to have more insight into the structure of the molecules in their ground and excited states. Therefore we have particularly chosen some molecules of the type toluene and its halo derivatives and studied their infrared and electronic absorption spectra. The results are reported in this work.
Materials and Methods
Experimental
*Materials
toluene, ortho-bromo and para-bromo toluene compounds; (ii) Solvents used; Polar: -methanol, dichloro methane, propan -1-ol, propan -2–ol; Nonpolar: n–hexane, n–pentane, cyclohexane and 2,2,4–trimethyl pentane ; (b) Equipments;(i) Distillation Kits; (ii) Hilger and Watts Abbe refractometer M46; (iii) Perkin–Elmer, Lambda 3B double beam Spectrophotometer;
*Method
The solvents used are the products of British Drug Houses Ltd and were redistilled several times. The refractive indices of all liquids were determined with the Hilger and Watts Abbe refractometer M46 with accuracy of 0.0002. The magnitudes of the measured refractive indices showed conformity with the literature values [4,11-12] for pure grade types. Dichloromethane, 2,2,4–trimethyl pentane and cyclohaxane were products of Tokyo Kasei (Japan) and are of spectroscopic grade. The absorption spectra of dilute solutions of all these compounds are in the concentration range of 5 – 10-4 mol dm-3 were determined with the Perkin-Elmer, Lambda 3B double beam spectrophotometer in the wavelength range of 190-300 nm. A pair of matched cuvettes of 1cm optical path-length and thermostated at 20°C contained separately the solution and the solvent as reference. Spectral runs were made with the instrumental band width set at 1.0 nm and a scan speed of 1 nm s-1 and absorbance of 0.5 that corresponds to the recorder chart full scale. In spectra that showed vibrational fine structures, typical of all runs except for p-bromo toluene in the solvents, the position of the first intense vibrational component of a vibronic band was chosen as the transition frequency in harmony with the reported 0-0 bands of vapour phase spectra.
At least 11 solvents including polar and nonpolar were used in the study of electronic spectrum of each compound.
Theoretical Consideration and Data Analysis
Equation (1) derived by ABE [11] relates the
transition energy in solution (hυs) to that of the vapour
phase (hυv) and to the Van der Waals’ interaction
energies because the energy of the electronic transition
in the isolated molecules hυa needed to be modified
by the solvation energies of the initial and final states of the molecule.
(
)
(
)
2 2 2
6 2 2 6 2 3 3
2 1 1
a a b
s v a a
ab
a a a b a b b
b b ab
a a h h dkT dr I I I I d r I I
μ μ μ
υ υ α α
μ μ α α α
∗ ∗ ∗ ∗ ∗ ⎧ − ⎫ ⎪ ⎪ = ⎨ + − ⎬ ⎪ ⎪ ⎩ ⎭ ⎧ − ⎛ ⎞⎫ −⎪ + ⎜ − ⎟⎪ ⎨ ⎜ + + ⎟⎬ ⎜ ⎟ ⎪ ⎝ ⎠⎪ ⎩ ⎭ (1)
In this equation, h is planck’s constant and υ the
transition frequency; µ, α, and I are the electronic dipole
moment, polarizability and the ionization potential, respectively, of the solute or solvent in the ground electronic state while the corresponding starred symbols
are those of the excited state, subscript a and b denote
the solute and solvent molecules, while s and v identify the solution and vapour phases respectively;
6 6
1
m ab abi
i
r− r−
=
=
∑
where rab is the internuclear distancebetween the solute and the i-th solvent molecule, m being the number of solvent molecules interacting with
the solute molecule; 6
ab
r− is computed using the
following equation [11,13],
(
)
(
)
6
4 4
2 2 3
ab
v u v v u v
r
r r r r r r
π π
− = +
+ + (2)
in which 1 3 (0.75) m r V Nπ ⎧ ⎫ = ⎨ ⎬ ⎩ ⎭
Vm is the molar volume obtained from Van der Waals volume [14,15], r represents the molecular radius of the solute (ru) or solvent (rv) derived from molar volume. In the present analysis the molecular radius of a solute or solvent was determined from mass and density
or its Van der Waals’ volume: d=4πε0 in the S.I units
(ε0 being the permittivity of free space) and in the c.g.s
units; k and T are Boltzmann constant and temperature of the solution respectively. For our present purpose we rearrange equation (1) into the following convenient linear regression forms;
(
2 2)
1 2
a a
a
Y X X
d μ μ α ∗ ∗ −
= + (3)
(
2 2)
1 2 2 a a a X Y
X d X
μ μ α
∗
∗ −
= + (4)
(
2 2)
2 1 1 a a a X Y
X d X
μ μ α ∗
∗ −
= + (5)
The dependent variables are Y, Y/X2 and Y/X1 in equations (3) – (5) respectively, and the independent variables are X1 and X2 in equation (3), X1/X2 in equation (4) and X2/X1 in equation (5).
The following definitions hold in eqns. (3) – (5):
(
v s)
a 3Y = hυ −hυ +α X (6)
2 6 1 2 3 b ab b X r dkT μ α − ⎛ ⎞ =⎜⎜ + ⎟⎟
2 6 2 3 2 1
b b b
ab b a I X r d I I
μ α −
∗ ⎛ ⎞ =⎜ + ⎟ ⎛ ⎞ ⎜ ⎜ + ⎟⎟ ⎜ ⎝ ⎠⎟ ⎝ ⎠ (8) 2 6 3 3 2 1
b a b
ab b a I X r d I I
μ α −
⎧ ⎫ =⎪ + ⎪ ⎛ ⎞ ⎨ + ⎬ ⎜ ⎟ ⎪ ⎪ ⎝ ⎠ ⎩ ⎭ (9)
a a v
I∗ =I −hυ (10)
In the application of LINDER’S variant of Equation
(1), Y =2(hυv −hυ αs + aX3) in Equations (3) – (5)
satisfy the statistical criterion for regression or graphical analysis, that is, the error in the dependent variable is far greater than that of the independent variable.
Tables 1 to 3 show the behaviour of toluene, o-bromo and p-o-bromo toluene in polar and nonpolar solvents. Table 4 shows the molecular data used for the generation of Y, X1 and X2 for the least square and graphical analyses of data while Table 5 shows the summary of excited state electric dipole moment, polarizability and ionization potentials for all the compounds, as calculated.
Results and Discussion
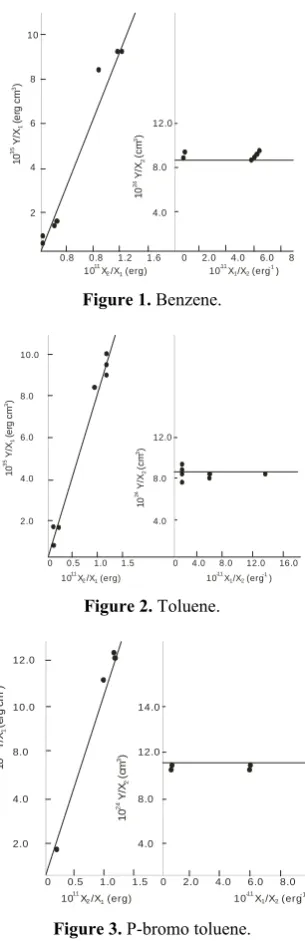
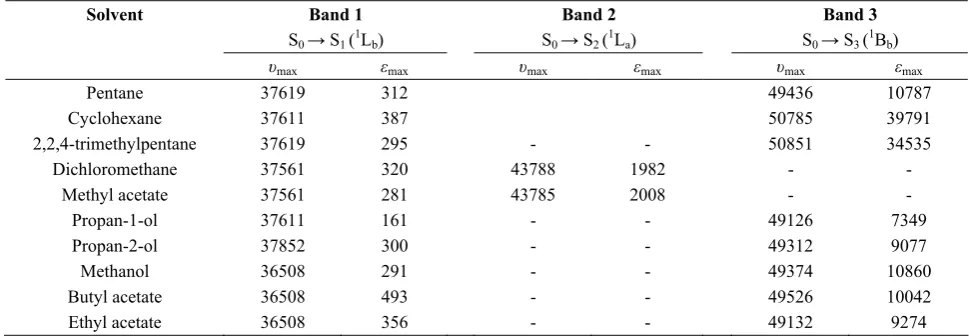
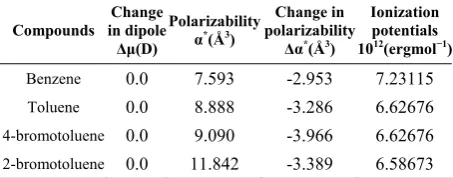
Figures 1 - 4 shows the plots of the data on solvent
frequency perturbation of 1L
b band of benzene, toluene,
p- bromo and o- bromo toluene according to equations (4) and (5) respectively. Tables 1-3 summarize the
maximum absorption frequencies (υmax) and the
corresponding molar absorptivities (εmax) for the
transitions in each compound. Although three bands are expected to show the different transition levels, however, these varies based on solvents used and the compound caged [10]. For example in table 1 toluene has 2 major bands both in some of the polar and nonpolar solvents used though at different wavelength-shift except in cyclohexane and 2,2,4 trimethyl pentane where the third band appear as a shoulder at higher wavelength. This could be attributed to their transparency to the compound caged. However, dichloro methane and methyl acetate have only one band.
These transition bands are been refer to as 1L
b for the
first band because the transition is from So to S1 energy
levels; 1L
a for the second band as the transition is from
the So to S2 energy level and the third band has
transition from So to S3 (1Bb) where the So stands for the
ground state.
Tables 4 and 5 give the summary of the values of the vapour phase transition frequency, equivalent hard
0 0.8 0.8 1.2 1.6 0 2.0 4.0 6.0 8 10 8 6 4 2 12.0 8.0 4.0
10 X /X (erg)11
2 1 10 X /X (erg )
-11 1 2 -1 10 Y /X (e rg c m ) 35 1 3 10 Y /X (c m ) 24 2 3
Figure 1. Benzene.
0 0.5 1.0 1.5 10.0 8.0 6.0 4.0 2.0 12.0 8.0 4.0
10 X /X (erg)11
2 1 10 X /X (erg ) -11
1 2 -1
0 4.0 8.0 12.0 16.0
1 0 Y /X (er g c m ) 35 1 3 10 Y /X (c m ) 24 2 3
Figure 2. Toluene.
0 0.5 1.0 1.5 12.0 10.0 8.0 4.0 2.0 14.0 12.0 8.0 4.0
10 X /X (erg)11
2 1 10 X /X (erg )
-11 1 2
-1
0 2.0 4.0 6.0 8.0
10 Y /X (er g c m ) 35 1 3 10 Y /X (c m ) 24 2 3
Figure 3. P-bromo toluene.
0 0.5 1.0 1.5 14.0 12.0 10.0 8.0 4.0 2.0 14.0 14.0 12.0 8.0 4.0
10 X /X (erg)11 2 1 1 0 Y /X (er g c m ) 35 1 3 10 Y /X (c m ) 24 2 3
10 X /X (erg )-11 1 2
-1
0 4.0 8.0 12.0 16.0
Table 1. The transition frequencies (cm-1) and molar absorptivity (mol-1dm3cm-1) of toluene in different cavities
Solvent Band 1 Band 2 Band 3
S0 → S1 (1Lb) S0 → S2 (1La) S0 → S3 (1Bb)
υmax εmax υmax εmax υmax εmax
Pentane 38222 291 48217 7194 - -
Cyclohexane 38529 259 48217 7803 51932 19,775
2,2,4-trimethylpentane 38259 223 48336 6507 51359 4502
Dichloromethane 38158 265 - - - -
Methyl acetate 38265 272 - - - -
Propan-1-ol 38222 203 48039 6337 - -
Propan-2-ol 38222 228 47514 6564 - -
Methanol 38222 237 48098 6215 - -
Butyl acetate 38222 246 48098 6205 - -
Ethyl acetate 38222 256 48298 6110 - -
Table 2. The transition frequencies (cm-1) and molar absorptivity (mol-1dm3cm-1) of p-bromo toluene in different cavities
Solvent Band 1 Band 2 Band 3
S0 → S1 (1Lb) S0 → S2 (1La) S0 → S3 (1Bb)
υmax εmax υmax εmax υmax εmax
Pentane 37062 397 45416 9459 49688 8849
Cyclohexane 37062 457 45310 9622 50719 36415
2,2,4-trimethylpentane 37062 418 45521 10581 50917 34984
Dichloromethane 37097 359 43690 4055 - -
Methyl acetate 37097 465 44250 4369 - -
Propan-1-ol 37097 350 45416 8931 49187 5685
Propan-2-ol 36104 362 45575 8850 49625 6906
Methanol 36104 646 45521 8513 49688 8786
Butyl acetate 36104 725 45527 10651 49688 10521
Ethyl acetate 36104 629 45617 8260 50421 9625
Table 3. The transition frequencies (cm-1) and molar absorptivity (mol-1dm3cm-1) of o-bromo toluene in different cavities
Solvent Band 1 Band 2 Band 3
S0 → S1 (1Lb) S0 → S2 (1La) S0 → S3 (1Bb)
υmax εmax υmax εmax υmax εmax
Pentane 37619 312 49436 10787
Cyclohexane 37611 387 50785 39791
2,2,4-trimethylpentane 37619 295 - - 50851 34535
Dichloromethane 37561 320 43788 1982 - -
Methyl acetate 37561 281 43785 2008 - -
Propan-1-ol 37611 161 - - 49126 7349
Propan-2-ol 37852 300 - - 49312 9077
Methanol 36508 291 - - 49374 10860
Butyl acetate 36508 493 - - 49526 10042
Ethyl acetate 36508 356 - - 49132 9274
sphere radius, ground state and excited state electric dipole moments, polarizabilities and ionization poten-tials of all the compounds according to equations 3 -5
and 10.
The bands 1, 2, and 3 are denoted by S0 → S1 (1Lb),
increasing energy respectively. The 1Lb, band is well separated from the other two bands in all the compou-nds. The magnitude of bathochromic and hypsochromic effects depends on how polar or nonpolar the solvent is relative to methanol and pentane, respectively.
Toluene
Benzene is the parent compound upon which different substitution were made and tested in different solvents. In Tables 5 and 6, benzene has the highest vapor phase frequency, the least hard sphere radius, electric polarizabilities and highest ionization potential in ground state from the literature [16] compared to all of its derivatives used in this study. Since polarizability
(α) is directly proportional to the cube of radius (r3), the
change in polarizabilities, that is, ∆α = -2.953Å3, shows
that it exhibits lowest contraction in its transition to 1Lb excited state compared to its other derivatives.
For toluene the S0 → S1 (1Lb) band appear slightly
shifted towards the red in non polar solvents. This transition is quantum mechanically and overlap forbidden which make it symmetry forbidden.
The 1Lb and 1Bb bands appeared together and overlap more in polar compared to nonpolar solvent
where they are fairly resolved. The intensity of S0 → S2
band in different solvents decreases as polarity of the
solvent decreases. The most intense band is S0 → S2
while the least is S0 → S1, i.e. 1La band is quantum
mechanically forbidden but overlap allowed (partially
symmetry allowed). The magnitude of ∆α is more
negative in toluene than it is in benzene, i.e., contractions of the benzene ring in toluene’s excited state are larger, which could be attributed to resonance
of methyl group of toluene with the π electrons of
benzene through the process of hyper – conjugation [17]
P- bromo toluene
Conjugation between the methyl and the bromine atom in the 1, 4 position is larger relative to the 1, 2 position which causes the So- S1 band of p -bromo to occurs at lower energy and higher intensity relative to
o-bromo. The high εmax could be attributed to the lack of
steric effect between CH methyl hydrogen atom and the bromine also due to 1, 4 positions. This is reverse in the case of o-bromo toluene based on the juxtaposition of the CH methyl group and bromine atom. The reduced transition energy is due to the reduction of energy separation between the LUMO and HOMO energy levels. All these accounted for its having the highest
contraction in the excited state (∆α = -3.966ų)
compared to all other compounds used.
O – bromo toluene
In table 3 the S0 → S1 (1Lb) transition appears red
shifted in nonpolar solvents relative to polar solvents. The band is symmetry forbidden. Relative to toluene, a red shift is observed and molar absorptivity is low as
expected from a forbidden transition. S0 → S2 (1La)
band occurs separately with a small shoulder in the high
frequency region. The band has high
(
εmax)
relative top- bromo, due to intensity borrowing from S0 → S3
band as well as larger mesomeric effect of bromine relative to chlorine which allows delocalization of lone
pair electrons into the benzenoid ring. S0 → S3 occurs
only in near UV region in transparent solvents like 2, 2, 4 trimethyl pentane and is red shifted relative to p–
bromo toluene. Considering the ∆α value (-3.389) it
shows that excited state contraction is lower than that of para derivative but higher than that of benzene, that is,
the value of dE
dr in it’s excited state is almost negligible
compared to that of benzene.
Solvent and substituent perturbations of the electronic spectral properties as well as excited state electric dipole moment and polarizability of toluene, o-bromo, and p - bromo toluene have been determined. The introduction of methyl group to benzene ring affects its symmetry (lowers it) and it is found that
Table 4. calculated Ionization potentials, dipole moments,
polarizabilities, approximate (spherical) radii and wavenumber of the 0-0 electronic transitions of selected bands of the compounds
Parameter
(Unit) Benzene Toluene p-bromo toluene O-bromo toluene
1011I(erg) 1.41296 1.41296 1.38413 1.37721
v
υ (cm−1)
38089 37484 36263 36174 108r
u(Å) 2.86789 2.86789 3.05749 3.05744
1024α(cm3) 10.546 12.174 15.231 15.231
µ(D) 0.0 0.0 0.0 0.0
Table 5. Excited state electric dipole moment, polarizability
and ionization potentials of the compounds
Compounds in dipole Change
Δμ(D)
Polarizability α*(Å3)
Change in polarizability
Δα*(Å3)
Ionization potentials 1012(ergmol−1)
Benzene 0.0 7.593 -2.953 7.23115
Toluene 0.0 8.888 -3.286 6.62676
4-bromotoluene 0.0 9.090 -3.966 6.62676
further introduction of halide substitutes to this (toluene) causes red shift in the frequency of transition. As the substitute changes from the C4 to C2 position, there is a band shift towards shorter wavelength (blue-shift). All these observations accounted for in terms of Femo theory, as discussed by Creswell [18] and Keefe [7]. The solvent perturbation allows the assignment of
the transition to be π → π *, [19] the differentiation
between allowed and forbidden transition, and comparison of the relative charge densities of the structures of the compound in ground and exited states. Following the work done by Iweibo [4], an extension of the solvent frequency shift theory of ABE [11] and Linder’s work [20], we were able to determine a relatively precise value of the excited state electric dipole moments and polarizabilities of all the compounds. It is found that the electric dipole moment
of excited state and ground state are equal since Δμ is
zero. Considering the change in the electric dipole polarizabilities of these compounds during a transition, it was found that they increase in the order benzene < toluene < o - bromo toluene < p - bromo toluene. The
negative obtained for ∆ α values show that all these
compounds contract in their excited state in the order listed above.
Acknowledgement
The authors would acknowledge the Federal Government of Nigeria through the Federal Ministry of Education for the scholarship support of this research.
References
1. Pettersson A., Koivisto R., Lindgren B., Lundevll C., Royen P., Sassenberg U., Shi W. The electric Dipole moment of BIn state of ZrO. Journal of Molecular
Spectroscopy, 200: (1), 65 – 71 (2000).
2. Marek Jozefowicz, Piotr Milart and Janina R. Heldt. Determination of ground and excited state dipole moments of 4, 5’ – diamino [1,1’: 3’, 1” - terphenyl] – 4’,
6’ – di carbonitrile using solvatochromic method and quantum – chemical calculations. Spectrochimica Acta Part A, 74: (4), 959 – 963 (2009).
3. Nadejde C., Creanga D.E., Humeinicu I., Filip E., Dorohoi D.O. Study on the intermolecular interactions in rifampicin ternary solutions—Calculation of microscopic parameters of rifampicin molecules, Journal of molecular
liquids; 150, 51-55 (2009).
4. Iweibo, I., Chongwain, P. T., Obi-Egbedi, N. O., Lesi, A. F. Excited state electric dipole polarizabilities and moments by solvent spectral frequency shifts: Aniline, phenol and naphthalene. Spectrochimica Acta Part A, 47: (6), 705-712 (1991).
5. Dana-Ortansa Dorohoi., Anton Airinei, Mihaela Dimitriu. Intermolecular interactions in solutions of some amino – nitro – benzene derivatives, studied by spectral means. Spectrochimica Acta Part A, 73: (2), 257 – 262 (2009). 6. Iweibo I., Oderinde R.A. and Faniran J.A.: Electronic
absorption spectra and structures of aniline and its 4-chloro, penta fluoro and penta chloro derivatives. Spectrochim Acta 38A, 1(1982).
7. Keefe, C.D., Donovan, L.A. and Fleet, S.D.: Vibrational Assignment and dipole moment derivatives of liquid bromo benzene at 25oC. Journal of physical chemistry, A, 103, 6420 - 6428(1999).
8. Dana Dorohoi; Dan Dimitriu: Microscopic parameters in the excited states of some Anthracene derivatives. Studia Universitatis BABEŞ - BOLYAI, PHYSICA, SPECIAL ISSUE 2001.
9. Baylis, N.S and Hulme, L.: Solvent effects in the spectra of benzene, toluene and chloro-benzene at 2600 and 2000, Australian J.Chem. 6 (3) 257 - 277(1953)
10. Abdul Raheem, A M O; Bello I A; Obi Egbedi, N Solvents and substituents effects on the electronic absorption spectra of toluene and some of its halo derivatives. Science Focus 10 (1) 159 – 169 (2005). 11. Abe T., Dispersioninteractions and solvent-shift effects.
Bull. Chem. Soc. Jap. 33, 1314 (1965).
12. Abe T., Amako Y., Nishika T., Azumi H. , Bull. Chem. Soc. Jap. 39, 845 (1966).
13. Abe T., Iweibo I., Solvents and Substituents Effects on the Electronic Absorption; Bull. Chem. Soc. Jap. 58, 3415 (1985).
14. Bondi A., The 14-phenyl substituent is in a quasi-axial conformation, while the 14-cyano substituent; J. Phys Chem. 68, 441 (1964).
15. Whilhelm E., Battino R., "Solutions and Solubilities", TechniquesJ. Chem. Phys. 55, 4012 (1971).
16. Vul’fson S. G. Vest Stud. Nauch. Obschchest; Kazam Ges.Univ. 3, 94-99 (Russ) (1955).
17. Sponer H.,Wollman S. H. J. Chem. Phys. 9, 816 (1941). 18. Cresswell Clifford J., Runguist Olaf. A., Campbell
Malcom M. Spectral Analysis of Organic Compounds 2nd
edition (1987).
19. Harden Mc Connell. Effects of polar solvents on the absorption frequency of n → π electronic transition J. Chem. Phys. 20, 700 (1952).