194 Iranian Journal of Electrical & Electronic Engineering, Vol. 13, No. 2, June 2017
Real-Time Interference Detection in Tracking Loop of GPS
Receiver
M. Moazedi*
,
M. R. Mosavi*(C.A.) and A.Sadr*Abstract: Global Positioning System (GPS) spoofing could pose a major threat for GPS navigation systems, so the GPS users have to gain a better understanding of the broader implications of GPS. In this paper, a plenary anti-spoofing approach based on correlation is proposed to distinguish spoofing effects. The suggested method can be easily implemented in tracking loop of GPS receiver. We will study a real-time spoof recognition with a clear certainty by introducing a reliable novel metric. As a primary step, the proposed technique is implemented in software receiver to prove the concept of idea in a multipath-free scenario. Three rooftop data sets, collected in our GPS laboratory, are used in the performance assessment of the proposed method. The results indicate that investigated algorithm is able to perform a real-time detection in all date sets.
Keywords: Correlation, GPS Receiver, Tracking Loop.
1 Introduction1
VER the past two decades, security and reliability of GPS-based systems are restricted [1-3]. The GPS system is extremely vulnerable to different kinds of interferences. This makes GPS spoofing to the one of the important research topics. A GPS spoofer causes spatial and temporal errors and disrupts navigation systems [4]. Generally, GPS signals can be threatened at different levels, including data processing, data structures and positioning [5,6]. Therefore, anti-spoofing methods must be able to perform accurately in all these sectors.
Spoofing attacks are classified into three groups: simplistic, intermediate and sophisticated. Simplistic spoofers attach a power amplifier and an antenna to a GPS signal simulator [5]. The second group is accomplished by combining the GPS receiver with a RF front-end transmitter called receiver-spoofer.
Sophisticated attacks contain several spoofers using a common reference oscillator and a communication link such that each one is adjusted to one target antenna. Simulators cannot make counterfeit signals constant with the signals currently broadcast by satellites. Furthermore, physical limitations for placing the attacker antenna toward the victim receiver make implementation of sophisticated attackers so hard and impossible in some cases because of the target receiver’s motion [6]. However, the receiver-spoofer
Iranian Journal of Electrical & Electronic Engineering, 2017. Paper first received 24 June 2016 and in revised form 22 June 2017. * The authors are with the Department of Electrical Engineering, Iran University of Science and Technology, Narmak, Tehran 13114-16846, Iran.
E-mails: [email protected], [email protected] and
Corresponding Author: M. R. Mosavi.
can generate more realistic signals and be formed small enough to place near the victim receiver. Therefore, we will oppose the intermediate spoofing in a way that the main GPS signal is re-sent to the target receiver after some precise delay.
A variety of techniques have been proposed for detection and mitigation of interference [7]. The opposition process consists of two sections, detecting attacks and reducing their effect [5]. Signal Quality Monitor (SQM) as an important subject in this field, continuously observes received GPS signals for interference, distortion and other anomalies with the purpose of raising a warning flag [8,9]. Generally, SQM algorithms involve some measurements in correlator output and a decision process that compares such measurements with pre-defined thresholds. SQM methods are not applicable in cases where spoofing attack does not affect the shape of the correlation peak, which happens when counterfeit and authentic signals are almost aligned together [10]. In order to improve performance of SQM method, several approaches, such as Vestigial Signal Defense (VSD), Vector Based (VB) and combined techniques have been suggested.
In VSD method, receivers generate far more correlators to increase the accuracy of predictions. When a series of correlator delays are available, complex correlation function can be considered as a time continuous signal [11]. The main idea in VB tracking technique is combining the navigation solution and the tracking signal [5]. It is an analytical approach to investigate the interaction between the authentic and the counterfeit correlation peaks during attacks. A spoofing attack is detected if this distribution is considerably deviated from the standard form. Indeed, the combined technique “sandwiches” an attacker between a correlation distortion monitoring and a total in-band power monitoring [12]. Intelligent networks are
O
Iranian Journal of Electrical & Electronic Engineering, Vol. 13, No. 2, June 2017 195 also used in this field. For example in [13] spoofing
mitigated by normalized least mean squares.
This paper is organized as follows. After the introduction of correlation in tracking loop and evaluation of the existing detection metrics, a new enhanced metric is introduced in isection 2. Section 3 proceeds with simulation results. After explaining the data collection process, there is investigation of the suggested enhanced metric. Finally, some general conclusions are drawn in section 5.
2 Real-Time Detection Method of Spoofing
Through analyzing spoofing effect, we observed that the spoofing attack disturbs the tracking loop. The tracking module performs the correlation function in the PLL and DLL. In the presence of interference, the code correlation function may be distorted resulting to a navigation error. The idea of this research is implemented in tracking loop of the GPS Software Receiver (SR). We will briefly describe code tracking before presenting the proposed method.
2.1 Correlation in Tracking Loop
The Coarse/Acquisition (C/A) code is a unique spreading sequence of 1023 chips, with 1.023 MCPS chip rate giving a period of 1 ms. The first step in the tracking loop is to convert the C/A code to a baseband through multiplying the received signal in local replica of the carrier wave. Therefore, the outputs will be integrated and dumped. The results indicate how much the specific code replica is correlated with the received signal. In general, the autocorrelation function model is:
(1) 1 ; for
( )
0 ; otherwise
C C
T
R T
Two important properties related to correlation of the C/A codes are stated as follows [14]:
A) All the C/A codes are nearly uncorrelated with each other. That is, for two codes and of satellites i and k, the cross correlation can be written as:
(2)
1022
0
0
i k
ik l
r m C l C l m
B) All C/A codes are nearly uncorrelated with themselves; except for zero lag. This property makes it easy to find out when two similar codes are perfectly aligned. The auto-correlation feature for satellite k can be written as:
(3)
1022 0
( ) k( ) k( ) 0
kk l
r m C l C l m
Since the summation starts from ‘0’, the upper limit should be equal to 1022. Usually, the receiver uses
three-point correlation points (early, prompt and late) to track the GPS signal. These three outputs, IE, IP and IL,
are compared to observe whose correlation is the highest. When the highest peak is located at IP replica
while IE and IL are equal, the code phase is correctly
tracked.
In a hostile environment, a complex correlation function of x at time t and offset delay τ can be expressed as:
(4) ( , ) A( , ) S( , ) ( , )
x t x t x t n t
wherexA
t,τ ,xS
t, and n t,τ
are direct pathGPS signal, spoofing and Gaussian white noise signal, respectively. Spoofing signal in a complex correlation function area can be modeled as:
(5)
,
IspoofingS S
x t t R t
If an attacker tries to mislead the victim by a too close copy of the GPS signal, xS
t, must be approximatelyequal toxA
t, . The only noticeable difference is “Ispoofing” showing an attack about to happening [11]. After spoofing, xS
t, does not remain as the idealautocorrelation function. When there is no spoofing and noise, we have Q t,
0and I t,
R
, but in the presence of interference and noise, values of
Q t, and I t,
change [15]. As a consequence, a protector can recognize abnormal sharp peaks of the signal that impose a spoofing attack.2.2 Interference Detection Metrics
Actually, monitoring the complex correlation function implies calculating a metric according to samples of the correlation output. Various tests have been presented based on distortions in complex correlation in order to detect spoofing that we will briefly introduce here [11].
2.2.1 Delta Metric
Delta metric is defined as [11]:
(6)
,
,
2
E L
P
I t I t
t
I t
where IE,τ
t and IL,τ
t are initial and final points that are located ahead or behind of IP
t . It is clear thatdelta test is symmetric and under spoof-free condition
0τ
E Δ t . So, Eq. (6) can be considered as spoofing detection metric. Nonetheless, some kinds of synchronous attacks can generate forgery signals with no obvious distortion at I t,
and spoofing only deforms Q(t,τ). Since this metric doesn’t include196 Iranian Journal of Electrical & Electronic Engineering, Vol. 13, No. 2, June 2017
quadrature component, distinguishing these kinds of attacks will be impossible by delta test.
2.2.2 Ratio Metric
Ratio metric is relatively similar to delta metric, except that instead of subtracting in the numerator, the summation is used. This metric is defined as [11]:
(7)
,
,
2
E L
P
I t I t
RT t
I t
Assuming uncorrelated correlation taps under spoofing-free conditions, we have: E RT τ
t 1τ TC for 0 τ TC and otherwise zero. This metric
not only includes delta test defects, but also it may wrongly detect the attacks affecting IP(t). As it can be
seen in Eq. (7), metric variation depends on the relative difference of early-late and prompt taps. However, in most cases, IE and IL are changed almost equally, but in
the opposite direction. For example, IE decreases while
IL increases relative to the normal state. In this
condition, the sum of early and late taps that made the numerator of ratio metric will be almost constant. As a result, this metric is unable to detect this kind of attacks correctly.
2.2.3 Magnitude Difference Metric
Another metric to detect spoofing and is defined as [11]:
(8)
E,
L,
P
x t x t
MD t
x t
where xE,τ
t , xL,τ
t and xP
t are the absolutevalue of the early, late and prompt correlation functions, respectively. This metric is similar to delta test. The difference is that the absolute value of the correlations is utilized. Usually, in spoofing attacks, the in-phase component is increased while quadrature component is decreased. With regard to this fact that this metric takes magnitude of correlation function, variations of in-phase and quadrature components may partly compensate each other. Therefore, it is expected that this metric has low sensitivity to spoofing.
2.2.4 Early-Late Phase Metric
Early-late phase metric is a recently proposed metric which calculates the phase difference between initial and final correlation taps [11].
(9)
1 ,
,
, ,
tan L E
L E
Q t Q t
ELP t
I t I t
Here QE,τ
t and QL,τ
t refer to τ seconds ahead andbehind the prompt tap of the quadrature component at
time t, respectively. ELPτ is the only metric that employs quadrature component Q t
, of the correlation function. In contrary to other metrics, this has no estimation of the relative difference between prompt and side tabs.For example, it is possible that the power of signal decreases but its phase is not affected considerably. In this case the phase metric shows inconsiderable variation relative to authentic state. Moreover, it is unable to extract unbalancing of IE and IL. In other
words, this metric can distinguish the spoofing attacks that others are incapable in recognizing of them and vice versa.
2.3 Proposed Spoofing Detection Methodology
Because of mentioned reasons in section 2.2, none of the existing metrics are reliable. Delta, ratio, magnitude and ratio metrics are unable to detect spoofing attacks that affect Q component. Moreover, the ratio metric cannot detect the attacks that only change IL and IE
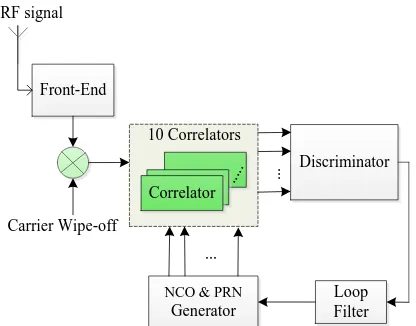
almost equal, but in the opposite direction. The magnitude metric has low sensitivity in cases that can detect the attack. Of course, accuracy and sensitivity of ratio metric are adjustable by ‘’ and ‘ ’ parameters. The phase metric doesn’t investigate the prompt tap and hence it has no precise estimation on signal power. Therefore, the GPS system will not provide high security through using these tests. Then, the necessity of introducing a new metric that detects spoofing correctly in all data sets is clearly observable. It seems that if we can propose a criterion that investigates both of in-phase and quadrature components at all of three taps (early, late and prompt), it will be a reliable metric. The proposed metric here not only has this feature, but also uses a bank of correlations in a multi-correlations structure that has chip spacing of ±0.1, ±0.25, ±0.5, ±0.75 and 1 between the early and late replicas instead of using a standard correlation with 1 chip spacing as shown in Fig.1.
Carrier Wipe-off
10 Correlators Front-End
NCO & PRN
Generator Correlator
.... .
Discriminator
Loop Filter
...
. . .
RF signal
Fig. 1 Block diagram for multi-correlator based DLL implementation.
Iranian Journal of Electrical & Electronic Engineering, Vol. 13, No. 2, June 2017 197 IE1,IE2,IE3,IE4,IE5,IP,IL5,IL4,IL3,IL2,IL1
QE5,QE4,QE3,QE2,QE1,QP,QL5,QL4,QL3,QL2,QL1
Metric Calculation
If Metric>TH
If Spoof Mode (n-1) = ON If Spoof Mode (n-1) = ON
If startCounter = 0
Add startCounter Tstart = NOW
If startCounter > Ndet
If (T-Tstart)>Tdet
Spoof Mode (n) ON
If stopCounter = 0
Add stopCounter Tstop = NOW
If stopCounter > Nrel
If (T-Tstop)>Trel
Spoof Mode (n) OFF N
N N
Y
Y
Y
N
Y
Y
N Y
Y N
N
N Y
Ho H1
Y
T = NOW T = NOW
N
N
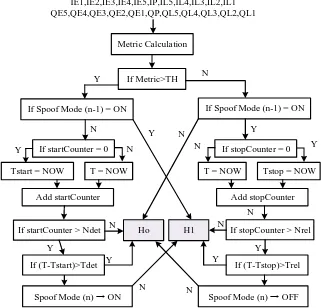
Fig. 2 Spoof detection algorithm description flow chart.
In this structure, after converting the Radio Frequency (RF) input signal to Interference Frequency (IF) signal and wiping-off the carrier, the received post-processed signal is passed through a bank of correlators. As it can be seen in the figure, Numerically Controlled Oscillator (NCO) and PRN generator block produce a bank of early and late replica codes. Thus, it can be deduced that the proposed metric considers a linear combination of five early minus late discriminators as a bank of quadrature components and prompt taps. In this way, the new “exhaustive” metric is proposed as:
(10)
2 2
cos Metric
cos
P EL
DI DQ IP QP
where DI DQ, , P andELare described as:
(11)
5 5
2 2
1 1
,
i i i i
i i
DQ QE QL DI IE IQL
(12)
1
5 1 1
tan ,
tan
5
P
i i
i i i
EL
QP IP
QL QE IL IE
Based on proposed metric, the flowchart of spoof
detection algorithm has been shown in Fig. 2. Making a decision in the presence or absence of an attack is usually done by using statistical hypothesis. Here, two hypotheses have been considered for the correlator outputs. The null hypothesis (H0) corresponds to the case in where the authentic correlation peak is being tracked by the receiver. The hypothesis (H1) in accepted when the null hypothesis is not true. This happens on condition that correlation peaks of spoofing and authentic signals interact. The H0 hypothesis will be rejected if the test statistic repetitively exceeds the previously determined critical value during specified time. Confidence interval of attack occurance is determined with “Ndet” in Fig. 2. Required time for execution of algorithm is “Tdet”. The algorithm confirms an attack if during “Tdet” at least “Ndet” times the metric value be upper than TH. The critical value of the test is determined based on a previously assumed significance level. “TH” is the level of significance for rejecting H0 hypothesis when this hypothesis is valid and also it is the level of significance for re-accepting the H0 hypothesis after it is rejected due to amplitude abnormalities. Assuming that the receiver is initially working under the H0 hypothesis, spoofing attacks will be detected if the proposed test statistic exceeds “TH” more than “Ndet” times during “Tdet”.
After that, the spoofing attack will be released if the detection test statistic fall under “TH” after “Nrel” times
198 Iranian Journal of Electrical & Electronic Engineering, Vol. 13, No. 2, June 2017
Antenna
RF
GPS Signal Simulator
Mixer
Front-End
αS(t-
τ
)
Acquisition
&
Tracking
GPS Signal
I, Q
Bank
S(t)
Interference
Detection
Counterfeit IF
(a)
(b)
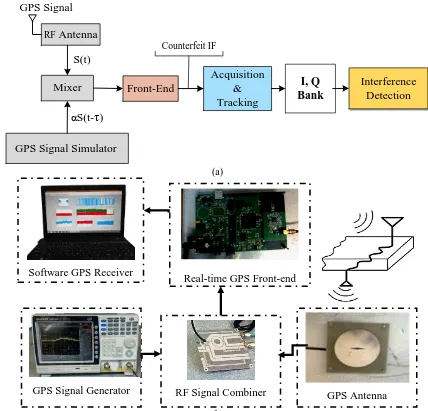
Fig. 3 (a) Block diagram of the implemented system and (b) Top level model for implemented system.
during “Trel”. The number of correlations considered for calculating the test statistics is 200.
3 Simulation Results
The performance of the proposed technique has been validated using several real spoof data collections. At first, the spoofing data collection process is described briefly. Then the performance of suggested algorithms will be analyzed in various schemas.
3.1 Data Collection
Three rooftop collected data sets are used in performance assessment of the proposed anti-spoofing method. Saving and delaying the GPS signals has been earlier investigated as relay deception [16,17]. Practical examples of this senario are developed by adding spoofer software to the typical GPS receiver. Spoofer transmits the fake signal to target receiver in either
synchronous or asynchronous manner. In the case of synchronous attack, counterfeit signal with aligned correlation peaks will be generated. In the asynchronous attack, a spoofer transmits signals with higher correlation peak that is not aligned with authentic peak. Synchronous attack is difficult to implement and then asynchronous one is a more realistic scenario [18]. Here we utilized delay spoof as an asynchronous type attack by a generation mechanism that provides a batch data set to evaluate suggested techniques.
Total view of implemented system has been appeared in Fig. 3. At the left part of the figure, a GPS signal simulator has been combined with a RF front-end. In this way, the delayed signal was emerged from the simulator. In this scenario, it is generally assumed that simulator’s output is much the same signal taken from the GPS antenna. By changing the runtime of the data, spoofing data in various scales were provided. The delays in scenarios are 4, 6 and 8 seconds wich we
GPS Antenna
GPS Signal Generator RF Signal Combiner
Real-time GPS Front-end Software GPS Receiver
Iranian Journal of Electrical & Electronic Engineering, Vol. 13, No. 2, June 2017 199
0 5 10 15 20 25 30
0 1 2 3 4 5 6 7 8
PRN number (no bar - SV is not in the acquisition list)
A
cq
u
is
it
io
n
Me
tri
c
Not acquired signals Acquired signals
(a)
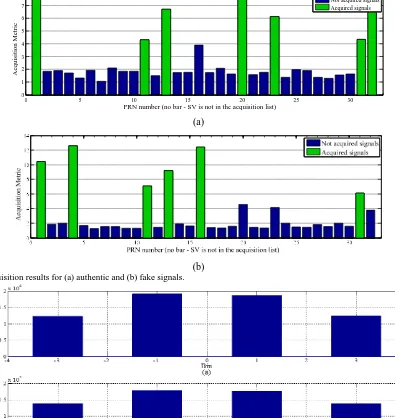
(b) Fig. 4 Acquisition results for (a) authentic and (b) fake signals.
Fig. 5 Histogram: (a) authentic signal and (b) spoofing signal.
called 1st, 2nd and 3rd data sets, respectively. The system
was implemented as an SDR in Matlab. All processing was done on a laptop ASUS K46C with i5 1.8GHz CPU. The corrupted signal in this attack can be expressed as:
(13)
d n S n S n
According to the above-mentioned modeling, ‘αS(n-τ)’ is actually considered as interference element where ‘α’ is amplification factor and equals to 2.
Fig. 4 shows acquisition results for example authentic and fake signals. The green color indicates valid and
detected satellites. The function acquisition in SR employs the parallel code phase search algorithm in frequency steps of 0.5 kHz. The correlation results are saved and the function proceeds to the next frequency step. Thus, the function steps through all frequency bands (user-defined Doppler space). Next, the function looks for a maximum correlation value. After the peak is detected, the function looks for the second highest correlation peak in the frequency bin of the highest peak. Then, the ratio of the two peaks is used for the signal detection rule. This ratio is defined as acquisition level. The satellites with acquisition level more than 5.8 are recognized as line-of-sight satellites. As observed, the counterfeit signal contains two satellites of authentic
200 Iranian Journal of Electrical & Electronic Engineering, Vol. 13, No. 2, June 2017
0 0.5 1 1.5 2 2.5
-5 0 5
Frequency (MHz) (b)
M
agni
tude
0 0.5 1 1.5 2 2.5
-5 0 5
Frequency (MHz) (a)
M
agni
tude
Fig. 6 Power density: (a) authentic signal and (b) spoofing signal.
-1 -0.8 -0.6 -0.4 -0.2 0 0.2 0.4 0.6 0.8 1 0
500
1000 1500 2000 2500
Code Phase(chip)
Co
rr
elatio
n
Outp
u
t
I
Q
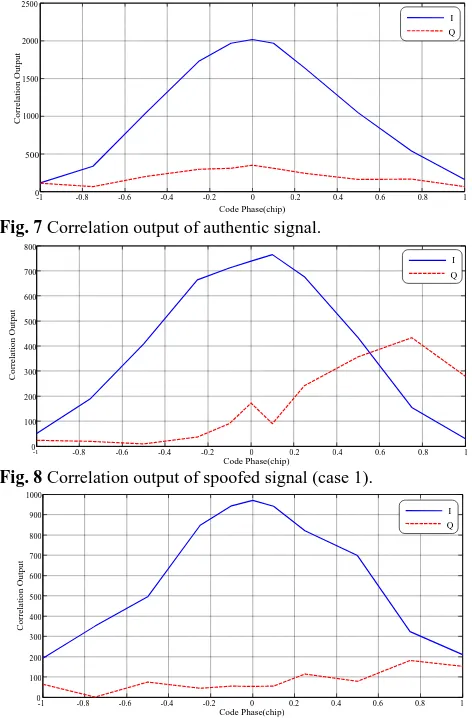
Fig. 7 Correlation output of authentic signal.
-1 -0.8 -0.6 -0.4 -0.2 0 0.2 0.4 0.6 0.8 1 0
100 200 300 400 500 600 700 800
Code Phase(chip)
Co
rr
elatio
n
Outp
u
t
I Q
Fig. 8 Correlation output of spoofed signal (case 1).
-1 -0.8 -0.6 -0.4 -0.2 0 0.2 0.4 0.6 0.8 1 0
100 200 300 400 500 600 700 800 900 1000
Code Phase(chip)
Co
rr
elatio
n
Outp
u
t
I Q
Fig. 9 Correlation output of spoofed signal (case 2).
-1 -0.8 -0.6 -0.4 -0.2 0 0.2 0.4 0.6 0.8 1 0
100 200 300 400 500 600 700 800
Code Phase(chip)
Co
rr
elatio
n
Outp
u
t
I
Q
Fig. 10 Correlation output of spoofed signal (case 3).
-1 -0.8 -0.6 -0.4 -0.2 0 0.2 0.4 0.6 0.8 1 0
100 200 300 400 500 600 700 800 900 1000
Code Phase(chip)
Co
rr
elatio
n
Outp
u
t
I
Q
Fig. 11 Correlation output of spoofed signal (case 4).
Fig. 12 Distribution of imaginary versus real part of proposed metric for authentic signal.
signal (PRN1, PRN 11, PRN13 and PRN31) with changed acquisition level. The spoofer prevents the other two satellites from passing the tracking segment (PRN20, PRN23 and PRN32). PRN4 and PRN16 are
added to acquisition list by spoofer. Histogram and frequency domain for these signal are shown in Figs. 5 and 6, respectively. As can be seen, there is no obvious difference between features of two signals.
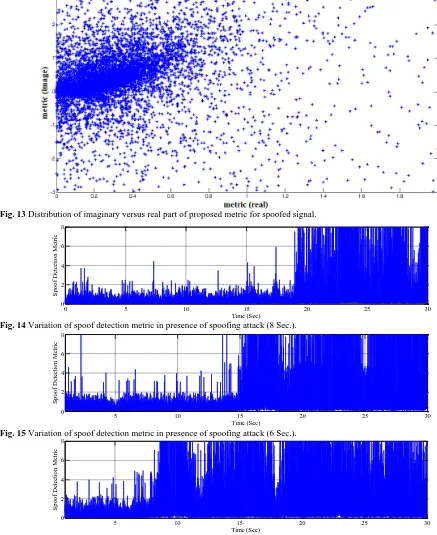
Iranian Journal of Electrical & Electronic Engineering, Vol. 13, No. 2, June 2017 201 Fig. 13 Distribution of imaginary versus real part of proposed metric for spoofed signal.
0 5 10 15 20 25 30
0 2 4 6 8
Time (Sec)
S
p
o
o
f
D
et
ec
ti
o
n
Me
tr
ic
Fig. 14 Variation of spoof detection metric in presence of spoofing attack (8 Sec.).
5 10 15 20 25 30
0 2 4 6 8
Time (Sec)
S
p
o
o
f
D
et
ec
ti
o
n
Me
tr
ic
Fig. 15 Variation of spoof detection metric in presence of spoofing attack (6 Sec.).
5 10 15 20 25 30
0 2 4 6 8
Time (Sec)
S
p
o
o
f
D
et
ec
ti
o
n
Me
tr
ic
Fig. 16 Variation of spoof detection metric in presence of spoofing attack (4 Sec.).
3.2 Detection Method Evaluation
In this study, we used the measured data to evaluate the performance of the proposed detection metric. As mentioned in the previous section, delay spoofing attacks in three time intervals have been implemented. Fig. 7 shows variations of in-phase and quadrature component of the correlation output of authentic signal. As can be seen, it is almost symmetric, and in-phase
component is much bigger than quadrature component. In this study, we used the measured data set to evaluate the performance of the proposed detection metric. Figs. 8 to 11 demonstrate four different states of counterfeit and authentic signal interaction. As can be seen, in all of them, the in-phase and quadrature components have been asymmetric and the distance between them is decreased. Characterizing these
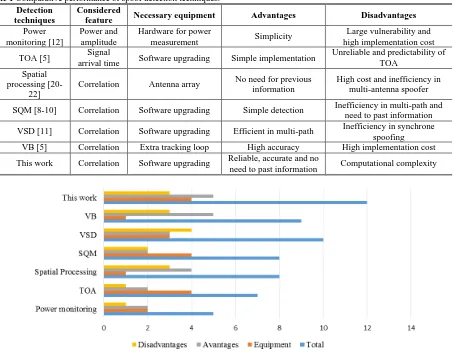
202 Iranian Journal of Electrical & Electronic Engineering, Vol. 13, No. 2, June 2017 Table 1 Comparative performance of spoof detection techniques.
Detection techniques
Considered
feature Necessary equipment Advantages Disadvantages Power
monitoring [12]
Power and amplitude
Hardware for power
measurement Simplicity
Large vulnerability and high implementation cost
TOA [5] Signal
arrival time Software upgrading Simple implementation
Unreliable and predictability of TOA
Spatial processing
[20-22]
Correlation Antenna array No need for previous information
High cost and inefficiency in multi-antenna spoofer SQM [8-10] Correlation Software upgrading Simple detection Inefficiency in multi-path and
need to past information VSD [11] Correlation Software upgrading Efficient in multi-path Inefficiency in synchrone
spoofing VB [5] Correlation Extra tracking loop High accuracy High implementation cost This work Correlation Software upgrading Reliable, accurate and no
need to past information Computational complexity
Fig. 17 Performance comparison of spoofing detection algorithms.
destructions is realized by the proposed metric calculations. To evaluate the metric, we have executed data sets in SR and then investigated metric variations during the attack. Significant deviation in the amplitude of all metrics is the result of spoofing attack. This means that the suggested metric is capable of detecting the attack in specified interference data in our laboratory. Figs. 12 and 13 indicate distribution of the imaginary part of metric versus real part for authentic and spoofed signal, respectively. Observable difference of two figures reveals considerable distortion of correlation function owing to spoofing attacks.
Moreover, the effectiveness of exhaustive metric is shown in Fig.s 14 to 16. The main feature of this metric is a low range for authentic signal and also considerable amplitude variations after starting the attack. This difference will increase the accuracy of the metric. This feature is predictable according to the predefined metric relation. Unlike others (except phase metric) the quadrature component is considered in its equation. In contrary to the early-late phase SQM test, it also takes parameters related the main peak into account. As can be seen in Fig. 14, in the first data (8 Sec.) the attack starts in 19th second. According to Fig. 15, start of
spoofing for the second data is about 15th Sec., and Fig.
16 shows that in the third spoofing data, the attack starts in the 8th Sec.
3.3 Performance Comparison
Because of unsimilarity of the proposed detection and mitigation methods with the existing ones, accurate comparison with prior works is difficult. Table 1 produces a comparative evaluation of new and previous detection methods based on necessary equipment, advantages and disadvantages. As can be seen, all of the investigated approaches are implemented based on correlation in tracking loop or IF signal. Power monitoring method causes large vulnerability and high implementation cost [19]. TOA is simple but unreliable. Spatial processing is efficient but expensive [20-22]. SQM is simple but inefficient in multi-path and synchronous attacks. VSD is more complicated but successful against multi-path. Finally, VB has high performance and implementation cost. Necessary equipment for this work is only software upgrading. However, it is reliable and accurate. It has no need to past information but increases computational complexity of the receiver.
In order to have a reliable and correct judgement, we assigned a numerical value to each feature. For this
Iranian Journal of Electrical & Electronic Engineering, Vol. 13, No. 2, June 2017 203 purpose, for any feature the worst and the best cases are
considered; score of 0 is dedicated for the worst state and 5 scores are devoted for the best state. After that, depending on the algorithm performance a number from 0 to 5 is assigned to any feature. For example, about the feature “necessary equipment”, an algorithm takes 5 scores, if no extra equipment is needed. Besides, in case of necessity to basal changes in receiver structure, it earns 0 scores.
Result of numbering is illustrated in Fig. 17. As can be seen the proposed algorithm gets 12 points, showing that this algorithm is better than the other ones. Because the offered method needs no extra hardware and does not increase the receiver size and the production costs.
4 Conclusions
In this study, we focused on spoofing threat as an important disturbance and introduced a new exhaustive detection metric to solve potential problems of previous metrics. Moreover, a reliable spoofing real-time detection strategy in tracking level based on statistical hypothesis was introduced. Suggested detection algorithm was applied at the tracking stage of the GPS receiver and has tested on three measurement interference data sets. Simulation results show that the proposed method is an appropriate solution to detect the spoofing interference.
References
[1] M. R. Mosavi, “Comparing DGPS Corrections Prediction using Neural Network, Fuzzy Neural Network and Kalman Filter”, Journal of GPS Solutions, Vol.10, No.2, pp. 9-107, 2006.
[2] M. R. Mosavi and A. A. Akhyani, “PMU Placement Methods in Power Systems based on Evolutionary Algorithms and GPS Receiver”, Iranian Journal of Electrical and Electronic Engineering, Vol.9, No.2, pp.76-87, 2013.
[3] M. R. Mosavi, S. Azarshahi, I. EmamGholipour and A. A. Abedi, "Least Squares Techniques for GPS Receivers Positioning Filter using Pseudo-range and Carrier Phase Measurements", Iranian Journal of Electrical and Electronic Engineering, Vol.10, No.1, pp.18-26, 2014.
[4] T. E. Humphreys, B. M. Ledvina, M. L. Psiaki, B. W. O'Hanlon and P. M. Kintner, “Assessing the Spoofing Threat: Development of a Portable GPS Civilian Spoofer”, The 21st International Technical Meeting of the Satellite Division of the Institute of Navigation, pp.2314-2325, Sep. 2008.
[5] A. J. Jahromi, A. Broumandan, J. Nielsen and G. Lachapelle, “GPS Vulnerability to Spoofing Threats and a Review of Antispoofing Techniques”, International Journal of Navigation and Observation, pp.1-16, May 2012.
[6] A. R. Baziar, M. Moazedi and M. R. Mosavi, “Analysis of Single Frequency GPS Receiver under Delay and Combining Spoofing Algorithm”, Wireless Personal Communications, Vol.83, No.3, pp.1955-1970, 2015.
[7] M. Pashaian, M. R. Mosavi, M. S. Moghaddasi and M. J. Rezaei, “A Novel Interference Rejection Method for GPS Receivers”, Iranian Journal of Electrical and Electronic Engineering, Vol.12, No.1, pp.9-20, 2016.
[8] R. E. Phelts, Multicorrelator Techniques for Robust Mitigation of Threatsto GPS Signal Quality, Doctoral Dissertation, Stanford University, California, 2001.
[9] A. M. Mitelman, Signal Quality Monitoring for GPS Augmentation Systems, Doctoral Dissertation, Department of Electrical Engineering, Stanford University, California, Dec. 2004.
[10]B. M. Ledvina, W. J. Bencze, B. Galusha and I. Miller, “An In-Line Anti-Spoofing Device for Legacy Civil GPS Receivers”, The 23rd International Technical Meeting of the Institute of Navigation, pp.689-712, Jan. 2010.
[11]K. D. Wesson, D. P. Shepard, J. A. Bhatti and T. E. Humphreys, “An Evaluation of the Vestigial Signal Defense for Civil GPS Anti-Spoofing”, The 24th International Technical Meeting of the Satellite Division of the Institute of Navigation, pp.1-11, Sep. 2011.
[12]K. D. Wesson, B. L. Evans and T. E. Humphreys, “A Combined Symmetric Difference and Power Monitoring GNSS Anti-Spoofing Technique”, IEEE Global Conference on Signal and Information Processing, pp. 1-4, Dec. 2013.
[13]M. R. Mosavi and Z. Shokhmzan, "Spoofing Mitigation of GPS Receivers using Normalized Least Mean Squares", Iranian Journal of Electrical and Electronic Engineering, Vol.11, No.3, pp.1-11, 2015.
[14]K. Borre, D. M. Akos, N. Bertelsen, P. Rinder and S. H. Jensen, “A Software-Defined GPS and Galileo Receiver: A Single-Frequency Approach”, Birkhäuser Boston, 2007.
[15]O. M. Mubarak and A. G. Dempster, “Analysis of Early Late Phase in Single and Dual Frequency GPS Receivers for Multipath Detection”, GPS Solution, Vol.14, pp. 381–388, 2010.
[16]N. O. Tippenhauer, C. Popper, K. B. Rasmussen and S. Capkun, “On the Requirements for Successful GPS Spoofing Attacks”, 18th ACM Conference on Computer and Communications Security, pp. 75-86, Oct. 2011.
204 Iranian Journal of Electrical & Electronic Engineering, Vol. 13, No. 2, June 2017
[17]A. R. Baziar, M. Moazedi and M. R. Mosavi, “A Wavelet based Spoofing Error Compensation Technique for Single Frequency GPS Stationary Receiver”, The 1st National Navigation Conference, Sharif University of Technology, pp.1-7, Feb. 2015. [18]S. Krasovski, M. Petovello, and G. Lachapelle,
“Ultra-tight GPS/INS Receiver Performance in the Presence of Jamming Signals”, International Technical Meeting of the Institute of Navigation, pp.1-13. 2014.
[19]A. J. Jahromi, A. Broumandan, J. Nielsen and G. Lachapelle, “GPS Spoofer Countermeasure Effectiveness based on Signal Strength, Noise Power and C/No Observables”, International Journal of Satellite Communications and Networking, Vol. 30, No. 4, pp. 181-191, 2012. [20]J. Nielsen, A. Broumandan and G. Lachapelle,
“GNSS Spoofing Detection for Single Antenna Handheld Receivers”, Journal of the Institute of Navigation, Vol. 58, No. 4, pp. 335-344, 2011. [21]P. Y. Montgomery, T. E. Humphreys and B. M.
Ledvina, “A Multi-Antenna Defense: Receiver-Autonomous GPS Spoofing Detection”, Inside GNSS Magazine, Vol. 4, No. 2, pp. 40-46, March/April 2009.
[22]S. Daneshmand, A. J. Jahromi, A. Broumandan and G. Lachapelle, “A Low Complexity GNSS Spoofing Mitigation Technique using a Double Antenna Array”, GPS World Magazine, Vol. 22, No. 12, pp. 44-46, Dec. 2011.
M. Moazedi received her B.S. and M.S. degrees in Electronic Engineering from IUST, Tehran, Iran in 2008 and 2011, respectively. She is currently Ph.D. student of IUST Department of Electrical Engineering. Her research interests in the area of analog and mixed signal integrated circuits, GPS security and integrity.
Mohammad-Reza Mosavi received his B.S., M.S., and Ph.D. degrees in Electronic Engineering from Iran University of Science and Technology (IUST), Tehran, Iran in 1997, 1998, and 2004, respectively. He is currently faculty member (professor) of the Department of Electrical Engineering of IUST. He is the author of more than 300 scientific publications in journals and international conferences. His research interests include circuits and systems design.
Ali Sadr received his B.S. degree in Electronic Engineering from AmirKabir University of Technology, M.S. from IUST and Ph.D. from University of Manchester Institue of Science & Technology in 1988, 1992 and 2002, respectively. He is currently faculty member of Department of Electrical Engineering of IUST as a ssociate professor. His research interests include non-destructive evaluation, digital systems and signal processing.