____________________________________________________________________________________________
A Simple Visual Model to Compare Existing
Front-of-pack Nutrient Profiling Schemes
Daphne Van Der Bend
1*, Joost Van Dieren
1*,
Marta De Vasconcelos Marques
1*, Nick L. W. Wezenbeek
1*,
Niki Kostareli
1*, Patricia Guerreiro Rodrigues
1*, Elisabeth H. M. Temme
2,
Susanne Westenbrink
2and Hans Verhagen
2,3*1
Wageningen University, Wageningen, The Netherlands.
2
National Institute for Public Health and the Environment (RIVM), Antonie van Leeuwenhoeklaan 9, 3721 MA Bilthoven, The Netherlands.
3
University of Ulster, Northern Ireland Centre for Food and Health (NICHE), Cromore Road, Coleraine, BT52 1SA, Northern Ireland.
Authors’ contribution
This work was carried out in collaboration between all authors. Author HV initiated and supervised the project. Authors HV, EHMT and SW have written and developed the first project plan at RIVM. Authors DVDB, JVD, MDVM, NLWW, NK and PGR are students at Wageningen University, who performed the research and wrote the initial project report. All authors contributed to and agree with the final version.
Received 23rd March 2014 Accepted 24th June 2014 Published 20th July 2014
ABSTRACT
Nutrient profiling is an important tool for governments, non-governmental organizations (NGO’s) and for the food industry, to help consumers make healthier food choices. Multiple nutrient profiling systems (NPS) have been introduced worldwide. There is, however, no agreement on the use of a single NPS in leading regions like the USA and Europe. In 2008, the Arrow Model of Verhagen and van den Berg was created to illustrate and compare characteristics of existing NPS. Recent developments in nutrient profiling give rise to the need for an updated Model. The present study aims to develop a comprehensive model, which can be used to explain and compare various front-of-pack nutrient profiling systems (FOP-NPSs). An extensive literature research was conducted to obtain an overview of existing FOP-NPS worldwide. Only FOP-NPS that are currently in use, focus on health-related product aspects and target the general population (adults and
430 children) were included. The Funnel Model was developed based on the analysis of 40 existing FOP-NPSs and expert interviews. This Model illustrates different FOP-NPS and allows comparison among them. The Funnel Model includes several new characteristics compared to the Arrow Model. Numerous ingredients and four new characteristics were added to the Funnel Model: directivity, type of institution initiating the system, purpose and utilization. Several other characteristics were expanded with new elements. The Funnel Model also has a new visual presentation which is useful to clearly explain and compare FOP-NPS.
Keywords: Nutrient profiling; visual model; funnel model; front-of-pack; labeling.
1. INTRODUCTION
Nutrient profiling has been defined as ‘‘the science of categorizing foods according to their nutritional composition’’ [1,2] and ‘‘categorization of foods for specific purposes on basis of their nutrient composition according to scientific principles’’ [3]. Nutrient profiling is associated with the evaluation of the nutritional quality of single foods. There are many areas in which nutrient profiling plays a crucial role. Nutrient profiling can be done for several purposes such as: 1. the evaluation of the nutritional quality of single foods, 2. to help consumers make a ‘healthy’ food choice, e.g. via the use of logos 3. to regulate the promotion of foods to children, and 4. to identify food products eligible to bear a nutrition or health claim.
As highlighted by Kleef and Dagevos (2011) it is very important to use nutrition labeling in the promotion of healthier food choices. Recently the focus has been directed to front-of-pack (FOP) logos and labels which provide nutrition information in a simplified way for consumers to understand [4]. In this text, we focus on the use of nutritional profiles via the use of FOP logos and labels. Although it is generally agreed that as such, there are no ‘good’ or ‘bad’ foods, and that the ‘overall’ mean nutritional quality of the daily diet, and a balanced food consumption pattern, are the more important determinants of nutritional health, a ‘healthy’ diet requires an informed and healthy food choice by the consumer. As such, ‘healthy eating’ front of pack nutrient profiling systems (FOP-NPSs) logos or symbols on the food package can be viewed as potential tool to assist consumers in making ‘the healthy choice the easy choice’. Adaption of FOP-NPS might also stimulate the food industry to develop products with an improved nutritional composition. It is important to realize that labels and logos are mainly on packaged/processed foods and not on unpackaged/fresh foods.
In the last twenty years, many different FOP-NPSs have been introduced in Europe, North America and Oceania. In the last decade FOP-NPSs have also been introduced in several countries in Asia and South America. The increasing number of FOP-NPSs leads to the confusion of consumers [5]. However, there is no agreement on the use of a single FOP-NPS in leading regions such as the European Union and the United States. There is still debate on which system is the most appropriate and effective [6]. In order to facilitate and help making a more effective debate on the current FOP-NPS, a clear overview of the existing NPS is warranted.
made. Various characteristics of NPS are presented in the model, such as: ingredients included, methodological approach and measurement method. Five years later, there are several new developments in nutrient profiling and there is also a need to include FOP-NPS that were missing in the previous Model. With the updated information provided by this overview it is possible to revise the existent Arrow Model of Verhagen and van den Berg and make the necessary changes to provide a comprehensive model that illustrates and allows comparison of NPS used worldwide.
Fig. 1. The arrow model; a simple visual model to compare existing NPS [7]
2. METHODS
Interviews with three experts from the field of nutrient profiling were conducted to acquire more insight in the topic and its recent developments. These experts are working in the food industry, research and in policy and consultancy field. The experts who were interviewed have experience in the field of nutrient profiling. Each interview was conducted by two interviewers. Questions were asked about the experts’ view on new developments in nutrient profiling, sources of information and about specific NPS's. Furthermore, the interviewees were asked to check the list of FOP-NPSs for missing systems.
An extensive literature search was conducted to obtain an overview of existing FOP-NPS worldwide. The literature search was based on different continents (North America, South America, Europe, Africa, Asia and Oceania). Electronic databases that were searched include Scopus, Web of Science (WoS), Google Scholar, Google, PubMed and the Global Search on the ‘Find & Discover’ page on the library of the Wageningen University website. The search terms that were used are: nutrient profiling system/scheme; food/nutrition
labeling; health claims; nutrition logo; FOP label; nutrient profiling (overview). Each search
432 or Thailand, to get insight in NPS in specific parts of the world. Commercial or governmental websites, reports, (scientific) articles, presentations and other publications were analyzed.
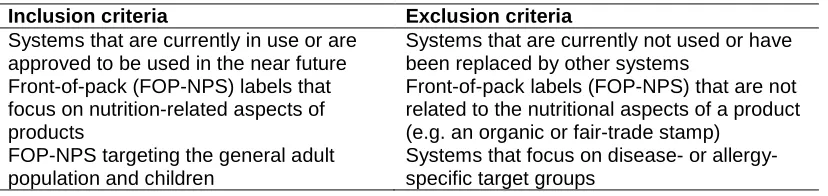
To judge the relevance of the initially found FOP-NPS and to compose an overview of relevant NPS, a selection was made based on inclusion and exclusion criteria listed in
Table 1.
Table 1. Inclusion and exclusion criteria used to select relevant FOP-NPS
Inclusion criteria Exclusion criteria
Systems that are currently in use or are approved to be used in the near future
Systems that are currently not used or have been replaced by other systems
Front-of-pack (FOP-NPS) labels that focus on nutrition-related aspects of products
Front-of-pack labels (FOP-NPS) that are not related to the nutritional aspects of a product (e.g. an organic or fair-trade stamp)
FOP-NPS targeting the general adult population and children
Systems that focus on disease- or allergy-specific target groups
After applying the inclusion and exclusion criteria, the characteristics of all selected NPS were examined by looking up specific information about each system. This was performed by searching on the names of these NPS in electronic searching databases (as described previously) or visiting specific websites of brands, organizations or institutions that initiated the NPS. All FOP-NPSs that met the inclusion criteria were described in an extensive overview, which can be found in Appendix A. Based on this overview an updated model was developed.
2.1 The Funnel Model
The following characteristics are described for each FOP-NPSs:
2.1.1 Country
The country or countries that use(s) (or will start using) the FOP-NPS. Some systems are used internationally, or in more than one continent or country.
2.1.2 Organization name and organization type
FOP-NPSs are initiated by numerous organizations worldwide. A distinction can be made between governmental, commercial, NGO’s and academic institutions [8]. The first FOP-NPSs were initiated by NGO's, but in recent years numerous systems from commercial organizations and governments have been introduced as well [9].
2.1.3 Utilization
FOP-NPSs are applied on the basis of a voluntary or a mandatory utilization.
2.1.4 Methodological approach
are used for all foods [10]. Some systems use a combination of both methodological approaches.
2.1.5 Measurement method
To measure the nutritional quality of food, two types of measurement methods are used: scoring (in categories/continuum) and threshold (exceedance or not) [11]. Scoring systems give a nutritional quality score to products based on a measurement method which takes into account qualifying and/or disqualifying risk and benefit criteria [10]. Threshold systems use threshold levels to categorize foods into different levels of nutritional quality [10]. These threshold levels are often based on guidelines such as the Codex Alimentarius or the guidelines from the WHO [11].
2.1.6 Risk and benefit criteria
Within a NPS, qualifying and disqualifying ingredients can be included. Qualifying ingredients represent ingredients that contribute positively to health (benefits, exceeding a threshold is healthy) and disqualifying ingredient have a negative impact on health (risk, exceeding a threshold is unhealthy). In general, organizations, which developed NPS have used energy value as a disqualifying ingredient.Some systems use exclusively qualifying or disqualifying ingredients, while other systems use a combination of both benefits and risks.
2.1.7 Reference unit
The reference unit needs to be taken into account. Some systems use a standard unit such as 100g, 100ml or 100kcal, whereas other systems have a per serving or daily amount approach.
2.1.8 Directivity
A recently published study that is part of Food Labeling to Advance Better Education for life (FLABEL), a project funded by the European Union, presents a classification of NPS based on consumer research [12]. From consumer classifications of FOP nutrition labels three different categories were extracted: directive, semi-directive and non-directive [12].
Non-directive NPS provide detailed nutritional information, but give no direction to the choice of
the consumer (e.g. Guideline Daily Amounts). Directive NPS do not contain nutritional information and give a direction to consumer’s choice including simple and graduated health logos (e.g. Key Hole), i. e. the consumer don’t need to interpret any information, it is indicated directly that the product is a good option; whereas semi-directive category includes traffic lights, hybrid labels and nutrition tables that incorporate traffic lights [12], which are a combination of directive and non-directive labels, provide some information and also symbols that make more easily for the consumer to interpret the information provided.
2.1.9 Purpose
All NPS are originally developed for a specific purpose, e.g., to help consumers to make healthier food choices, to promote reformulation of food products, to stimulate marketing of food products or to focus specifically on foods for children. Some NPS have more than one purpose.
2.1.10 Symbol
434
3. RESULTS
3.1 Results Overview
The overview of the current NPS includes 51 systems used worldwide, among which 40 carry a front-of-pack label and meet the risk and benefit criteria. The 11 NPS that were excluded met at least one of the exclusion criteria. The table with the 40 FOP-NPS is provided as supplementary table (Appendix 1).
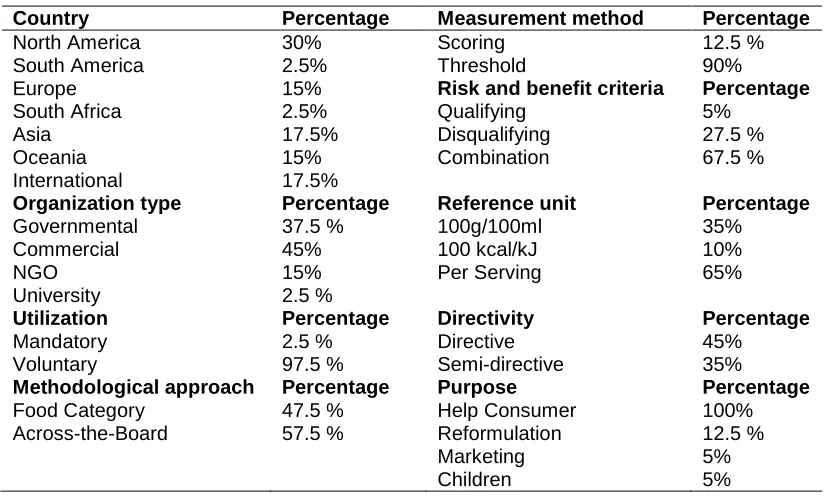
The percentage of FOP-NPSs having certain characteristics is shown in Table 2. Most systems are initiated in North America (30%) followed by Asia and international organizations. The majority of the systems uses a combination of qualifying and disqualifying risk and benefit criteria, whereas some systems use either qualifying or disqualifying risk and benefit criteria. The reference unit most frequently used is per serving, which is sometimes combined with another reference amount. Of all the systems, 90% uses thresholds values as measurement method, whereas 12.5% uses a scoring measurement method. The majority of the FOP-NPSs are either developed by a commercial organization (45%) or government (37.5%). Only a small percentage of the systems originate from NGO’s (15%) or universities (2.5%). According to the information provided by the initiator all the systems aim to help the consumer make healthier food choices, however some systems have additional purposes such as marketing, regulation and aiming specifically to children. Overall, the food category approach and the across-the-board approach are used with an almost equal frequency (48% and 58%, respectively). Some systems use a combination of both approaches. The vast majority of the included systems are voluntary, with exception of “FOP GDA for snacks” in Thailand.
Table 2. Characteristics of 40 FOP-NPSs and prevalence (%)
Country Percentage Measurement method Percentage
North America 30% Scoring 12.5 %
South America 2.5% Threshold 90%
Europe 15% Risk and benefit criteria Percentage
South Africa 2.5% Qualifying 5%
Asia 17.5% Disqualifying 27.5 %
Oceania 15% Combination 67.5 %
International 17.5%
Organization type Percentage Reference unit Percentage
Governmental 37.5 % 100g/100ml 35%
Commercial 45% 100 kcal/kJ 10%
NGO 15% Per Serving 65%
University 2.5 %
Utilization Percentage Directivity Percentage
Mandatory 2.5 % Directive 45%
Voluntary 97.5 % Semi-directive 35%
Methodological approach Percentage Purpose Percentage
Food Category 47.5 % Help Consumer 100%
Across-the-Board 57.5 % Reformulation 12.5 %
Marketing 5%
Special attention is paid to the risk and benefit criteria of the FOP-NPS, by which consumers are informed about the nutrient value of the food products. Table 3 presents the most frequently used nutritional information (in percentages) that appears on the 40 FOP-NPSs.
Table 3. Ingredients most often included in the 40 FOP-NPSs and prevalence (%)
Ingredient Qualifying / Disqualifying Percentage
Dietary fiber Qualifying 62.5 %
Protein Qualifying 35 %
Calcium Qualifying 30 %
Saturated Fatty Acids (SFA) Disqualifying 75 %
Total Sugar Disqualifying 62.5 %
Total Fat Disqualifying 62.5 %
Sodium Disqualifying 62.5 %
Energy Disqualifying 52.5 %
Trans Fatty Acids (TFA) Disqualifying 37.5 %
Cholesterol Disqualifying 30 %
Among the ingredients that were most often used in the systems, three are assessed as qualifying and seven are assessed as disqualifying (including energy). Disqualifying ingredients appear to be included more frequently in FOP-NPSs than qualifying ingredients. Saturated fatty acids (SFA), total fat, trans fatty acids (TFA), sugar, sodium, energy and cholesterol are the disqualifying ingredients that are most frequently included. Although energy value, which refers to the calorie content of a product, is not an ingredient by definition, it is one of the most important factors associated with weight gain and obesity [13,14]. Therefore, it is regarded as a disqualifying ingredient. Dietary fiber is the most frequently used qualifying ingredient in FOP-NPS.
3.2 Funnel Model
The Funnel Model, shown in Fig. 2, was developed based on the Arrow Model of Verhagen and van den Berg (2008) and presents the characteristics that were described for all included FOP-NPS [7]. The Funnel Model shows the different characteristics that need to be taken into account when analyzing a FOP-NPS. The Funnel Model includes several new characteristics in comparison to the Arrow Model. Qualifying ingredients that have been added are: carbohydrates, unsaturated fat, MUFA, DHA, EPA, vitamins/minerals, vitamin B1, B2, B6, B9, B12, vitamin D, vitamin E, zinc, magnesium, potassium, antioxidants, linolenic acid, bioflavonoids, phytochemicals, carotenoids, low-fat dairy, lean meats, whole grain and seafood. The newly added disqualifying ingredients are: (a combination of) SFA+TFA, partly hydrogenated fat, salt, added sodium, added sugars, lactose, fructose and alcohol. Other characteristics that were added are: type of organization, utilization, directivity, purpose and more types of reference units.
3.3 Examples of FOP-NPS
436 Fig. 2. The funnel model; a simple visual model to compare existing FOP-NPS
3.4 Multiple Traffic Light (MTL) + Reference Intake (RI)–United Kingdom (UK)
Fig. 3. Funnel Model applied to MTL + RI
3.5 Keyhole – Sweden, Denmark, Norway, Iceland
438 Fig. 4. Funnel model applied to keyhole system
3.6 Choices Program – International
Fig. 5. Funnel model applied the choices program
3.7 Healthier Choice Symbol – Singapore
440 Fig. 6. Funnel model applied to healthier choice symbol
3.8 AHA Heart Check – USA
Fig. 7. Funnel model applied to AHA heart check
3.9 Health Star Rating – Australia
442 Fig. 8. Funnel model applied to the health star rating
3.10 Overview
444
Fig. 9. Funnel Model applied to the: a) MTL + RI; b) Keyhole; c) Choices Program; d) Healthier Choice Symbol; e) AHA Heart Check; f) The Health Star Rating
446
4. DISCUSSION
In comparison with the Arrow Model, published in 2008, the Funnel Model provides a more complete and up-to-date overview of the characteristics of the existing FOP-NPS, which allows for comparison of the different systems currently in use. Whereas the Arrow Model was constructed based on six FOP-NPSs, the Funnel Model is based on 40 FOP-NPSs. Starting with the Arrow Model as a base, additional qualifying and disqualifying ingredients were included in the Funnel Model. Additional characteristics that were added to the Funnel Model include: directivity, type of institution that developed the system and the purpose of the FOP-NPS. Inclusion of these characteristics allows for a more complete comparison of systems.
A strength of the Funnel Model is that it is based on an overview of FOP-NPS from all over the world which are currently in use or are approved to be used in the near future and are targeted at the general adult population and children. This paper on the Funnel Model only includes FOP-NPS, which could be a restriction for users who would be interested in comparing non FOP-NPS such as for allowing nutrition and health claims under EU Regulation 1924/2006.
Although some systems may not have been found, various experts on nutrient profiling were approached to assess whether important systems were missing. Therefore, it is expected that the Funnel Model is able to represent the characteristics of FOP-NPS in use worldwide. The Funnel Model thus provides an effective way of comparing and explaining different FOP-NPS. The model can therefore be used by different parties in the field of nutrient profiling such as food companies or policy makers. The Funnel Model can be used to explain the concept of FOP-NPS and its use to a new audience or to compare the characteristics of different FOP-NPS.
The analysis of the included NPS shows some interesting similarities and differences. Most of the systems included are either from a governmental or commercial organization. Of the governmental systems included, all except for one system are voluntary. The only mandatory FOP-NPS is from Malaysia (FOP calorie content) for application on popcorn, crisps, crackers and biscuits.
Although systems can differ with respect to the qualifying and disqualifying ingredients included, most systems have a similar approach when analyzing the nutritional content of food products. Most of the included systems use a combination of disqualifying and qualifying ingredients, a per serving reference unit and a threshold measurement method. Directive systems are most used in practice, but semi-directive and non-directive systems are used as well. It would therefore be interesting for future research to investigate what kind of directivity is more effective for helping consumers to make healthy food choices. All FOP NPS have the purpose to help the consumer make more informed food choices. There is however very little empirical evidence that FOP-NPS help consumers to change their diets [4].
5. CONCLUSION
The Funnel Model has been developed to describe and compare different FOP-NPS. The Funnel Model is based on an updated overview of FOP-NPS that are currently used worldwide. It includes several new elements compared to the Arrow Model and uses a new visual presentation in order to present the characteristics of different NPS. With the Funnel Model different FOP-NPS can be clearly presented and compared. An overview of all the NPS that were found and a presentation of all FOP systems as described by the Funnel Model are provided as an attachment to this article on the website of the journal. Furthermore a table with the risk and benefit criteria of all the different systems is provided.
ACKNOWLEDGEMENTS
HV initiated and supervised the project. HV, EHMT and SW have written and developed the first project plan at RIVM. DB, JD, MVM, NW, NK and PGR are students at Wageningen University, who performed the research and wrote the initial project report. All authors contributed to and agree with the final version.
The work was funded by the National Institute for Public Health and the Environment (RIVM), the Netherlands. The paper was produced on the basis of a MSc student’s project within the Academic Master Cluster of Wageningen University (YMC 60809).
Saskia Meyboom is thanked for assisting the students on procedural aspects during their project weeks.
We want to thank the interviewees for their input and contribution to this project.
COMPETING INTERESTS
Authors have declared that no competing interests exist.
REFERENCES
1. Astrup A, Healthy lifestyles in Europe: Prevention of obesity and type II diabetes by diet and physical activity. Public Health Nutr, 2001;4(2):499-515.
2. Hersey JW, Kelly; Kosa, Katherine; Arsenault, Joanne; Muth, Mary, Policy Research for Front of Package Nutrition Labeling: Environmental Scan and Literature Review, Washington DC; 2011.
3. Nishida C, et al. The joint WHO/FAO expert consultation on diet, nutrition and the prevention of chronic diseases: process, product and policy implications. Public Health Nutrition. 2004;7(1A;SPI):245-250.
4. Kleef EV, Dagevos H. The growing role of front-of-pack nutrition profile labelling: A consumer perspective on key issues and controversies. Critical Reviews in Food Science and Nutrition; 2013. p. null-null.
5. EUFIC, EUFIC's Global Update on Nutrition Labellling, European Food Information Council: Brussels, Belgium; 2013.
6. Front-of-pack nutrition labelling; 2013.
Available from: http://www.food.gov.uk/scotland/scotnut/signposting/.
448 8. Stockley L, Rayner M, Kaur A. Nutrient profiles for use in relation to food promotion and children’s diet: Update of 2004 literature review, D.o.P.H. British Heart Foundation Health Promotion Research Group, Editor University of Oxford; 2007.
9. Wartella EA, Lichtenstein AH, Boon CS. Examination of Front-of-Package Nutrition Rating Systems and Symbols: Phase I Report 2010: The National Academies Press. 10. Danone, Nutrient profiles, in 10th European Nutrition Conference; 2007. Paris.
11. EFSA Scientific Colloquium Summary Report: Nutrient Profiling For Foods Bearing Nutrition and Health Claims, Authority EFS, Editor; 2008. Parma.
12. Hodgkins C, et al. Understanding how consumers categorise nutritional labels: A consumer derived typology for front-of-pack nutrition labelling. Appetite. 2012;59(3):806-817.
13. Du H, et al. Dietary energy density in relation to subsequent changes of weight and waist circumference in European men and women. PLoS One. 2009;4(4):5339.
14. World Health Organization, Food and Agriculture Organization, Report of the joint WHO/FAO expert consultation on diet, nutrition and the prevention of chronic diseases; 2002.
15. iRateiSlate. New Food Labelling Scheme Designed to End Consumer Confusion. 2013 19th of June, 2013 [cited 2013 9th of October]; Available from:
http://www.irateislate.co.uk/article-new-food-labelling-scheme-designed-to-end-consumer-confusion-249.
16. FSA. Front-of-pack nutrition labelling. 2013 19th of June, 2013 [cited 2013 9th October]; Available from: http://www.food.gov.uk/scotland/scotnut/signposting/.
17. Department of Health UK, et al. Guide to creating a front of pack (FoP) nutrition label for pre-packed products sold through retail outlets; 2013.
18. Sjolin KL. Nordic Keyhole - Experience and challenges Sweden, Norway, Denmark, Iceland. Healthy choices made easy., in FAO/WHO Information Meeting on Front of Pack Nutrition Labelling; 2013. Charlottetown.
19. What is Choices. 2012 [cited 2013 18th of September]; Available from: http://www.choicesprogramme.org/what-choices.
20. Dotsch-Klerk M, Jansen L. The Choices programme: A simple, front-of-pack stamp making healthy choices easy. Asia Pac J Clin Nutr. 2008;1:383-6.
21. Schilpzand R. Choices International Foundation. EU Plataform 2013 [cited 2013 7th of October];
Available:http://www.choicesprogramme.org/sites/default/files/content/pre_choices_eu _platform_rutger_schilpzand_130926.pdf.
22. Health Promotion Board. Healthier Choice Symbol Programme. 2013 9th September 2013 [cited 2013 18th September];
Available from: http://www.hpb.gov.sg/HOPPortal/programmes-article/2780.
23. American Heart Association. Heart-Check Mark Nutritional Guidelines. 2013 3rd of
January [cited 2013 23rd of September]; Available from:
http://www.heart.org/HEARTORG/GettingHealthy/NutritionCenter/HeartSmartShoppin g/Heart-Check-Mark-Nutritional-Guidelines_UCM_300914_Article.jsp.
24. American Heart Association. Heart-Check Program Nutritional Guidelines. 2011 [cited 2013 23rd of September]; Available from: http://www.heart.org/idc/groups/heart-public/@wcm/@fc/documents/downloadable/ucm_439218.pdf.
25. Australian Government Department of Health. Front-of-pack labelling update 14 June 2013. 2013 14th of June, 2013 [cited 2013 7th of October]; Available from: http://www.health.gov.au/internet/main/publishing.nsf/Content/foodsecretariat-front-of-pack-labelling-1.
http://www.fgc.org.nz/media/work-to-be-done-on-aust-health-star-rating-labelling-system-says-katherine-rich.
450
APPENDIX- 1
Overview of the NPS that were used to construct the Funnel Model
Nutrient profile system Country Organization type Organisation Utilization Methodological
approach Calculation method Nutritional criteria Nutrients included Reference unit Directivity Purpose Health Check Canada NGO Heart and Stroke
Foundation of Canada Voluntary Across the board Threshold
Positive and negative
Protein, total sugar, dietary fiber, total fat, SFA, TFA, sodium, vitamins and other minerals
Per serving Directive
Help the consumers to make more informed
choices
Old Dutch Snack Wise Canada and USA Commercial Old Dutch Voluntary Food category threshold Negative Total fat, SFA, TFA, cholesterol,
sodium _ Directive
Help the consumers to make more informed
choices
Overall Nutritional Quality
Index (ONQI) USA University
Yale University School of Medicine Voluntary
Across the board and food category Score
Positive and negative
Total sugar, fiber, SFA, TFA, cholesterol,total N-3 fatty acids, vitamin A, vitamin B9, vitamin B6, vitamin B12, vitamin C, vitamin D, vitamin E, total bioflavonoids, total
carotenoids, calcium, iron, magnesium, potassium, sodium
and zinc
100 kcal Drective
Research, help the consumers to make more
informed choices and develop an algorithm for
assessing the overall nutritional quality of foods
AHA Heart Check USA NGO AHA Voluntary Food category Threshold Positive and negative
Protein, fiber, whole grains, total fat, SFA, TFA, EPA + DHA, cholesterol, vitamin A, vitamin C,
iron and sodium
Per serving Directive
Help the consumers to make more informed choices and product reformulation and
inovation
Great for you USA Commercial Wal-Mart Voluntary Across the board Threshold Positive and negative
Added sugars, fruit, vegetables, nuts, total fat, SFA, TFA, lean meats, low fat dairy and sodium
per serving Directive
Help the consumers to make more informed
choices
Wegmans Wellness Keys USA Commercial Wegmans Voluntary Food category Threshold Positive and negative
Energy, protein, total carbohydrates, total sugar, lactose,
dietary fiber, whole grains, total fat, SFA, TFA, cholesterol, vitamin A, vitamin C, calcium, iron and
sodium
Per serving Semi-directive
Help the consumers to make more informed
choices
Healthy elements program USA Commercial SuperValu Voluntary Food category Threshold Positve and negative
Energy, fiber, whole grains, total fat, cholesterol, calcium and
sodium
Per serving Semi-directive
Help the consumers to make more informed
choices
Simple Nutrition self tags USA Commercial Safeway Voluntary Across the board Threshold Positive and negative
Protein, total sugar, fiber, total fat, SFA, cholesterol, vitamin A, vitamin C, calcium, iron and
sodium
Per serving and % Daily Values (2000-calorie diet)
Semi-directive
Help the consumers to make more informed
choices
Facts Up Front USA Commercial Food Marketing
Institute Voluntary Across the board Threshold
Positive and negative
Energy, protein, total sugar, fiber, SFA, vitamin A, vitamin C, vitamin D, calcium, iron, potassium and
sodium
Per serving Non-directive
Help the consumers to make more informed
choices
Guiding Stars USA Commercial Hannaford and
Delhaize Voluntary
Food category and
across the board Threshold
Positive and negative
Added sugars, dietary fiber, whole grains, SFA, TFA, cholesterol, vitamins/minerals and added
sodium
Per 100kcal Directive
Help the consumers to make more informed
choices
Clear On Calories USA Comercial America's beverage
companies Voluntary Across the board Threshold Negative Energy Per serving Non-directive
Help the consumers to make more informed
Giant Foods Healthy Ideas USA and Canada Commercial Giant Foods Voluntary Food category Threshold Positive and negative
Protein, total sugar, fiber, total fat, SFA, TFA, cholesterol, vitamin A,
vitamin C, calcium, iron and sodium
Per serving Directive
Help the consumers to make more informed
choices
ProDANyS Argentina Governmental
Government of the Province of Buenos
Aires
Voluntary Across the board Threshold Positive and
negative Total sugar, fiber, total fat and salt Per 100g Directive
Help the consumers to make more informed choices and product reformulation and
inovation
MTL UK Governmental UK FSA Voluntary Across the board Threshold Negative Energy, total sugar, total fat, SFA and salt
Per 100g/ml aand
serving Semi-directive
Help the consumers to make more informed
choices
MTL+IR UK Governmental UK FSA Voluntary Across the board Threshold Negative Energy, total sugar, total fat and
SFA Per 100g/ml Semi-directive
Help the consumers to make more informed
choices
Sign of Protective Food Slovenia NGO
Society of Cardiovascular Health
of Slovenia
Voluntary Across the board Threshold Positive and Negative
Energy, added sugar, dietary fiber, SFA, unsaturated fat, cholesterol,
salt and alcohol.
Per 100g/ml Directive
Help the consumers to make more informed
choices
Heart Symbol Finland NGO FHA and FDA Voluntary Food category Threshold Positive and negative
Total sugar, fiber, total fat, SFA, unsaturated fat, cholesterol and
sodium
Per 100g Directive
Help the consumers to make more informed
choices Keyhole Denmark, Iceland, Norway and Sweden Governmental National Food Administration of Sweden
Voluntary Food category Threshold Positive and negative
Total sugar, fiber, total fat and sodium
Per 100g and
100kcal Directive
Help the consumers to make more informed choices and reformulation
and innovation of food products
MC-GDA & CC-GDA Europe Commercial IGD Voluntary Across the board Threshold Negative Energy, total sugar, total fat, SFA
and sodium Per serving
Non-directive or Semi-directive
Help the consumers to make more informed
choices
Heart Healthy Mark Zimbabwe NGO Heart Foundation of
Zimbabwe Voluntary Food category Threshold
Positive and negative
Total sugar, dietary fiber, SFA, TFA, partially hydrogerated fat, cholesterol, calcium, salt, fruit,
vegetables and seafood
Per 100g Directive
Help the consumers to make healthier and
heart-safe choices
Healthier Choice Symbol Singapore Governmental Singapore HPB Voluntary Across the board Threshold Positive and negative
Energy, protein, carbohydrates, total sugar, dietary fiber, whole grains, total fat, SFA, TFA, cholesterol, calcium and sodium
Per 100g and serving
Directive or Semi-directive
Help the consumers to make more informed
choices
Healthier Snack Symbol Singapore Governmental Singapore HPB Voluntary Food category Threshold Positive and negative
Energy, total sugar, dietary fiber, whole grains, total fat, SFA, TFA
and sodium
Per 100 g/ml and
serving Directive
Help the consumers to make more informed
choices
Healthier Ingredient
Symbol Singapore Governmental Singapore HPB Voluntary Food category Threshold
Positive and negative
Whole grains, total fat, SFA, TFA, MUFA, PUFA, potassium and
sodium
Per 100 g/ml and
serving Directive
Help the consumers to make more informed
choices
FOP Calorie content Malaysia Commercial
Federation of Malaysian Manufacturers and
Malaysian Food manufacturing Group
Voluntary Across the board Threshold Negative Energy Per serving and %
DV Non-directive
Help the consumers to make more informed
choices
FOP GDA for Snacks Thailand Governmental Thai FDA Mandatory Across the board Threshold Negative Energy, total sugar, total fat and
salt Per serving Non-directive
Help the consumers to make more informed
choices
25% Reduced Thailand Governmental Health Department Voluntary Across the board Threshold Negative Total sugar, total fat and sodium _ Semi-directive
Help the consumers to make more informed
452
Healthier-you Philippines Governmental Philippine's
Department of Health Voluntary Across the board Threshold
Positive and negative
Energy, proteins, total carbohydrates and total fat
Per serving and %
DV Directive
Help the consumers to make more informed choices and reformulation
and innovation
The Health Star Rating Australia Governmental FSANZ Voluntary Across the board Threshold and Score Positive and negative
Energy, total sugar, total fat, sodium and other optional positive
nutrients as fiber or calcium
Per 100g/ml Semi-directive
Help the consumers to make more informed
choices
eMarks New Zealand Governmental New Zealand
Nutrition Foundation Voluntary Food category Score Negative Energy Per serving Directive
Help the consumers to make more informed
choices
Heart Foundation Tick Australia and
New Zealand NGO
Heart Foundation of New Zealand and
Australia
Voluntary Food category Threshold Positive and negative
Energy, fiber, SFA, TFA, calcium
and salt Per serving Directive
Help the consumers to make more informed
choices
Daily Intake Guide (DIG) Australia and
New Zealand Governmental FSANZ Voluntary Across the board Threshold
Positive and negative
Energy, protein, carbohydrates, total sugar, total fat, SFA, vitamins/minerals and sodium
Per serving and
%DV Non-directive
Help the consumers to make more informed
choices
The Health Eating System Australia and
New Zealand Commercial
Sanitarium Health &
Wellbeing Voluntary Food category Score
Positive and negative
Protein, added sugars, fiber, total
fat, SFA and sodium Per 100g/ml Semi-directive
Help the consumers to make more informed
choices
Whole Foods ANDI Rating
System International Commercial Whole Foods Market Voluntary Across the board Score Positive
Vitamins, minerals, phytochemicals and antioxidant
capacitie
_ Directive
Help the consumers to make more informed
choices
Whole Grain International Governmental Whole Grain Council Voluntary Across the board Threshold Positive Whole grains Per serving Semi-directive
Help the consumers to make more informed
choices
Nutrition Highlights International Commercial General Mills Voluntary Across the board Threshold Positive and negative
Energy, total sugar, dietary fiber,
SFA, calcium and sodium Per serving Non-directive
Help the consumers to make more informed
choices
Nutrition Information
Initiative International Commercial McDonalds Voluntary Across the board Threshold
Positive and negative
Energy, protein, total carbohydrates, total sugar, fiber,
total fat, SFA and salt
Per serving Non-directive
Help the consumers to make more informed choices Promotion of food
- marketing
Kellogg's Global nutrient
Criteria International Commercial Kellogg's Voluntary Food category Threshold Negative
Energy, total sugar, fiber, SFA, vitamine A, vitamin C, vitamin C, calcium, magnesium, potassium
and sodium
Per 100kcals and
serving Non-directive
Help the consumers to make more informed choices Promotion of food
- marketing
Choices Programme International Commercial Choices International
Foundation Voluntary Food category Threshold
Positive and negative
Energy, added sugars, fiber, SFA, TFA and salt
Per 100g and % of
2000kcal Directive
Help the consumers to make more informed choices and product reformulation and inovation of food products
Fuelled 4 Life New Zealand Governmental Heart Foundation of
New Zealand Voluntary Food category Threshold
Positive and negative
Energy, total sugar, fiber, SFA and
sodium 100g/ml and serving Directive
Help the consumers to make more informed choices for children
Mickey Check International Commercial Walt Disney Voluntary Food category Threshold Negative Energy, sugar, SFA, TFA and sodium Per serving Semi-directive
INTRODUCTION
This overview describes the NPS that are currently used in North America, South America, Europe, Africa, Asia and Oceania. The different characteristics of a NPS are presented in the Funnel model and, due to its visual simplicity it is very clear what can be chosen [1]. Some of the choices concern the following parameters:
1) Establish a system based on food categories and/or in foods as a whole – with the food category system the NPS is based on each food category, e.g. fish and eggs or milk and dairy products. In a system based on foods as a whole, also called a transversal approach, all foods come under a single profile (whether dairy products or fruit), irrespective of food categories. Due to the limitations of each of these two approaches, some systems have tried to combine them.
2) The risk and benefit criteria taken into account – a distinction can be made between positive risk and benefit criteria, which are often lacking nutrients in the diet and/or associated with beneficial health effects, like dietary fiber or omega-3 fatty acids, and negative risk and benefit criteria, which are ingredients eaten in excess or implicated in chronic diseases, like fats and sugars.
3) The measurement method used (score vs. threshold) – To measure nutritional quality two methods can be used: scoring systems and threshold systems. Scoring systems assign an overall score to the food obtained by combining its negative ingredient score (nutritional weaknesses) and its positive ingredient score (nutritional benefits). With the threshold measurement method for each ingredient a threshold is defined, that results in two or three classes of ingredient content (good/intermediate/bad).
4) Thresholds of eligibility and how are they defined – Threshold values are normally obtained through the nutritional recommendations published by public health authorities.
5) The reference unit – There are several reference units used by the existing systems like the “100g” unit, the portion unit and the analysis per 100kcal of a product. Some systems even combine several units [1,2].
6) Directivity – From consumer classifications of FOP nutrition labels three different categories were extracted: directive, semi-directive and non-directive. Non-directive NPS provide detailed nutritional information, but give no direction to the choice of the consumer, i.e. information whether the food is considered healthy or not. The non-directive category includes GDA systems and standard nutrition tables [3]. The semi-directive category gives more direction to the choice of the consumer and includes traffic lights and nutrition tables that incorporate traffic lights. Directive systems give direction to the choice of a consumer by indicating whether it is a healthy choice or not. The directive category includes simple and graduated health logos such as the Key Hole and Health Star Rating.
1. NORTH AMERICA
1.1 Health Check
The Health Check logo was introduced in Canada in 1999 by the Heart and Stroke Foundation of Canada [4]. The logo can be found on both food products in the supermarket and on dishes on the menus of the restaurants [5]. This is the only non-profit front-of-pack (FOP) logo currently being used in Canada [6]. The Health logo is an across-the-board system and it takes the following risk and benefit criteria into account: total fat, saturated fatty acids (SFA), trans fatty acids (TFA), fiber, sodium, sugar, protein, vitamins and other minerals [5].
Companies can apply at the Canadian Heart and Stroke Foundation to get approval for their products to carry this logo and they have to pay a fee for carrying the logo on their products. For the ingredients that are used as criteria for this logo threshold levels are set [6].
These threshold levels are based on Canada's Food Guide to Healthy Eating. The reference unit that is used is per serving of the food product or meal [4]. The logo that that is displayed on food products and menu cards for the Health Check is shown in Fig. 1 and it is a directive label type.
1.2 Old Dutch Snack Wise
This FOP label is exclusively displayed on the packages of snacks of the company ‘Old Dutch’, from Canada and USA. Is a system that uses a food-category based summary indicator, so it has a directive approach and a threshold measurement method. It highlights each product’s benefits, such as:
- 0g TFA;
- 0g SFA;
- 0g cholesterol;
- Low fat;
- No MSG (Monosodium Glutamate);
- Low sodium [7].
This label, which can be seen in Fig. 2, has a directive approach.
1.3 Naturally Nutrient Rich Score
The Naturally Nutrient Rich Score (NNR) was developed by the university of Washington-Seattle and it is a measure of nutrient density (nutrients-to-calories ratio) [8]. The score is calculated based on mean percentage daily values (DVs) for 14 ingredients in 2000kcal of the food. This system uses an across-the-board approach and the ingredients included are: protein, monounsaturated fat, calcium, iron, potassium, zinc, thiamine, folate, and vitamins: A, C, B2, B12, D, E. The measurement method used by this system is threshold.
The NNR score is the average of %DVs for the 14 key ingredients:
• NNR = Σ%DV2000 kcal /14 and its reference unit is per 100kcals [9].
Fig. 1. Health check logo [8]
Fig. 2. Old Dutch label
1.4 Overall Nutritional Quality Index (ONQI) NUVAL
The ONQI was developed by a multidisciplinary group of scientists that are active in the field of nutrition and public health, independent of food industry interests. It ranks foods based on its nutritional value (across-the-board and within food groups) and hence it helps consumers make more informed food choices [10]. The ONQI is a score on a scale from 0-100 which is used in the USA [11].
This nutritional scoring system considers more than 30 ingredients and nutritional factors in order to develop the raking system. The simplest version of how the ONQI is calculated can be seen in the Fig. 3 [12].
Qualifying ingredients are placed in the numerator: fiber, folate, vitamin A, C, D, E,
B12, B6, potassium, calcium, zinc, n-3 fatty acids, total bioflavonoids, total carotenoids, magnesium and iron. Disqualifying ingredients are placed in the denominator: SFA, TFA, sodium, sugar and cholesterol [10].
The ONQI system also takes into account other factors in order to measure the quality and density of nutrients in the foods. It is also included the
strength of association between these ingredients and some specific health problems [12].
For instance, and taken TFA as an example: this type of fat is strongly associated with heart disease. Taking this into account, the ONQI define a “weighting coefficient” to TFA what produces a reduction in the score of the food containing this fat. The weighting coefficients are defined considering the prevalence, severity and strength of association with the health problems [12].
The quality of the macronutrients, (fat quality, protein quality or carbohydrate quality) can also produce and increase or decrease in the score [12].
This score is calculatied per kcal and its reference unit is per serving [10]. The symbol of NuVal is displayed in Fig. 4 and it has a directive label type.
1.5 AHA Heart Check
The Heart Check logo, shown in Fig. 5 [13], was created by the American Heart Association, a NGO, and it is used in the USA with the purpose of helping consumers to make healthier food choices and to certify food products. To achieve certification, a product must meet the risk and benefit criteria as specified by the Food and Drug Administration (FDA), based on a single serving size (Reference Amount Customarily Consumed or RACC) [14].
The Heart Check uses a methodological approach based on food
Fig. 4. NuVal symbol [14]
categories, a threshold system and its nutrient requirements are per RACC amounts as specified by the FDA and USDA [15]. This system uses a directive label type.
1.6 Great for You
The Wal-Mart produced and launched in February 2012 a new seal, the “Great for you”. The criteria for receiving this seal it is the most rigorous until now and follows the recommendations from 2010 Dietary Guidelines for Americans, FDA, U.S. Department of Agriculture (USDA) and Institute of Medicine (IOM). Besides the packaged foods, this symbol also appears on fresh fruit and vegetables, in the USA. The “Great for You” was developed with the collaboration of food and nutrition experts from public and private organizations and health organizations. The symbol of “ Great for you” is presented in Fig. 6 and it represents a transparent way to increase the confidence and trust of the consumers about the products of the company [16].
The icon has as purpose to help people to make changes in their diet by indicating nutritious and healthier food choices and also promote food fortification and health claims. The risk and benefit criteria of this system are composed by two steps:
1. Step one: encourage consumers to increase consumption of fruits, vegetables, fiber-rich whole grains, low-fat dairy, nuts and seeds and lean meats.
2. Step two: limit the amount of total TFA and SFA, sodium and added sugars in foods. The criteria for this step are:
• Total Fat: each serving less than 35% of total energy;
• Trans Fat: 0g labeled and no “partially hydrogenated ” fats or oils present per serving;
• Saturated Fat: less than 10% of total energy per serving;
• Sodium: each serving of single food items contains 380mg or less, a meal or mixed dish contains 600mg or less
• Added Sugars: in each serving 25% or less of total energy is provided by added sugars [16].
The symbol uses an across-the-board methodological approach and a threshold measurement method. The reference unit used is per serving. As can be seen in Fig. 6, this symbol is an example of directive NPS.
1.7 Wegmans Wellness Keys
The American Wegmans food markets present the Wegmans Wellness Keys in their products. This system consists in dots, that can be easily recognize by the consumers and show the foods that fit in a healthy lifestyle and wellness planning. Each one of the dots shown in Fig. 7 provides important nutritional information. All the messages transmitted by these dots follow the USA government regulations [17].
This NPS uses a food category methodological approach and a threshold measurement method. The reference unit used is per serving. This system uses a semi-directive label type. Additional specific ingredients taken into account are protein, total carbohydrates, SFA, TFA, cholesterol, vitamin A, vitamin C and iron.
1.8 Healthy Elements Program
In June 2009, SuperValu, a grocery industry leader that serves customers in several stores across the USA, introduced the Healthy Elements program for its independent retail partners to help their stores identify products that meet FDA guidelines. The aim of this label is to provide a quick, simple and convenient way for costumers to make healthier decisions about food products [18].
The label, shown in Fig. 8, is carried by grocery, frozen and dairy products. Each item is labeled with a green shelf tag that lists up to four attributes. The nine Healthy Elements attributes were reviewed by dietary experts and are based on top health issues such as heart disease, cancer, stroke and diabetes. These nine elements are:
• Gluten Free;
• Good Source of Calcium;
• Good Source of Fiber;
• Low Calorie;
• Low Cholesterol;
• Low Fat;
• Low Sodium;
• Organic;
• Whole Grain [18].
The Healthy Elements Program uses a food category methodological approach, a threshold measurement method
and the reference unit used is per serving [18]. This system uses a semi-directive label type.
1.9 Simple Nutrition Shelf Tags
In February 2011 Safeway announced Simple Nutrition shelf tags with the purpose of helping consumers to make healthier choices about food products. The teal boarded tags have color-coded labels for 22 benefits regarding nutrition and ingredients, including gluten free, organic, whole grain and fat free to cover both dietary of lifestyle needs, and specific nutrition of ingredient concerns. An example of these tags is shown in Fig. 9. In general, products with a nutrition benefit message such as "Good Source of Fiber" or "Low in Fat" have to meet one or more of the following risk and benefit criteria:
Gluten free Lean
Lactose free Low fat
Vegan High fiber
High calcium Fat free
Low calorie Sugar free
Low sodium Hearth healthy
Whole grain Fruits/vegetables
Fig. 7. Wegmans wellness keys [20]
• Total Fat: Each serving contains 13g or less.
• Saturated Fat: Each serving contains 2g or less.
• Cholesterol: Each serving contains 60mg or less.
• Sodium: Each serving contains 480mg or less for individual products and 600mg or less for meals and main dish products.
• Beneficial ingredients: Each serving contains 10% or more of the DV for vitamin A, vitamin C, calcium, iron, protein or fiber.
• Sugars: Naturally occurring sugars in foods such as grains, milk, fruits and vegetables are allowed. The total amount of sugars that is allowed in a specific product category is calculated with a formula [19].
Simple Nutrition shelf-tags uses an across-the-board system and a threshold measurement method. The reference unit is per serving and the % daily values are based on a 2000kcal diet. Multiple Simple Nutrition shelf-tags have been designed to limit the consumption of foods that contain ingredients that might negatively affect health (total fat, SFA, cholesterol, sodium and sugars) and to encourage the consumption of products that contain ingredients that contribute to a healthy diet (vitamin A, vitamin C, calcium, iron, protein or fiber) [19].
The Simple Nutrition criteria are based on the
latest published health guidelines provided by the USDA, the US Department of Health and Human Services (DHHS), the IOM and food labeling guidelines from the FDA. Certified food products are also evaluated on the RACC. Product categories that have small RACCs (< 30g/2 Tablespoons) are also evaluated per 50g [19]. This system uses a semi-directive label type.
1.10 Facts Up Front
The Facts Up Front is a commercial profiling system created by the Food Marketing Institute for the U.S. food and beverage manufacturers and retailers [20,21]. This NPS clearly summarizes important nutrient information from the Nutrition Facts Panel. Facts Up Front was created to provide American consumers an easy way to help consumers make more informed choices on food products [21].
The basic Facts Up Front label, shown in Fig. 10, includes four icons with information about calories, SFA, sodium and sugars, which are the ingredients to limit, as identified by the Dietary Guidelines for Americans [21]. The specific serving size is the same as the Nutrition Facts Panel [21]. The optional icons consist of up to two additional icons, representing specific additional ingredients declared in nutrition labeling, that are “Nutrients to Encourage” (potassium, fiber, protein, vitamin A, vitamin C, vitamin D, calcium or iron) [20,21]. These ingredients are all shortfall ingredients or are required to be on the Nutrition Facts Panel. The product must contain 10% or more of the DV of these ingredients and be a “good source” to be featured on the Facts Up Front label [21].
Information is included about calories, SFA, sodium, sugars and of up to two of the possible eight ingredients to encourage, that manufacturers can opt to include [20].
This system uses an across-the-board approach, a threshold measurement method and its reference unit is per serving [21]. This system uses a non-directive label type.
1.11 Food and Drug Administration (FDA) scheme
This NPS was developed by the FDA from the USA and has as purpose to identify products that can obtain a nutrition and health claim in the USA. For this system only products that satisfy the recommendations for the negative criteria and at least one positive criterion can obtain the claim. The negative ingredients are: total fat, SFA, cholesterol and sodium. The positive ingredients are: vitamin A, vitamin C, iron, calcium, protein and fiber. This is an across-the-board and threshold system. The thresholds are established to be lower than 20% of the Daily Reference Value (DRV) for the negative ingredients and higher than 10% of the DRV for the positive ingredients. These DRV's are based on a diet of 2000kcal per day. The reference unit of this system is the portion, which needs to be at least 50g [2,22].
According to the USA Health Claim Scheme, the products cannot have any nutritional weakness and need to have at least one recognized quality to carry a claim. It should also be taken into account that some health claims need to have specific thresholds, for example one product for the hypertension needs to have less sodium than the regular food [2].
1.12 Guiding Stars
This NPS is consistent with the recommendations of the Dietary Guidelines for Americans (DGA) and related authoritative dietary recommendations at point of purchase (POP). This program is implemented storewide, provided on the shelf (it is not present on the package) and is applied to all edible food products and beverages independently of the brand [23]. This system was developed to be implemented in the Hannaford and Delhaize stores, and is used in the USA [23]. Nowadays it is widely spread and can be found in a range of different stores, hospitals, products from grocery companies, etc. [24].
The Guiding Stars program categorizes the food and beverage products as a combination of a food-group and transversal approaches resulting in two broad categories of foods and beverages and additional categories for meats, poultry, seafood, dairy and nuts. This system includes as ingredients to limit: TFA, SFA, cholesterol, added sugars and added sodium. As nutritional factors to encourage are considered: dietary fiber, vitamins/minerals and whole grain bonus.
This label uses a scoring measurement method to determine the number of stars a product can carry. It considers a maximum and a minimum threshold value for each ingredients included in the Guiding Stars algorithm based on ingredient ratio to the 100kcal energy referent, i.e., equivalent to 5% of energy intake based on a 2000kcal diet. Following the DGA the food and beverage products should have at least 5% of the DV of the ingredients to
encourage and no more than 5% of the DV of those to limit. The thresholds assigned for the ingredients included in the system that have DV (SFA, cholesterol, sodium, vitamins/minerals and fiber) are 5% or multiples. The thresholds for the others that do not have DVs were derived using dietary guidelines from authoritative scientific bodies. For the added sugars the cut-off points were calculated based on the ideal of no added sugars, ≤10% of kcal (based
on WHO recommendations), and ≤25% of kcal (based on IOM recommendations) [23].
With the objective of not penalizing foods that naturally contain sugar or sodium, debit for added sugars and added sodium content was analyzed by evaluating the presence of certain words in the ingredient list and then calculated based on the Nutrition Facts Label (NFL) value. After analyzing each ingredient a sum of all positive and negative attribute scores is made. Only foods with a score above 0 receive stars. Foods with a score between 1 and 2 receive 1 star. Foods classified between 3 and 4 points receive 2 stars and 3 stars will be assigned to foods with 5 to 7 points [23]. The logo of the Guiding Stars systems is displayed in Fig. 11 and it is a directive label type.
Guiding Stars provide the information by 100kcal and its aim is to help the consumers to make more informed decisions about food products [23].
1.13 Clear on Calories
The Clear on Calories is a voluntary label commitment of America's beverage companies (Coca-Cola Company, Cott Beverages, Dr Pepper Snapple Group, Honest Tea, Nestlé Waters North America, PepsiCo, and Sunny D) with the aim of providing consumers the number of calories in their products in a clear way [25,26]. The label, which is of the semi-directive type is shown in Fig. 12.
“The Clear on Calories Initiative” was launched in 2010. This label displays the calorie content in the front of every can, bottle or pack. This label shows the total calories per container on beverages of 20 ounces or smaller. Containers larger than 20 ounces, label calories per 12 ounces, except for 100% juices and juice beverages, these are labeled per 8 ounce [25]. The Clear on Calories is a threshold system that provide consumers information in a directive way, and it uses an across-the-board approach.
Fig. 11. Guiding stars logo [26]
Fig. 12. Clear on calories label for containers 20 fl oz
In addition to the Clear on Calories label, America’s beverage companies are also developing The Calories Count Vending Program, which was launched in municipal buildings in the cities of Chicago and San Antonio in the beginning of 2013, and is now being made available to consumers nationwide. The Calories Count Vending Program offers information about calories to the consumers, with the aim of encouraging lower-calorie beverage choices. Calories Count can be seen on the front of vending machines, as it is shown in Fig. 13, and its signs include one of the following messages: "Check Then Choose" or "Try a Low–Calorie Beverage." The selection buttons also show total calorie counts per container [25,26].
1.14 Giant Foods Healthy Ideas
The Healthy Ideas nutritional shelf labeling is used in the USA with the purpose of helping consumers to make healthier food choices. In order for a food to carry the Healthy Ideas symbol it should meet the FDA criteria. FDA criteria considers as “healthy” foods limited in sodium, sugar, total fat, SFA and cholesterol. Furthermore, foods that carry the Healthy Ideas symbol afford at least 10% of the daily values for vitamin A and C, iron, calcium, protein or fiber [27].
This system uses an across-the-board approach with a threshold measurement method and the reference amount used is per serving. Fig. 14 shows the Healthy Ideas logo, which is a directive label type.
2. SOUTH AMERICA
2.1 ProDANyS – Argentina’s version of the Choices Programme
ProDANyS (Program for the Development of Foods, Nutrition and Health) is part of the Choices Program (see page 34) and hence it shares the same bases and methodologies of it. This program was implemented by the government of the Province of Buenos Aires. The Program is still in the development phase but it is expected to be launched soon [28,29].
ProDANyS has as purpose to make healthier choices easier for the consumers. Products that meet the Choices criteria are allowed to carry ProDANys FOP logo [28,29]. The symbol of ProDANyS is displayed in Fig. 15 and it is a directive label type. ProDANyS uses a threshold and across-the-board approach, taking into account the following ingredients: total sugar, fiber, total fat and salt, per 100g. This system uses an across-the-board approach and a threshold calculation system, with a reference unit of per 100g.
Fig. 13. Calories count vending program [28]
Fig. 14. Healthy ideas
logo [30]
3. EUROPE
3.1 MTL
The Multiple Traffic Light label (MTL) is a voluntary labeling system that was developed and adopted by the United Kingdom Food Safety Agency (UK FSA), that is used in UK [30].
The system uses colors (green, amber, red) to indicate whether there are low, medium or high quantities of energy, total fat, SFA, total sugar and salt in a food product. MTLs can have different appearances. The label may display only the three colors red, green and amber, without any additional information on amounts of ingredients. However, the label can also be displayed as CC-GDA (colored coded Guideline Daily Allowance), containing more detailed information on amounts and % of GDA, either per 100g, 100ml or per serving of the food. In addition, a grey or white icon that contains information on the amount of calories in the food may be added [30,31]. In the Fig. 16 is presented an example of a MTL logo. This system consists in a color code that is based in the GDA information. This system is a threshold and an across-the-board system. The MTL has as purpose to help the consumers to make more informed choices. The label of this system, in the way that is shown in Fig. 16, is of the semi-directive type.
3.2 MTL+RI
There has been a continuous debate about the MTL system in the UK because it is considered that it was not consistent and often perceived as confusing by consumers, caused by the using of different variations utilized by different retailers. As a result, one consistent traffic light FOP nutrition labeling system has been introduced by the UK FSA in June 2013. This system will expectedly be rolled out in the UK until December of 2014. The food companies that signed up for this new system and will start to use it are the most influent in the UK, which means that a large part of the foods sold in the UK (60%) will show the new system on their packages [32,33].
The new labels combine the GDA scores and MTL colors to indicate the amount of total fat, SFA, total sugar and salt. The energy will be shown in a neutral color [32]. The updated label uses an across-the-board and threshold approach and will display nutritional information and traffic light colors (red, amber, green) to show consumers at a glance if products are healthy or not. For consistency on pack, the current practice of GDA will change and only Reference Intakes (RI) should be used by retailers. All thumbnails will show their contents per 100g/ml and per serving. Further, the % RI will also be displayed for all five key items. The energy content will be displayed exclusively when e.g. the package is small or when the package uses several languages [34].
Fig. 16. MTL system [33]
![Fig. 3. ONQI measurement method [15]](https://thumb-us.123doks.com/thumbv2/123dok_us/8791406.1766880/27.612.320.516.182.261/fig-onqi-measurement-method.webp)
![Fig. 9. Simple nutrition shelf tags [22]](https://thumb-us.123doks.com/thumbv2/123dok_us/8791406.1766880/30.612.344.509.234.352/fig-simple-nutrition-shelf-tags.webp)
![Fig. 13. Calories count vending program [28]](https://thumb-us.123doks.com/thumbv2/123dok_us/8791406.1766880/33.612.392.499.99.232/fig-calories-count-vending-program.webp)
![Fig. 17. Combination of GDA and MTL systems [36]](https://thumb-us.123doks.com/thumbv2/123dok_us/8791406.1766880/34.612.103.269.564.635/fig-combination-of-gda-and-mtl-systems.webp)
![Fig. 18. SAIN/LIM system [38]](https://thumb-us.123doks.com/thumbv2/123dok_us/8791406.1766880/35.612.109.485.269.594/fig-sain-lim-system.webp)
