Copyright © 2012 IJECCE, All right reserved
Performance of Nakagami
–
m Fading Channel with Equal Gain
Combining and Maximal Ratio Combining Diversity Techniques
Dr. Neelam Srivastava,
Associate Professor, Institute of Technology, Lucknow, IndiaArpita Johri,
Assistant Professor, Sarvottam Institute of Technology & Management, Greater Noida India;Mudit Saxena,
Assistant Professor, Sarvottam Institute of Technology & Management, Greater Noida, India;ABSTRACT: Signal fading can drastically affect the performance of terrestrial communication systems. Fading caused by multipath propagation can degrade the bit-error-rate (BER) performance of a digital communication system resulting data loss or dropped calls in a cellular system.
The Nakagami-m distribution has gained widespread application in the modeling of physical fading radio channels. The primary justification of the use of Nakagami-m fading model is its good fit to empirical fading data. It is versatile and through its parameter m, we can model signal fading conditions that range from severe to moderate, to light fading or no fading.
This research paper discusses the generation of Nakagami–m data and once, the Nakagami-m distribution is generated, we applied BPSK modulation technique with Equal Gain Combining [EGC] Diversity technique and Maximal Ratio Combining [MRC] technique to study its SNR (Signal–to–Noise Ratio) and BER.
Index Terms—Nakagami–m fading, multipath propagation, Signal– to–Noise Ratio [SNR], Bit Error Rate [BER], Equal gain Combining [EGC] and Maximal Ratio Combining [MRC].
I. INTRODUCTION
The biggest challenge for wireless system designers is to minimize the effect of multipath and time varying nature of the mobile radio channels. In addition to this, the designers have to meet certain
more complexities like increasing demand for higher data rates, better quality of service (QoS), fewer dropped calls, higher network capacity and user coverage call for novel techniques that improve spectral efficiency and link reliability.
One of the innovative techniques being developed to meet this growing demand for always-on access to data is use of multiple antennas to improve energy / spectral efficiency. Antenna diversity reception techniques are used extensively in fading radio channels to reduce the effect of flat fading in system performance. The basic principle of antenna diversity is that multiple antenna outputs experience different signals due to different channel conditions and thus it is highly likely for one antenna to receive a sufficiently strong signal while the other one is in a deep fade.
The performance of any diversity system depends on the combining technique used to merge signals received by the antenna elements. The output signals from the diversity antennas can be selected or combined in several ways to optimize the received signal power. Among the most popular combining schemes are selection combining (SC), maximal ratio combining (MRC) and equal gain combining (EGC). In the recent years, radio-engineering requirements have become more stringent and necessitate not only more detailed information on median signal intensity, also much more exact knowledge on fading statistics in both ionospheric and tropospheric modes of propagation. Such circumstances demanded a large number of experiments and number of theoretical investigations to be performed. Field tests in a mobile environment are considerably more expensive and may require permission regulatory authorities. It is difficult to generate repeatable field test results due to random, uncontrollable nature of the mobile communication path. Atmospheric conditions and cost also play a key role in field test measurements. So, it is beneficial to simulate the results of performance of a particular wireless channel.
Due to this effect, the received signal consists of an infinite sum of delayed, phase-shifted and attenuated replicas of transmitted signal. The superposition can be constructive or destructive depending upon the phase of each replica. There are three basic mechanisms that impact signal propagation in a mobile communication system. They are reflection, diffraction, and scattering. [15]
Reflection
Reflection occurs when a propagating electromagnetic wave impinges upon an object which has very large dimensions when compared to the wavelength of the propagating wave. In other words it can be said that if the plane wave is incident on a perfect dielectric, part of the energy is transmitted and part of the energy is reflected back into the first medium. If the second medium is a perfect conductor, all the energy is reflected back. Reflections occur from the surface of the earth and from buildings and walls. In practice, not only metallic materials cause reflections, but dielectrics also cause this phenomenon.
Diffraction
Diffraction occurs when the radio path between the transmitter and receiver is obstructed by a surface that has sharp irregularities (edges). The secondary waves resulting from the obstructing surface are present throughout the space and even behind the obstacle, giving rise to a bending of waves around the obstacle, even when a Line of Sight path does not exist between transmitter and receiver. At high frequencies, diffraction, like reflection, depends on the geometry of the object, as well as the amplitude, phase, and polarization of the incident wave at the point of diffraction. Diffraction occurs when the radio path between the transmitter and receiver is obstructed by a dense body with large dimensions compared to
, causing secondary waves to be formed behind the obstructing body. It is often termed shadowing because the diffracted field can reach the receiver even when shadowed by an impenetrable obstruction.Scattering
Scattering occurs when the medium through which the wave travels consists of objects with dimensions that are small compared to the wavelength, and where the number of obstacles per unit volume is large. Scattered waves are produced by rough surfaces, small objects, or by other irregularities in the channel. In practice, foliage, street signs, and lamp posts induce scattering in a mobile communications system.
Figure 1.1 Multipath propagation in indoor environments. [The signal transmitted by the transmitter (T) is attenuated and reflected by the walls and floors. As consequence, the receiver (R) receives multiple distorted copies of the transmitted signal].
II. MODELS OF FADING
In this paper we have discussed Nakagami - m fading
channel. This is a very versatile fading model, which
by varying the values of the fading parameter
“
m
”,
it
can be modeled as either as Rayleigh model or Rician
model. [7] [8] [16]
The Nakagami-m PDF is in essence a central
chi-square distribution given by:
( ) =
( ) exp( − Ω ), ≥ (2.1)
m is the Nakagami
–
m fading parameter which ranges
from 0.5 to
∞.
α
is the channel fading amplitude.
Nakagami
–
m PDF for
Ω = 1 and
various values of m
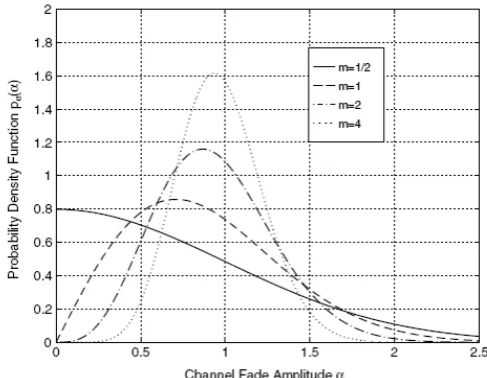
is shown in figure 2.2
Copyright © 2012 IJECCE, All right reserved SNR per symbol, γ, is distributed according to a gamma
distribution given by:
(
γ
) =
( )
exp ( -
), γ ≥ 0 (
2.2)
When m = 0.5, the PDF of Nakagami – m distribution resembles one- sided Gaussian distribution as shown in Fig. 2. For m=1, the Nakagami–m distribution matches with that of Rayleigh distribution. As m approaches ∞, the fading channel converges to a non–fading AWGN channel. When m < 1, m maps with q parameter and Nakagami– m distribution becomes closely related to Nakagami–q (Hoyt) distribution. The relation between m and q is quoted as:
=
(( )),
m
≥ 1
(2.3)
When m > 1, m maps with n parameter or Rician K parameter and Nakagami - m distribution becomes closely approximated to Nakagami–n (Rice) distribution.
The mathematical relation between m and n is given as:
=
( ),
n
≥ 0
(2.4)
Thus, we can conclude that Nakagami - m distribution
can be used to analyze fading with no direct line
–
of
–
sight between the transmitter and receiver antennas [as
Rayleigh distribution]
and the propagation path
consisting of one strong direct LOS component and
many other weaker components. Nakagami
–
m
distribution best fits to the empirical data involving
land
–
mobile propagation and indoor
–
mobile
multipath propagation and ionospheric radio links.
III. DIVERSITY TECHNIQUES
Diversity has long been used as a low-cost method to
help mitigate the multipath-induced fading that results
from users’
mobility. The basic idea of diversity is that
if one radio path undergoes a deep fade, another
independent path may have a strong signal. By having
more than one path to select from, both the
instantaneous and average SNRs at the receiver may be
improved by a huge dB margin. [12]
In
Maximal Ratio Combining [MRC]
diversity
technique, the signal in each branch is first co-phased
and once the phase distortions are canceled out, the
signal in each branch is weighted by a weighting factor
proportional to the ratio of the carrier amplitude to the
noise power for the i th branch. Therefore, the gain
factor in MRC system is given as:
=
for i
= 1,…….,M
(3.1)
This gives an output SNR equal to the sum of the
SNRs on the M branches for the maximal ratio system,
i.e.,
=
∑
⁄(3.2)
In MRC, the receiver weights incoming signals on L
antennas by the respective conjugates of the complex
fading random variables.[11]
In practical implementations, the weighting factors for
a MRC system are obtained by deriving a signal which
has an amplitude proportional to the i th branch carrier
amplitude and a phase that is the conjugate of the i
thbranch carrier random phase. The original i
thbranch
signal is then multiplied with this derived signal.
In Equal Gain Combining [EGC] diversity technique,
the received signal carriers are first co-phased as in the
case of MRC and are then equally weighted by their
amplitudes.[13] In other words, the branch weights are
all set to unity. The possibility of producing an
acceptable signal from a number of unacceptable
inputs is still retained. The gain factor for an equal gain
system can be written as:
=
, for i
= 1, ……, M (
3.3)
With equal noise levels in each branch, the output SNR
of EGC system is expressed as,
=
∑(3.4)
IV. SIMULATION ANALYSIS & DISCUSSIONS
The modulation technique being applied here is BPSK
[Binary Phase Shift Keying]. The phase of a constant
amplitude carrier signal moves between zero and 180
degrees. On an I and Q diagram, the I state has two
different values. There are two possible locations in the
state diagram, so a binary one or zero can be sent. The
symbol rate is one bit per symbol.
Figure 4.1 Constellation diagram for BPSK
We have assumed that the received signal is received
over L independent slowly varying flat Nakagami
–
m
fading channel.
Generation of Nakagami
–
m data set:
The Nakagami
–
m data set can be generated taking
square root of gamma distributed samples. [20]
r = sqrt(gamrnd(m,omega./m, m, N))
Here,
“
gamrnd
”
is a MATLAB function which
generates Gamma distributed samples.
“
sqrt
” is a MATLAB
function which takes the square
root of the defined values.
m
–
shape parameter whose values can be varied.
Omega / m
–
scale parameter.
N
–
No. of bits or symbols.
PDF of Nakagami
–
m data set:
The following MATLAB simulation shows that the
theoretical and practical pdf of Nakagami
–
m moel
closely approximates to each other. Moreover this is
proved with the help of simulation that when the value
of m is 0.5, the pdf resembles with one
- sided Gaussian distribution and for m=1, the Nakagami – m distribution matches with that of Rayleigh distribution.Figure 4.2. Random data following Nakagami–m distribution
Figure 4.3. Theoretical PDF of Nakagami–m distribution
Figure 4.4 Simulated PDF of Nakagami–m distribution
0 1 2 3 4 5 6 7 8 9 10 0
0.2 0.4 0.6 0.8 1 1.2 1.4 1.6 1.8 2
n
sa
m
pl
e
va
lu
es
Random data following Nakagami m distribution
m=2
0 0.5 1 1.5 2 2.5 3 3.5 4 0
0.2 0.4 0.6 0.8 1 1.2 1.4 1.6
z
pr
ob
ab
ilit
y
de
ns
ity
, p
(z
)
Probability density function of Nakagami m
m=0.5 m=1 m=2 m=4
0 1 2 3 4 5 6 7
0 0.5 1 1.5
z
pr
ob
ab
ili
ty
d
en
si
ty
, p
(z
)o
f N
ak
ag
am
i-m
Probability density function of abs(z)
Copyright © 2012 IJECCE, All right reserved
SNR of Nakagami
–
m model with EGC: [14]
This has been assumed that AWGN is also present.
This is being observed that as the number of antennas
is being increased the SNR is getting improved. The
performance of the model is also getting improved as
the value of m is increasing from 0.5 to 1.5.
Figure 4.5 SNR of Nakagami–m channel with EGC.
SNR of Nakagami
–
m model with MRC:
We are again assuming that AWGN is present.
Figure 4.6 SNR of Nakagami–m channel with MRC
The analysis of the channel with MRC is a bit difficult
to achieve as compared to EGC because the SNR has
to be calculated at each value of m and this has been
observed that theoretical values match very well with
the simulated values of SNR. The above figure shows
the SNR using MRC at m = 0.5.
BER comparison of Nakagami
–
m channel and
AWGN: [17] [19s]
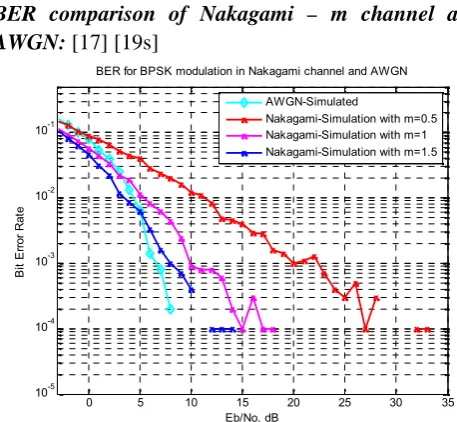
Figure 4.7 BER of Nakagami -m channel with EGC
This can be observed from the above simulation that
BER of AWGN channel is the minimum. This can also
be concluded that as the value of m is increasing from
0.5 to 1.5, the channel’s performance is improving and
it is coming near to approximation with AWGN
channel. This goes with the theoretical fact that as the
value of m approaches
∞, the Nakagami –
m fading
channel’s response is the same as that of a no- fading
AWGN channel.
BER analysis of Nakagami
–
m channel with BPSK
and MRC:
Figure 4.8 BER of Nakagami–m channel with MRC
2 4 6 8 10 12 14 16 18 20 0
2 4 6 8 10 12 14
Number of receive Antenna
S
N
R
g
ai
n,
d
B
SNR improvement with Equal Gain Combining (EGC)in NAKAGAMI Fadin Channel for m=0.5, 1 and 1.5
EGC in NAKAGAMI m-0.5 EGC in NAKAGAMI m-1 EGC in NAKAGAMI m-1.5
2 4 6 8 10 12 14 16 18 20 0
2 4 6 8 10 12 14 16
Number of receive antenna
S
N
R
g
ai
n,
d
B
SNR improvement with Maximal Ratio Combining in Nakagami-m channel with m=0.5
Theoratical Practical
0 5 10 15 20 25 30 35 10-5
10-4 10-3 10-2 10-1
Eb/No, dB
B
it
E
rro
r R
at
e
BER for BPSK modulation in Nakagami channel and AWGN
AWGN-Simulated
Nakagami-Simulation with m=0.5 Nakagami-Simulation with m=1 Nakagami-Simulation with m=1.5
0 5 10 15 20 25 30 35 10-5
10-4 10-3 10-2 10-1
Eb/No, dB
B
it
E
rro
r R
at
e
This can be observed that BER of Nakagami
–
m
model with MRC is much lower than that when
simulated with EGC as diversity technique. This
concludes that MRC’s performance is better than that
of EGC’s.
The above simulation has been done with m = 0.5.
V. CONCLUSIONS & FUTURE SCOPE
This has been concluded that the Nakagami
–
m
distribution can be modeled to other distributions by
varying the values of m. Secondly, as the value of m
increases, the BER as well as the SNR gets improved.
The number of antennas also plays an important role in
improving the performance of the Nakagami
–
m
model.
This is also concluded that for same values of m. the
performance of MRC is superior to that of EGC.
The future scope involves the use of better modulation
schemes like GMSK, DPSK, OQPSK etc. In this paper
we have discussed diversity techniques. The analysis
of performance of Nakagami
–
m model can be done
using equalizers and channel coding techniques.
REFERENCES
[1]Siavash M. Alamouti, “A Simple Transmit Diversity Technique for Wireless Communications”, IEEE JOURNAL ON SELECT
AREAS IN COMMUNICATIONS, VOL. 16, NO. 8, OCTOBER 1998.
[2] Kun -Wah Yip, Member IEEE and Tung -Sang Ng, Senior
Member IEEE, “ A Simulation Model for Nakagami – m fading
channels, m < 1”, IEEE Transactions on Communications, VOL.
48, NO.2, February, 2000
[3] P. R. Sahu, Student Member, IEEE, and A. K. Chaturvedi, Senior Member, IEEE, “Performance Analysis of Predetection
EGC in Exponentially
Correlated Nakagami-m Fading Channel”, IEEE
TRANSACTIONS ON COMMUNICATIONS, VOL. 53, NO. 8, AUGUST 2005.
[4] M. Nakagami, ”The m-distribution A general formula of intensity distributionof rapid fading,”Statistical Methods in Radio Wave Propagation, W. G. Hoffman, Ed. Oxford, U.K.: Pergamon,
1960.
[5] M. S. Simon and M. S. Alouini, ”A unified approach to the
performance analysis of digital communication over generalized
fading channels”,
Proceedings of IEEE, vol. 86, no. 9, pp. 1860-1877, Sept. 1998
[6] M.-S. Alouini and M.K. Simon, ”Performance analysis of
coherent equal gain combining over
Nakagami-mfading channels,”IEEE Trans. Vehic. Technol., vol. 50, pp. 1449-1463, Nov. 2001.
[7] Jianxia Luo and James R. Zeidler, “A Statistical Model for
Correlated Nakagami– m fading channels”IEEE 2000.
[8] Marvin K. Simon, Mohamed-Slim Alouini
“Digital Communication over Fading Channels: A Unified Approach to Performance Analysis”John Wiley & Sons, 2000. [9] Ramesh Annavajjala, Student Member, IEEE, A. Chockalingam, Senior Member, IEEE, and
Laurence B. Milstein, Fellow, IEEE, “Performance Analysis of Coded Communication Systems on Nakagami Fading Channels With Selection Combining Diversity.” IEEE TRANSACTIONS ON COMMUNICATIONS, VOL. 52, NO. 7, JULY 2004
[10] J. G. Proakis, Digital Communications. New York: McGraw-Hill, 1995.
[11] A. Ramesh, A. Chockalingam and L. B. Milstein,“Bounds on the Performance of Turbo Codes on Nakagami Fading Channels
with Diversity Combining”.Proc. IEEE GLOBECOM, Nov. 2001,
pp. 1199–1204.
[12] Hafeth Hourani, “An Overview of Diversity Techniques in Wireless Communication Systems”,S-72.333 Postgraduate Course in Radio Communications (2004/2005).
[13] M.-S. Alouini and M.K. Simon, “Error Rate Analysis of
MPSK with EGC over Nakagami – m fading Channels,” IEEE
1999.
[14] S.A. Kotsopoulos and G.K. Karagiannidis, “Error performance for equal-gain combiners over Rayleigh fading channels”
ELECTRONICS LETTERS 11th May 2000 Vol. 36 No. 10. [15]Fabio Belloni, “Fading Model”, S-72.333 POSTGRADUATE COURSE IN RADIO COMMUNICATIONS, AUTUMN 2004. [16] Bernard Sklar, Communications Engineering Services,
“Rayleigh Fading Channels in Mobile Digital Communication Systems Part I: Characterization, “IEEE Communications Magazine July 1997.
[17] Mukesh Kumar Mishra, Hemant Singh Ajal, Ravi Kumar,
“Error Rate Performance Analysis of OFDM System over Nakagami-n and Nakagami-q Distributions”.
[18]Neetu Sood, Ajay K Sharma, Moin Uddin, “BER Performance
of OFDM-BPSK and -QPSK over Nakagami-m Fading Channels”,
Proc of 2nd IEEE IACC-2010, pp 88-90, Feb. 2010.
[19] Mukesh Kumar Mishra, Neetu Sood, Ajay K Sharma, “BER Performance of OFDM-BPSK System over Nakagami Fading
Channels”, International Journal of Computer Applications
(IJCA),vol. 17 no.8,pp.1-3,March 2011.
[20]Jos´e Cˆandido Silveira Santos Filho,Student Member, IEEE,
Michel Daoud Yacoub, and Gustavo Fraidenraich, Student
Member, IEEE, “A Simple Accurate Method for Generating Autocorrelated Nakagami-m Envelope Sequence”., IEEE COMMUNICATIONS LETTERS, VOL. 11, NO. 3, MARCH 2007.
[21] Gustavo Fraidenraich, Student Member, IEEE, Olivier
L´evˆeque Member, IEEE, and John M. Cioffi, Fellow Member, IEEE, “On the MIMO Channel Capacity for the Nakagami-m Channel”
Copyright © 2012 IJECCE, All right reserved
A
UTHOR’
SP
ROFILEDr. Neelam Srivastava
is Associate Professor in Institute of Engineering and Technology, Lucknow, Uttar Pradesh India. She received her Bachelor Degree in 1985 from M.M. Engineering College, Gorakhpur, India and
has Master’s Degree from I.T Banaras Hindu University, India in Microwaves in 1987. She has been awarded with Ph.D. Degree from Lucknow University, India in 2004 in Optical Communication. She has been working in Institute of Technology, Lucknow, India since 1986 till date. She has published many papers in renowned International Journals and published many books in her areas of interest that lies in Wireless Networks, Microwaves, Optical Communication and Optical Instrumentation. She is guide to many Ph.D and M.Tech scholars. She is the member of IETE (F080648), IE (M-134084-5) and IEEE.
Arpita Johri
is Assistant Professor in Sarvottam Institute of Technology and Management, Noida Extension, Greater Noida, India. She has completed herBachelor’s Degree from Uttar Pradesh Technical University from Institute of Engineering and Rural Technology, Allahabad, India in 2005 and is pursuing her M.Tech from the same. The area of her specialization is Digital Communication. She has worked in Anand Engineering College, Agra, India for 5 years