Int. J. Adv. Res. Sci. Technol. Volume 3, Issue1, 2014, pp.17-22 # ICV 5.14
International Journal of Advanced Research in
Science and Technology
journal homepage: www.ijarst.com
ISSN 2319 – 1783 (Print)
ISSN 2320 – 1126 (Online)
Multi-Threshold Image Segmentation for Lung Cancer Image Mining
Samatha G.*1, Manjula D.V.1, and Madhu K.2
1
Department of Computer Science and Engineering, Kakinada Institute of Engineering and Technology (KIET), India.
2Mymo Wireless Technology Pvt. Ltd. Bangalore, India
*Corresponding Author’s Email: [email protected]
A R T I C L E I N F O A B S T R A C T
Article history: Received Accepted Available online
20 Mar. 2014 23 Apr. 2014 24 Apr. 2014
In the medical image mining, the mining pattern is directly depending upon the features, which are extracting from images at the pre-processing stage. Therefore accurate and robust segmentation is essential to estimate these parameters for quantitative assessment of medical images in order to achieve correct clinical diagnosis. Global threshold determination for a lung CT image based on histogram much simpler and less time consuming process, but it fails to segment the image more effectively. In order to overcome this limitation, a new method, based on an iterative-Otsu optimization approach is proposed for multi-thresholds determination. The objective of this work is to estimate the lung nodule size more accurately by utilizing “between class-variance” criterion of Otsu method in an iterative way. The algorithm runs through n-number of iterations and exits when reaches a preset threshold difference value. We applied this method on few lung CT images from the National Lung Screening Trail database to verify the proposed methodology against single threshold results. The extracted features are presented for the comparison. The preliminary results show that the proposed algorithm is better performing in estimate the nodule size efficiently for Lung CT images.
© 2014 International Journal of Advanced Research in Science and Technology (IJARST).
All rights reserved. Keywords:
Image Processing, Image mining, Otsu method, Multi-thresholding.
Introduction:
Medical image processing is one the emerging fields in signal processing, where data to be processed extensively on large scales in order to diagnoses the patient illness. One of such an important applications are medical images mining, in which computational intelligence applied to automatically analyzing patient‟s records aiming at the discovery of new knowledge potentially useful for medical decision making. It handles with the hidden knowledge extraction, image data association and additional patterns which are not clearly accumulated in the images. Prior to mine the intended lung cancer patients‟ data, it is required to process all the images and to extract the various features. The features should represent their “essence”, regarding a specific aspect of the images, in such a way that the images would be managed-indexed, compared and searched based on their features [14]. This feature extraction will be done in three consecutive steps. The initial step is to remove the noise from the image, next step to segment the image with the proposed method, and finally extract various features such as area, perimeter, eccentricity etc. for further analysis.
Data preparation is typically the least formalized, the most domain-dependent, and the most time consuming
part of the knowledge discovery process.
Int. J. Adv. Res. Sci. Technol. Volume 3, Issue1, 2014, pp.17-22 # ICV 5.14 implemented a multi-threshold segmentation method
and achieved improvement over single-threshold segmentation. A three level intensity classified lung CT image processed through morphological operations and level set method [17]; this method performing better in week vessels, weak junctions of vessels, tiny and non-solid nodules usually detected by this method. For computer aided systems (CAD) many methods are
introduced; an expectation-maximization (EM)
algorithm and morphological method [6][8], region growing method [19]. Other methods such as “an optimal threshold” for accurate quantization of volumetric X-ray CT images [9], “graph search algorithm” [7], “watershed method” [12][13] and combination of methods “Optimal thresholding & region growing”, “thresholding & watershed” [6] are also used to segment lung CT image.
Image Processing:
Lung CT image processing, broadly, can categorize into four stages. “Fig. 1”, shows a general description of lung cancer detection system that contains four basic stages. The first stage starts with acquiring a collection of CT images (normal and abnormal) for the target patient. The second stage applies several techniques of image enhancement, to filter out the noise and to get the best level of quality and clearness. The third stage, and the important one for the present work, applies image segmentation algorithms which play vital role among the image processing stages, and finally, in the fourth stage obtains the intended features from enhanced& segmented image which gives indicators of normality or abnormality information of the lung image.
Acquiring the images:
The low-dose pulmonary CT images have been used in this paper are obtained from Digital Image Archive, National Lung Screening Trail (NLST), USA.
Image Enhancement:
The aim of the image enhancement is to improve the interpretability or perception of the image for human views, or to provide better input for other
automated image processing techniques. Image
Enhancement (IE) transforms the image to provide better representation of the subtle details. Image enhancement is application specific: an IE technique is suitable for one problem, might be inadequate for another. There is no general theory for determining
what “good” enhancement is when it comes to human perception [5]. The enhancement methods can broadly be divided in to the following two categories:
i. Spatial domain methods
ii. Frequency domain methods.
In spatial domain techniques, we directly deal with the image pixels and the values of the pixels are manipulated to achieve the desired enhancement. Few such techniques are “contrast and dynamic range modification”, “Noise reduction”, “edge enhancement and detection”. In frequency domain methods the image first transferred from time domain to frequency domain, then all the enhancement operations will perform, then transform back to time domain using inverse Fourier transform. To make the image better and enhance it from noising, corruption or interference, the “Gabor filter” technique has been used. However, when image enhancement techniques are used as pre-processing tools for other image processing, the quantitative measure can determine which are most appropriate.
A. Gabor Filter:
Gabor filter is a linear filter whose response is defined by a harmonic function multiplied by a Gaussian function. Image presentation based on Gabor function constitutes an excellent local and multi-scale
decomposition in terms of logons that are
simultaneously (and optimally) localization in space and frequency domains.
( ) √
… (1)
where „G‟ is Gaussian function and „σ‟ is the standard deviation of the distribution.
Because of the multiplication - convolution property (Convolution theorem), the Fourier transform of a Gabor filter‟s impulse response is the convolution of the Fourier transform of a harmonic function and the Fourier transform of the Gaussian function. “Fig. 2.” shows raw image and its corresponding histogram and “Fig. 3” shows the Gabor filtered output image and corresponding histogram.
Figure1. Image Processing Stages
i) Original CT image ii) Histogram
Int. J. Adv. Res. Sci. Technol. Volume 3, Issue1, 2014, pp.17-22 # ICV 5.14
Image Segmentation:
Image Segmentation is one of the key steps for feature extraction. It is directly affects the follow-up results of image processing and the extraction accuracy of characteristic information [3]. In recent years many types of image segmentation algorithms are have been proposed, including threshold approach, region detection, edge detection and so on. In practical applications, the image will be dividing into different heterogeneous regions that do not overlap with each other. The goal of segmentation is to simplify and change the representation of an image into something that is more meaningful and easier to analyse [4]. By the statistical theory, the more between-class variance, the better separation results. Segmentation of nontrivial images is one of the most difficult tasks in image processing. Segmentation process subdivides an image in to its constitutes regions or objects. The level of detail to which the subdivision is carried depends on the problem being solved, i.e. the segmentation should stop when the objects or regions of interest in an application have been detected.
Segmentation algorithms for monochrome images, generally, are categorized into two classes based on the basic properties of intensity values.
1. Discontinuity 2. Similarity.
The second category is based on partitioning an image into regions that are similar according to a set of predefined criteria. Thresholding is falls into this category and other approach to segment the image based on morphology. This approach is particularly attractive because it combines several of the positive attributes of segmentation based on the techniques presented in the first part. In the first category, the approach is to partition an image, based on the abrupt changes in the intensity, such as edges. The principal approach, fundamental problem in segmentation is to partition the image into regions which satisfies the following conditions.
a) Segmentation must be complete, i.e. every pixel must be in a region.
b) It requires that points in a region be connected in some predefined sense.
c) Regions must be disjoint.
d) Regions deal with the properties that must be satisfied by the pixels in a segmented region.
e) It indicates that two adjacent regions must be different in the sense of predicate.
Thresholding is the simplest and commonly used technique for segmentation. This technique can be divided into bi-level, multi-level categories, depends on number of image segments. The bi-level thresholding classifies the image into two classes, one including those pixels and with gray levels above a certain threshold, and the other includes the rest. The multi-thresholding classifies the pixels belonging to same class have gray-levels within a specific range defined by several thresholds [2][3]. Multi-thresholding is very important technique in medical image segmentation and machine vision applications, where single thresholding techniques fail to separate the objects form the background [8] efficiently. In the present work, multi-threshold based on iterative-Otsu method has been adopted to perform the segmentation on few CT images from the National Lung Screening Trail (NLST) database.
B. Single-Thresholding:
In an ideal case, the histogram has a deep and sharp valley between two peaks representing objects and background, respectively, so that the threshold can be chosen at the bottom of this valley [1]. The detection of the bottom of the valley is always not possible, where the valley is flat and broad, imbued with noise, or when the two peaks are extremely unequal in height, often producing no traceable valley. Because of its institutive
properties, simplicity of implementation, and
computational speed, image thresholding enjoys a central position in applications of image segmentation. In any image one obvious way to extract the objects from the background is to select a threshold, T. Then any point (x, y) in the image at which f(x, y) > T is called object point; otherwise point is called background point. In other words, the segmented image g(x, y), is given by
( ) { ( ) ( ) ... (2)
when T is constant applicable over entire image, the process given in this equation is referred to as global thresholding. When the value of T changes over an image, we use the term variable thresholding. If T depends on spatial co-ordinates (x, y) themselves, then the variable thresholding is often referred to as dynamic or adaptive thresholding.
C. Multi-Thresholding:
In practice, using multiple global thresholding is considered a variable approach when there is reason to believe that the problem can be solved effectively more than two thresholds. This technique determines more than one threshold for a given image and segments the image into certain brightness regions, which correspond
i) Enhanced CT image ii) Histogram
Int. J. Adv. Res. Sci. Technol. Volume 3, Issue1, 2014, pp.17-22 # ICV 5.14 to one background and several objects [18]. In the
present work we implemented multi-threshold
segmentation by recursive-Otsu method [19].
Otsu’s Method:
Otsu method proposed a segmentation procedure based on nonparametric and unsupervised method [1]. In this method an optimal threshold is selected by the discriminant criterion to maximize the seperability of the resultant classes in gray levels. Let the pixels of a given picture be represented in L gray levels [1, 2, 3… L]. The number of pixels at level i is denoted by ni and the total number of pixels by N = n1 + n2 + …. + nL. From these “L” numbers of pixels, the gray-level histogram is normalized and regarded as a probability distribution:
⁄ , ∑ … (3)
In the first step all the histogram values are divided into two classes C0, C1 by a threshold level k; C0 denotes pixels with levels [1, 2 … k] and C1 denotes pixels with levels [k+1… L]. Then the probability of class occurrence and the class mean levels can be written as
( ) ∑ ( ) ... (4)
( ) ∑ ( ) ... (5)
and
∑ ( | )
∑ ⁄
( ) ( )
⁄ ... (6)
∑ ( | )
∑ ⁄
( )
( ) ….. (7)
where
( ) ∑ … (8)
and
( ) ∑ … (9)
are the zeroth and the fist-order cumulative moments of the histogram up to the kth level, respectively. The class variances are given by
∑( ) ( | )
∑ ( ) ⁄
… (10)
∑ ( ) ( | )
∑ ( ) ⁄
... (11)
From the equations (4), (5), (6), (7), (10), and (11) further we can derive the “within-class variation”, “between-class variance” and the “total variance” as follows.
… (12)
( ) … (13)
∑ ( ) … (14)
The above parameters always hold a basic relation as
following.
... (15)
The optimal k can be determined from the parameters within-class variance and total variance is
k ⁄ ... (16)
and the optimal threshold k* is given by
( ) ( )
… (17)
here, the range of k over which the maximum is sought can be restricted to
* ( ), ( )- ( ) + … (18)
From the equation (13), the criterion measure takes a minimum value of zero for such k as
k ∊ S – S* = {k; ω(k) = 0 or 1 } … (19)
i.e. making all pixels either C1 or C0, which is not our concern. This optimal threshold procedure can be extended to multi-threshold determination by virtue of the discriminant criterion. The criterion measure is then a function of two variables k1 and k2, and an optimal set of thresholds and is selected by
maximizing :
( ) ( ) … (20)
It should be noticed that the selected thresholds generally become less credible as the number of classes to be separated increases.
Iterative-Otsu algorithm:
Above discussed formula translated into the following algorithm to find out the optimal thresholds.
Int. J. Adv. Res. Sci. Technol. Volume 3, Issue1, 2014, pp.17-22 # ICV 5.14 Step-2: Divide histogram into two regions R1 and R2
using T
Step-3: Calculate the mean intensity values µ1 and µ2 in the regions R1 and R2
Step-4: Pixels with intensity values in the interval [0, µ1] and [µ2, 256] are assigned a value equal to the respective weighted means of their values.
Step-5: Select a new threshold T = (µ1 + µ1)/2
Step-6: Repeat 2-4 until the mean values µ1 and µ2 do not change in successive iterations.
Figure4
. Shows single and multi-threshold segmented images respectively.Feature Extraction Stage:
After processing the image through enhancement and segmentation stages, it is mandatory to analyze the feature of the each nodule to distinguish true nodule from the false positive nodule. Many parameters such as area, eccentricity, perimeter, mean value etc., are acts as basis for classification process. These features are defined as follows.
i. Area: It is a scalar value, which gives the actual number of overall nodule pixels. It is obtained by summation of pixels in the image that is registered as 1 in the binary image obtained.
ii. Perimeter: it is a scalar value that gives the actual number of overall nodule pixel. It is obtained by
the summation of the interconnected of the outline of the registered pixel in the binary image.
iii. Eccentricity: This matrix value or roundness or circularity index (I) is to 1 only for circular and it is less than 1 for any other shapes. Here it is assumed that more circularity of the object.
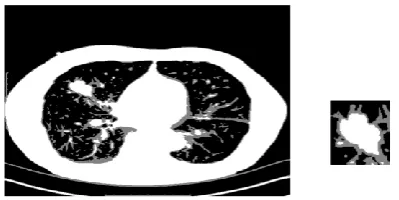
“Fig. 6.” Shows that a segmented image with extracted nodule. Using above features, one could analyze these features and use as clues for discrimination explicitly.
Results and Discussion:
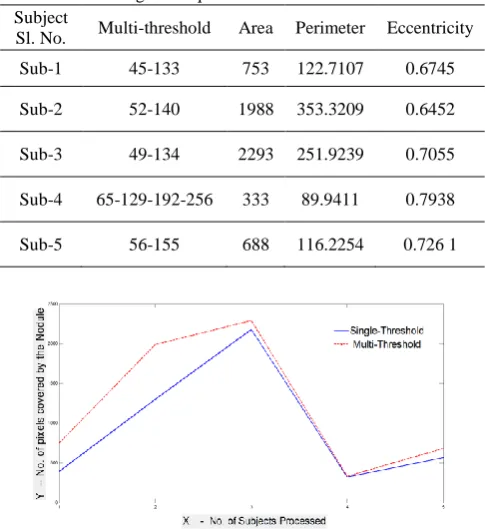
To evaluate the performance of the proposed algorithm, we presented some experiments with few subjects from the NLST CT lung image database. The present algorithm is developed based on the research presented by Otsu N[1]. Here, various subjects are performed though different number of iterations based on the saturation of the averaged threshold observed from the intended algorithm. Various parameters are extracted from throughout the experiments and presented in the following tables 1&2. From the tables 1&2, it is observed that the “area” of a nodule for the given image is always greater than the “area” from the single-threshold output.
Table 1. Parameter extraction for the given subject using single threshold technique
Subject Sl. No.
Single- Threshold
Area Perimeter Eccentricity
Sub-1 114 397 86.0833 0.7772
Sub-2 114 1300 175.0955 0.7828
Sub-3 101 2178 248.1665 0.6888
Sub-4 114 327 87.3553 0.7924
Sub-5 109 568 100.5685 0.7623
For better comparison of the obtained results, a graph is presented between single threshold and multi-threshold of a nodule parameter “area”. It is shown in the “Fig. 5”.
Figure5. Histogram for single and multi-threshold lung CT image
Int. J. Adv. Res. Sci. Technol. Volume 3, Issue1, 2014, pp.17-22 # ICV 5.14 Table 2. Parameter extraction for the given subjects using
multi-thresholding technique Subject
Sl. No. Multi-threshold Area Perimeter Eccentricity
Sub-1 45-133 753 122.7107 0.6745
Sub-2 52-140 1988 353.3209 0.6452
Sub-3 49-134 2293 251.9239 0.7055
Sub-4 65-129-192-256 333 89.9411 0.7938
Sub-5 56-155 688 116.2254 0.726 1
Conclusions and Future work:
This paper presented a multi-threshold algorithm using iterative-Otsu method to estimate the lung nodule size and other parameters more accurately. In order to process the data; initially the “Gabor filter” is applied to remove the noise from the images at the image enhancement stage. Experimented result shows that the proposed method offers more accuracy in determining the nodule size in a given CT lung image. It is also noticed that the significant improvement on the limitations of single threshold method. Authors wish to extend this work by processing good quantity of data set and apply mining techniques on obtaining features.
Acknowledgements:
Authors wish to thank Digital Image Archive - National Lung Screening Trail (NLST), USA, for providing data to carry out this research work.
References:
1. N. Otsu, “A threshold selection method from gray-level histograms”, IEEE transactions on Systems man Cybernet SMC-9 (1), Pages: 62-66, 1979.
2. N. Hui-Fuang, “Automatic threshoding for defect detection”, Pattern Recogn. Lett. Pages: 1644-1649, 2006.
3. X. Zhou, T. Hayashi, T. Hara and H. Fujita “Automatic recognition of lung lobes and fissures from multislice CT image”, Proc. SPIE Conf. Med. Imag., vol. 5370, pp.1629-1633 (2004)
4. L. Ke, D. Yang and X. Wang “An Improved Target Extraction Algorithm Based on Region Growing for
Lung CT image”, Proc. International Conf. Complex Med. Engg. (2007).
5. A. Chaudhary, and S.S. Singh, “Lung Cancer Deterction on CT images by Using Image Processing”, Couputing Sciences (ICCS), 2013 International Conference. pp. 142-146, (Sep-2012)
6. A. Farag, J. Graham, and Aly Farag, “Robust Segmentation of Lung Tissue in Chest CT Scanning,” Proc. Of 2010 IEEE International Conference on Image Processing (ICIP), pp. 2249-2252, 2010.
7. P. Hua, Q. Song, M. Sonka, E.A. Hoffman and J. M. Einhardt “Segmentation of pathologcal and diseased lung tissue in CT images using a graph-search algorithm”, 2011 IEEE Int. Symp. Boimed. Imaging: From Nano to Marco, pp. 2072-2075, (2011).
8. T.Y. Ji, P.Z. Wu, M.S. Li, and H.R. Zheng , “Adaptive
CT image segmenation using mathematical
morphology”, 5th Computer Science and Electronic Engineering Congerence (CEEC), pp. 92-96, (2013). 9. Y. Tao, L. Lu, M. Dewan, A.Y. Chen, J. Corso, J. Xuan,
M. Salganicoff, and A. Krishnan, “Multi-level ground glass nodule detection and segmentatio in CT lung images. MICCAI 2009. LNCS, vol. 5762, pp. 715-723. Spinger, Heidelberg(2009).
10.X. Dong, and L. Fuyun, “Research and Application of CT image Mining based on Rough Sets Theory and Association Rules”, Computer Science and Information Technology (ICCSIT), 2013 3rd IEEE International Conference, vol.6, pp. 392-394 (July 2010)
11.O.A. Vatamanu and M Lonescu “Data Mining in digital image processing using the Gabor filters algorithm‟, IEEE 8th International Conference on Intelligent Computer Communication and Processing CLUJ-NAPOCA, pp. 173-178. ROMANIA,( Aug-2012) 12.R. Shojaii, J. Alierezaie, and P. Babyn, “Automatic lung
Segmentation in CT images using watershed transform”, Proc. 8th IEEE International Symposium on Computersa and Communication, vol.2, pp. 1270-1273, (2005). 13.Y.F. Zhang, S. Wu, G. Yu and D.L. Wang “A hyrbid
image segmentation approach using watershed transform and FCM”, Porc. Int. Conf. Fuzzy Syst. Knowl. Discovery, pp. 2-6, (2007).
14.J.F. Rodrigues Jr., A.J.M Traina, and C.J.M. Traina “ Enhanced Visual Ealuation of Feature Extractors for Image Mining” 3rd ACS/IEEE International Conference, vol. 10, pp. 7803-8735, (2005).
15.M.E. Celebi, Y.A. Aslandogan, and P.R. Bergstresser, “Mining biomedical images with density-based clustering”, Int. Conf. on Information Technology: Coding and Computing, vol.1, pp. 163-168, (2005). 16.S. Chen, Y. Lin, Y. Liu and Z. Lu, “ Image segmentation
by multi-threshold based on Fisher function and histogram algorithm”, ICCASM, International Conference, vol. 12, pp. 269-272,(Oct-2010).
17.T.K. Le, “Segmentation of lung vessels together with Nodules in CT images using Morphological operations and level set method”, Journal of Medical and Bioengineering, vol. 2. pp. 5-10. (2013) intuitiveness 18.S. Arora, J. Acharya, A. Verma and P.K. Panigrahi
“Multilevel thresholding for image segmentation through a fast statistical recursive algorithm”, pattern Recognit. Lett., vol.29. pp.119-125 (2008)
19.M. Cheriet, J.N. Said and C.Y. Suen “A recursive thresholding technique for image segmentation”, IEEE Transactions on Image Processing, vol.7, pp. 918-921 (1998)