International Journal of Intelligent Information Systems
2013; 2(1) : 19-25Published online February 20, 2013 (http://www.sciencepublishinggroup.com/j/ijiis) doi: 10.11648/j. ijiis.20130201.13
A design of the preference acquisition detection system
using the EGG
Hironobu Fukai
1, Yohei Tomita
2, Yasue Mitsukura
31
Tokyo University of Science, Chiba, Japan
2
Foster Electric Company, Limited, Tokyo, Japan
3
Keio University, Kanagawa, Japan
Email address:
[email protected] (H. Fukai), [email protected] (Y. Tomita), [email protected] (Y. Mitsukura)
To cite this article:
Hironobu Fukai, Yohei Tomita, Yasue Mitsukura. A Design of the Preference Acquisition Detection System Using the EEG. International Journal of Intelligent Information Systems, Vol. 2, No. 1, 2013, pp. 19-25. doi: 10.11648/j.ijiis.20130201.13
Abstract:
Estimation of emotional states has been multi-disciplinary research interests. Among them, although there are many ways of the estimation such as subjective evaluations and behavioral taxonomy, direct evaluation from the human brain is more reliable. Especially, electroencephalographic (EEG) signal analysis is widely used because of its simplicity and convenience. In our research, emotional states are investigated with a simple electroencephalography which has only one electrode. This device is lighter and cheaper than existing devices.However, its feasibility has yet been proven.Keywords:
KANSEI; Human Interest; EEG1. Introduction
Recently, many services that considered the personal preference have been provided. Along with it, the study of acquiring personal preference and KANSEI are actively done. KANSEI is Japanese word becausestudying at first in Japan. Generally sensitivity is inborn;it’s said that KANSEI is postnatal. There are a subjective index and an objective index in the method of acquiring the preference. A subjec-tive index is obtained by the questionnaire, and an objecsubjec-tive index is given by the bio-signal [1, 2]. An objective index can show the physical quantity by the numeric value. Therefore, an objective and engineered approaches possible [3]. By the way, there are a lot of reports concerning the relation between the EEG and the preference and the KANSEI in the analysis of the bio-signal [4]-[8]. This is based on the idea “the state of the brain should change if these states change because brain governs the mind, con-scious, recognition and the sense”, and so on[9, 10]. Then, the EEGthat is one of the bio-signals is used for the index to acquire the preference in this study. In this study, we pro-pose the various preference measurement systems such as for olfactory sense, acoustic sense, haptic sense, taste sense, visual sense (generally called five senses) and it’s combina-tion (i.e., acoustic sense, and visual sense). In this paper, we introduce the procedure of the EEG measurement and analysis method, and described as an example real system
which is titled“Visualization of the Mind Status using the EEG”. Furthermore, we demonstrate these systems by us-ing the EEG in that day.
2. Analysis of the EEG
human-interest. In addition, measurement methodology is referential recording: reference electrode is arranged at the left ear lobe and exploring electrode is at
is analyzed by using fast Fourier transform per one sec., and we can obtain the amplitude spectra at 1
2.1. KANSEI and Sensibility
There are 2 ways of indicating the preferences that is, KANSEI and sensibility. These 2 words are ver
It is because preferences which are obtained in this paper are constructed by the KANSEI.Sensibility is similar to KANSEI but difference. KANSEI is Japanese words b cause studying at first in Japan. On the other hand, Sens bility is innate ability. KANSEI is acquired after birth. focus on Preference from KANSEI by using EEG in this paper.
2.2. The Simple Electroencephalograph
In this study, the simple electroencephalograph of the band type is used. This electroencephalograph is made by Brain Function Research & Development Center in Japan. Fig. 2 shows this electroencephalograph. The
electroencephalograph (EEG) is expensive, large, and i possible to measure under in a natural environment. Ther fore, the subjects are strained.This electroencephalograph is compactly made as 120mm (W), 135mm (D), and 35mm (H) and can be measured under the practical environment. Therefore, it's less burdensome on subjects. The electrode is fixed to the headband. The measurement position is ele trode arrangement Fp1 in international 10
shows the international 10-20 system. We
discrete time data that the EEG of one second is analyzed frequency to 24 Hz at 1Hz interval. The band filter from 4 Hz to 22 Hz is used for this simple electroencephalograph. Therefore, we use the time series data of each frequency components between 4 and 22Hz.
Figure 1. The points from international 10
Figure 2. Our proposed EEG device.
interest. In addition, measurement methodology is referential recording: reference electrode is arranged at the left ear lobe and exploring electrode is at Fp1. The EEG data is analyzed by using fast Fourier transform per one sec., and we can obtain the amplitude spectra at 1-64Hz.
There are 2 ways of indicating the preferences that is, KANSEI and sensibility. These 2 words are very important. It is because preferences which are obtained in this paper are constructed by the KANSEI.Sensibility is similar to KANSEI but difference. KANSEI is Japanese words be-cause studying at first in Japan. On the other hand, Sensi-lity. KANSEI is acquired after birth. We
by using EEG in this
Electroencephalograph (EEG)
In this study, the simple electroencephalograph of the band type is used. This electroencephalograph is made by Brain Function Research & Development Center in Japan. electroencephalograph. The conventional is expensive, large, and im-possible to measure under in a natural environment. There-d.This electroencephalograph is compactly made as 120mm (W), 135mm (D), and 35mm (H) and can be measured under the practical environment. Therefore, it's less burdensome on subjects. The electrode is fixed to the headband. The measurement position is
elec-Fp1 in international 10-20 system. Fig. 1 system. We can obtain the discrete time data that the EEG of one second is analyzed frequency to 24 Hz at 1Hz interval. The band filter from 4 Hz to 22 Hz is used for this simple electroencephalograph. Therefore, we use the time series data of each frequency
points from international 10-20 method.
Our proposed EEG device.
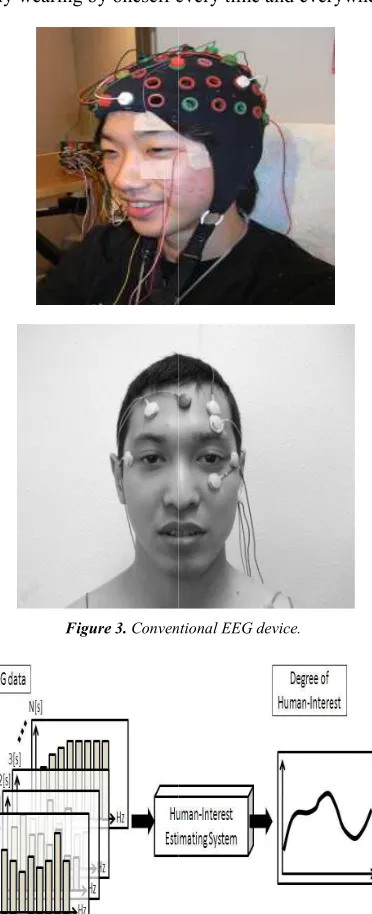
The EEG devices in Fig. 3 are conventional EEG devices. In these devices, it is a long time to wear. The left one, it is 45 minutes and the right one needs about 30 minutes, r spectively. On the other hand, in our EEG device, it takes 30 seconds to wear.This device is easy to wear and we can reduce of the number of electrodes. The contribution of our devices is as follows:
Reduction of the number of electrodes Needless of gel for the wearing
Easily wearing by oneself every time and every
Figure 3. Conventional EEG device
Figure 4. The Principle of the proposed method rences.
In particular, we usually used questionnaire as a pref rence investigation method, It is easy to understand pref rence but difficult to obtain sequential measurement We need the sequential investigation in this paper.
we pay attention to brain activity which is the solution to The EEG devices in Fig. 3 are conventional EEG devices. In these devices, it is a long time to wear. The left one, it is right one needs about 30 minutes, re-spectively. On the other hand, in our EEG device, it takes 30 seconds to wear.This device is easy to wear and we can reduce of the number of electrodes. The contribution of our
Reduction of the number of electrodes Needless of gel for the wearing
Easily wearing by oneself every time and everywhere
Conventional EEG device.
The Principle of the proposed method2.3.Investigation of
International Journal of Intelligent Information Systems 2013, 2(1) : 19-25 21
problem point.
2.4.Pre-processing for the Noise, Data Mining, andPat-tern Recognition
The method is FA [12], ICA, PCA, Multiple-regression, and so on. Then, the data which is analyzed by pre-processing, the stochastic method such as Incremental PCA, FLDA, SPCA, AMUSE, SFLDA is used for data mining. Then, pattern recognition method is applied for the system we want. In these flow(Fig. 4), which methods we use is determined by the GA.
3. Experiment 1
3.1. Estimation System for Human-Interest Degree
In this section, we explain the estimation system for hu-man-interest degree in detail. First, we show the system summary. Then, we describe the method of constructing our system. In particular, we explain the method of EEG mea-surement and feature extraction, an EEG clustering, and a multiple regression analysis.
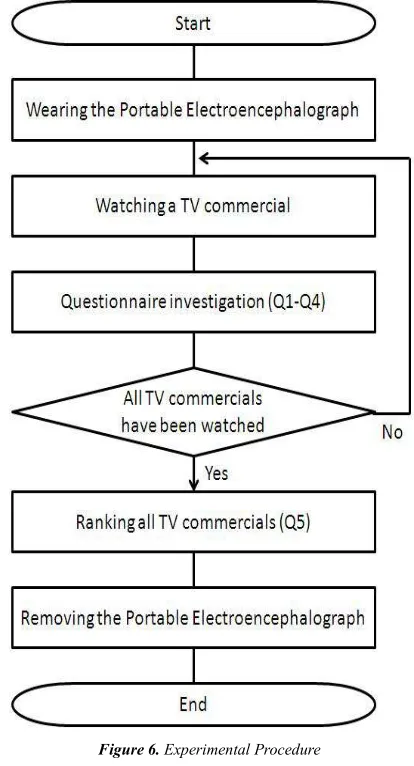
Fig. 5shows the overview of estimation system for man-interest degree. Our system estimates the hu-man-interest degree while watching TV commercials se-quentially.First of all, weacquire the EEG data while watching TV commercials using the simple electroence-phalograph. Moreover, we apply the EEG data to our system. After that, we get the sequential estimation result for hu-man-interest degree.
Figure5. The Procedure of the proposed method.
4. Construction of Estimation system for
Human-Interest Degree
First of all, we show about the EEG features and the questionnaire. Then, we classify the subjects by the EEG feature using a cluster analysis because we consider the individual characteristic of the EEG [13]. We explain the
cluster analysis. Finally, in order to estimate the hu-man-interest degree, we apply the EEG features andthe result ofquestionnaire to a multiple regression analysis. We show the multiple regression analysis.
Questionnaire The questionnaire shows human's
emo-tion or cerebraemo-tion by linguistic expression. Moreover, this is called subjective assessment. In this experiment, the subjects evaluate the human-interest degree for each TV commercial on a scale of zero to ten. We use this degree when we anal-ysis the human-interest.
EEG features The EEG features are the EEG data of amplitude spectra of 4-22Hz. In this experiment, we suppose that the EEG features show the change of human's emotion or cerebration while watching TV commercials. In addition, when we construct the system, we use the time average of the spectrum while watching TV commercials.
Cluster Analysis The cluster analysis is used for clus-tering the subjects using the individual characteristic of EEG. In particular, we apply the hierarchical algorithm. We begin with each data and proceed to divide it into successively smaller clusters. Moreover, the distance function is impor-tant factor for classification. There are some distance func-tions however we adopt the Euclidean distance because this distance is most common method. In this paper, we classify into the subjects depending on the EEG features by the cluster analysis. Furthermore, we decide the effective cluster number by investigation the relationship between the num-ber of data and the numnum-ber of variable (EEG features)[14].
Multiple Regression Analysis We use the multiple re-gression analysis to quantitatively evaluate the degree of human-interest. The multiple regression analysis is one of the multivariate analysis to have been constructed the esti-mation model from a set of training data. The multiple re-gression equation as estimation model is constructed by using some explanatory variables and an objective varia-ble.In this paper, we apply the EEG features as the expla-natory variables and the result of questionnaire as the ob-jective variable. That is, we estimate the result of question-naire using the EEG features.
5. Experiment of Watching
TVCom-mercials
TABLE 2 is used for the questionnaires in this experiment.
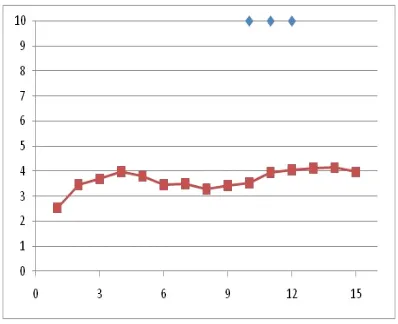
Figure 6. Experimental Procedure
Table 1. Experimental Condition and Data
Condition and Data
Number of subjects 54
male: 28, female: 26
20’s: 23, 30’s: 23, 40’s: 5, 50’s: 3
Object of watch 10 kinds of TV commercials(Japanese)
Watching time 15 seconds each TV commercial
Order of watch in random order
Experimental period 25-27th, August, 2010
Table 2. The Questionnaire Items
Number Questions
Q1 How do you rate your interest degree for the TV commercial on a scale of 0 to 10?
Q2 Which scenes are you interested in? (Choose some scenes from the pictures)
Q3 How many times have you seen the TV commercial? (Choose i. 0, ii. 1-3, iii. 4- )
Q4
How many times have you use/touch the products/services?
(Choose i. 0, ii. 1-3, iii. 4- )
Q5 Rank TV commercials
in descending order of human-interest degree.
5.1. Simulations
We explain the results of simulations for evaluation of our system. We conducted two kinds of simulations in order to discuss the effectiveness of our system. The first is the es-timation of human-interest degree for each TV commercial. The second is the sequential estimation of human-interest degree for TV commercials. We describe the each result.We verify the effectiveness and generalization of the estimation system, particularly about the subject clustering with the EEG features. In order to evaluate our system, we define
accuracyrate[%] as follows:
100
[%] = ×
TOTAL CORRECT rate
accuracy (1)
We use the most high-scoring and the most low-scoring TV commercials by the questionnaire(Q2) to calculate ac-curacy rate[%]. Then, we define the human-interest degree which is estimated using the EEG by A and the score of questionnaires by B. We determine the situation which the higher TV commercial of A matches higher one of B by CORRECT. In addition, TOTAL indicates the number of all data.
Table 3. The Number of Cluster and Accuracy Rate
Number of Cluster Accuracy Rate[%]
1 74.1
2 79.6
3 74.1
International Journal of Intelligent Information Systems 2013, 2(1) : 19-25 23
Incidentally, Table3 shows the relationship between the number of subject cluster and the accuracies of ranking of 2 TV commercials by proposed system.According to Table 3, we find that 2 clusters is the highest accuracy rate. In con-trast, we considered that more number of clusters was higher accuracy rate because the number of data and variance of datawere smaller. However, in this simulation, we regard that we classify the subjects to 2 clusters because accuracy rate is not proportional to the number of cluster. Furthermore, we show the effectiveness of estimation of human-interest degree for each TV commercial by the result of accuracy rate 79.6%.
4.2. Sequential Estimation of Human-Interest Degree for TV Commercials
We attempt to estimate the human-interest degree for TV commercials sequentially. In previous section, we show the effectiveness of our estimation system. Accordingly, in order to estimate human-interest degree sequentially, we use that system. When we measure the EEG using the simple electroencephalograph, the EEG signals of 1 second are transformed into frequency components. For this reason, we estimate the human-interest degree for TV commercials every1 second. However, we apply moving average to the EEG features because we need consideration perception time, remainder time, and measuring error. Fig. 7. shows the example of sequential estimation. Based on the graph of Fig. 7. (a) or (c), we confirm an upward tendency around the interest scene from the questionnaire. Moreover, there are some subjects which the estimation results have a few ups and downs, (see Fig. 7. (b)). Furthermore, according to the graph of Fig. 7. (d), there are a lot of scenes which the sub-ject are interested in by the questionnaire. On the other hand, human-interest degree by the estimating system has a lot of ups and downs. According to these results, we consider that we show the fluctuation of human-interest degree which we cannot understand human-interest by the questionnaire. Furthermore, we found the personal difference of the ques-tionnaire.
(a) Subject1/CM7
(b) Subject13/CM1
(c) Subject34/CM4
(d) Subject43/CM8
Figure 7. Results by the Proposed System.
4.3. Visualization of the Mind Status using the EEG
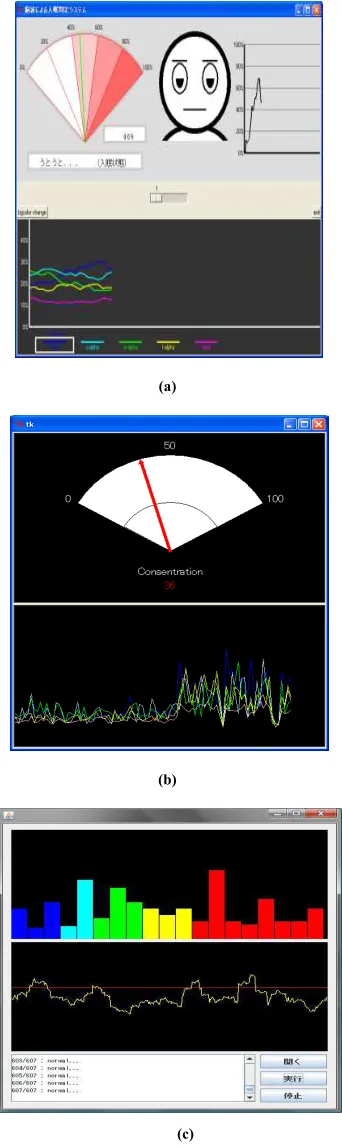
Hz indicate the dislikeable. In the olfactory sense,favorite indicate in the combination of the 4 and 7Hz, dislikeable put in an appearance at 9 and 14 Hz and so on. Furthermore, the dozing is related by the 5,6,9, and 16 Hz. In these ways, we lead various preference measurement systems(Fig. 8.).
(a)
(b)
(c)
Figure 8. (a) Dozing detection system (b) Concentration degree detection system (c) Stress visualization.
6. Conclusions
In this study, we proposed the new preference measure-ment systems for five senses by using the EEG detection device which is constructed by our laboratory. In our system, the importance of frequencies and these combinations are obtained. Moreover we structured the application for these evaluations in the ubiquitous environment.
This paper shows the feasibility of our device. Addition-ally, further investigations are to be required with respect to a signal noise ratio and repeatability of the emotional esti-mation.
References
[1] K. Nagamine, A. Nozawa, and H. Ide, “Evaluation of emo-tions by nasal skin temperature on auditory stimulus and ol-factory stimulus”, IEEJ Trans. EIS, Vol. 124, No. 9, pp. 1914-1915 (2004).
[2] J. Han, and A. Uchiyama, “The measurement and analysis on the effect of olfactory stimulus on the human body”, IEE Japan, Vol. 122-C, No. 9, pp. 1616-1623 (2002).
[3] D., M. W. Bos, L. F. Nordgren, and R. B. van Baaren: “On Making the Right Choice: The Delibe-ra-tion-Without-Attention Effect”, Science, Vol. 311, No. 5763, pp. 1005-1007 (2006).
[4] K. Takahashi, “Remarks on Emotion Recognition using Brain-Body Actuated System –Emotion classification using support vector machines”, Prof. of Japan Mechanic Sym-po-sium, pp.02-10 (2002).
[5] H. Tagaito, “An Evaluation of User Interface with Emo-tions”, UNISYS TECHNOLOGY REVIEW, No.64, pp.103-114 (2000).
[6] S. Ota, S. Ito, Y. Mitsukura, and M. Fukumi, “Proposal for the extraction method of personal comfort and preference by the EEG maps”, SICE-ICASE International Joint Confe-rence, pp. 604-607 (2006).
[7] M. Funada, M. Shibukawa, and S. Ninomija, “Objective measurement of event related potentials’ changes”, The Japanese Journal of Ergonomics, Vol. 38, pp. 538-539 (2002).
[8] S. Ayabe, “Nurtured odor preference”, J.Japan Associ-ation on Odor Environment, Vol. 35, No. 2, pp. 68-70 (2004) [9] R. Ohme, M. Matuskin, and T. Szczurko:
“Neuro-phy-siology uncovers secrets of TV commercials”, DER MARKT, Vol. 49, No. 3-4, pp. 133-142 (2010).
[10] G. Vecchiato, L. Astolfi, F. D. V. Fallani, F. Cincotti, D. Mattia, S. Salinari, R. Soranzo, and F. Babiloni: “Changes in Brain Activity During the Observation of TV Commercials by Using EEG, GSR and HR Measurements”, BRAIN TO-POGRAPHY, Vol. 23, No. 2, pp. 165-179 (2010). [11] S. Tasaki, T. Igarashi, N. Murayama, and H. Koga,
International Journal of Intelligent Information Systems 2013, 2(1) : 19-25 25
[12] S. Shiba, Factor Analysis Method, University of Tokyo Press, (1976).
[13] S.Ito, Y. Mitsukura, M. Fukumi, and N. Akamatsu, “Propos-al of the EEG an“Propos-alysis method using the individu“Propos-al charac-teristic of the EEG”, T.IEE Japan, Vol. 124-C, No. 64,
pp.1259-1266 (2004).