INTRODUCTION
The analysis of infrared spectrum of chemical compounds, either in solid, liquid form or even by reflection from a surface specimen is being done with the interferometric Fourier Transform spectrometer. The absorption peaks in the spectrum over the 400 cm-1 to 5000 cm-1 region of Infra red provides a set of peaks, which are the effects of absorption by the non-linear oscillators of the chemical groups in their environment of other atoms and groups. By using other spectral transforms currently developed and in use in signal processing areas, such as the Wavelets of various kinds, the IR spectrum could give enhanced details and also lends itself to computer based automatic decisive identification of chemical groups.
In the F.T.I.R. spectrometer, the signal from the detector is obtained directly as a spectrum in the audio frequency range, being translated from the IR range through interferometric frequency translation. The spectrum is obtained from the detector output directly, with the frequency axis correlated with the movement of the mirror. To try the methods of wavelet transform based spectrum, it is first necessary to re-convert this data in the frequency domain into the time domain. The FTIR
Infra red spectroscopy using wavelets
S. ANANTHI¹, V. VIDYA DEVI² and K. PADMANABHAN²
¹Instrumentation Department, University of Madras, Chennai - 600 025 (India). ²AC. Tech. Com., University of Madras, Chennai - 600 025 (India).
(Received: May 15, 2007; Accepted: September 08, 2007) ABSTRACT
In this paper, IR spectroscopy which uses the Fourier transform is dealt with using Wavelet Transform. Data from FTIR instrument is re-analysed using MATLAB programs prepared for this purpose. Analysis of peaks of carbonyls, OH groups etc using such wavelet transform reconstruction indicates additional remarks and a better elucidation of chemical structures. The principles, the method are fully illustrated with typical chemicals.
Key words: Inrared spectroscopy, Fourier transformation, wavelets.
instrument does not have provision to record the direct interferogram obtained because it gives only the spectrum after taking an F.T. We need the interferogram signal directly for doing wavelet analysis. Hence, after digitizing the FT IR records, the same is inverse Fourier transformed. This gives the time domain signal corresponding to the signal frequencies (of absorption) in the I.R. band.
wavelet coefficients might provide a computer comparison technique for the diagnostic inference of the chemical group.
This has such applications where a quick automatic inference is needed. Thus, IR spectrometry, when used for study of reaction progress, needs a quick and decisive assessment of molecular groups. The wavelet coefficient obtained for an alkene shows it more conspicuously than by reading its graphical spectrum.
With the proper choice of wavelets, it has been possible to perform the analysis to yield better identifiable values for most of the chemical groups. Present FTIR inferernces
The F.T. spectrum determines the presence or absence of peaks in certain spectral regions to identify molecular groups, such as C=O between 1680 cm-1 and 1800 cm-1. The synthesis of a natural product involves taking its F.T. I.R. spectrum; comparison with the natural product is taken to be successful synthesis. The fingerprint region of 1250 to 500 cm-1 is alone considered to provide the comparison in a fairly unique way, but the other regions, such as the hydrogen stretch (3600-2500 cm-1) or double bond (1900-1550cm-1) are not considered unique, because of possible higher
harmonic or overtone effects, as noted. The fingerprint region of the spectrum is generally very rich in detail, with many bands appearing. These bands represent combination frequencies. A 50 cm -1 change in the band’s prominent wavenumber indicates a different structure: 1200 for Benzene -O, 1150 for -C-O, 1100 for –CH-O, 1050 for –CH2-O and 960 for = C-H and so on. Hence, the present method suggests the structural assignments in this region as tentative and are to be taken merely as corroborative evidence in conjunction with assignments of bands at higher frequencies. Ft ir spectral analysis -observations relating to wavelet based analysis
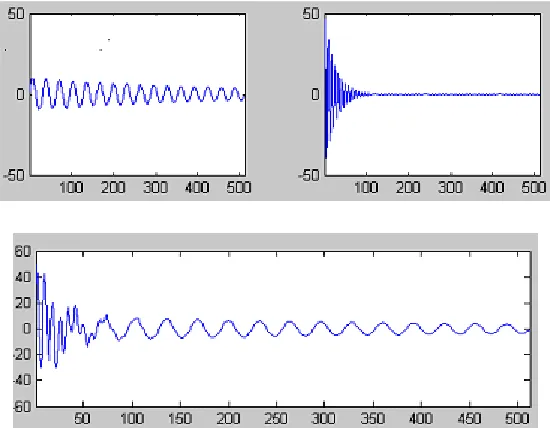
Suppose two molecular groups are taken which have different frequencies of vibration and let one of them be of larger amplitude than the other. It is usual to suppose that a heavier group oscillates with large quick dying oscillations than the other lighter group which oscillates with lesser amplitude and decays much more slowly.
a1(t)= 10 Sin (2π.16t) exp(-.002t) ...(2.2.1) a2(t)= 50 Sin(2π.32t).exp(-.04t) ...(2.2.2)
The two oscillations shown separately below (Fig.1).
The Fourier Spectrum of this signal shown below has the notion that we have two signals, of which the lower frequency one has a higher amplitude and the higher frequency one of lesser amplitude. It is also seen as a broad peak, indicating that it is a decaying oscillation.
How does the FFT store the information as to which signal – lower frequency one or the higher frequency one – come first?
It does so by its shape of the peak. The more broad peak means that it is the signal that came later in time.
Thus, it should be clear how the breadth of a peak in the FT IR spectrum could be informing us about the time course of the oscillations of the groups.
But, this fact is much more easily shown in the time course of the Wavelet spectrum.
Fig. 2: The Fourier spectrum of the above two component oscillation. Incorrect indication of the higher frequency signal having less peak amplitude than the lower frequency oscillation.
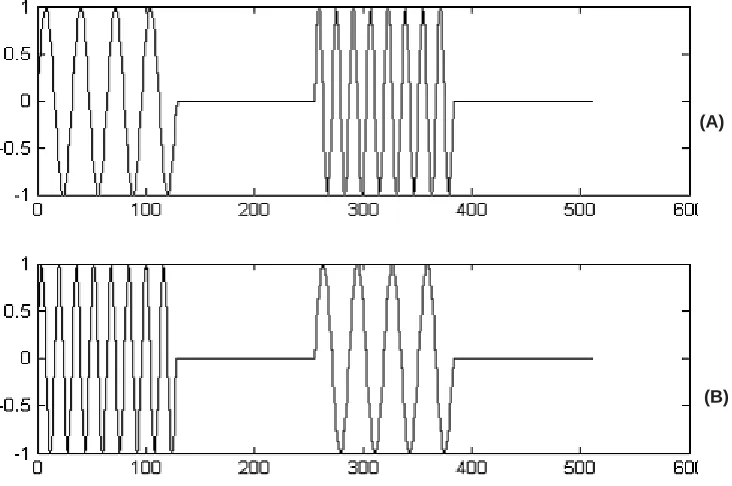
3.1: The time course of a signal in Fourier and Wavelet Spectra
(A)
Fig. 3: (a). First the low frequency comes, then comes the double frequency signal (b). First the high frequency signal comes, then comes the lower frequency
signal in the bottom.
Unlike Fourier Transform (F.T.) which gives a simple graph for all time, wavelet spectrogram gives details at different times and by time localization, we can elucidates chemical group oscillations very easily.
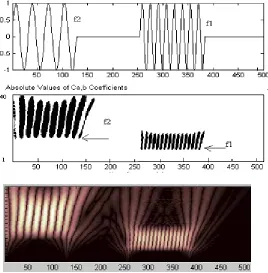
Taking the FT.IR spectrum of a chemical, hepatonic acid. This is a spectrum noted by its combinations of several peaks, some sharp, some broad and also with peaks within a broad band.
Let us separate the two sets of peaks in it. The high frequency broad peak is the OH group. The broad nature of this is characteristic of all OH peaks for several chemicals, with variations of the broadness.
The second peak chosen is halfway through the spectrum and is a C-C peak which is somewhat narrow.
Fig. 6: FT IR spectrum plot of Hepatonic acid (plotted from 0 to 100 instead of usual 100 to 0 as in Chemistry literature).. Below: The time signal for this (Inteferogram signal time course). Fig. 5: Shows the Wavelet plot of the same. The spreading of the spectrum is of course there,
Let us plot the time signals of the above two peaks by taking the absolute value of the inverse F.T. and plot them one below the other.
From the figure, the narrow peak has more dwell time in the signal than the broad one. So, during the time course of the machine’s interferogram signal, these signals from OH peaks will die down sooner; Among the several chemicals, the time will vary depending upon the molecular groups’ environment.
Wavelet transfor m can provide this additional information in its time axis. Of course, the choice of the wavelet is also critical. The oscillations which die down quickly are more nonlinear. The oscillations lasting longer are more linear.
In the following section on analysis of chemicals using the methods, these are illustrated with typical chemicals and groups to some extent.
Some results of wavelet analysis of I.R. Spectra of chemicals
Carbonyl spectra with wavelets
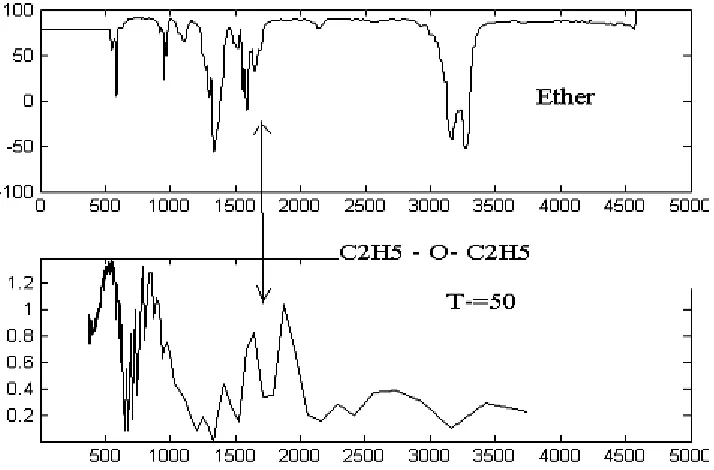
Carbonyl peaks are very important for many an application. They are used to find oxidized areas in pipe lines. They are used to locate regions of oxidation in any kind of surface by reflectance FTIR. The identification of the group is difficult when the carbonyls are in mixed form. The IR -WAVELET spectra show the details much better. Consider the IR spectrum of ether, for example. The FTIR spectrum appears as shown. The spectrum of Ether at different time slots show varying oscillations of the C=O groups. These are indicated by just two peaks in the Fourier Transform plot. These two are actually similar ones and the difference in their height shown by the conventional (top fig.8a) spectrum is not a true one. The wavelet spectrum might show the differences better when we observe the spectral plot at different
Fig. 7: a) a selected narrow peak from the spectrum of Hepatonic acid. The x axis shows samples of frequency.
b) The time signal (interferogram signal part) for the above, x axis is sample points number
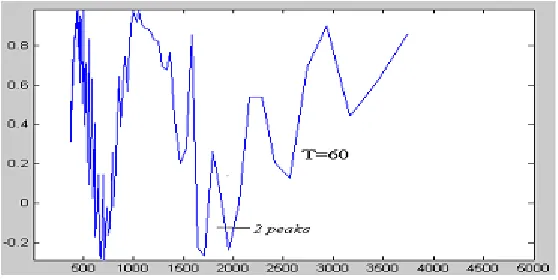
Fig. 9: Wavelet frequency plot at time slot t = 60. The C-O peaks are twin. The original FTIR spectrum showed them as two unequal peaks in the FTIR. instants of the interferogram signal. At t=50 and
also at t=60, the two peaks of equal height are noticed at this frequency range in the Wavelet spectrum shown in Fig.9 and 10. As noted in fig.10a, there is an ambiguity in the first peak which is resolved by the fig.10b. This ambiguity is not to be expected in a symmetric oxygen position structure of diethyl ether.
Cyclohexanone
Consider another chemical, Cyclohexanone, having one Carbonyl C=O on the aromatic ring.
Here the main peak appears at the same position, but the two side peaks 1,2 are indicating the oscillations with the neighboring Carbon atoms, adjacent to the top carbon.
Consider the comparison of Acetone with 2-butanone.
For Butanone we see clear four peaks in the carbonyl group, as would be expected due to the number of C atoms oscillating with O
Fig. 10: But the peaks are better resolved and surely there are only two peaks. The ambiguity of the first peak A is eliminated.
Fig. 11: Wavelet spectrum taken at sample time t=60, for Cyclohexanone.
Fig. 13: The original FT IR Record of 2-butanone.
Fig. 14: Butanone shows 4 peaks for the carbonyl region in CWT spectrum
Another chemical with C=O group
When comparing carbonyls, the Wavelet
3D spectrum enables a better comparison since it possesses much more detail.
Shows the carbonyl peak -- C = O
in 1700-1800 cm-1
The Centre peak has fine minor oscillations, due to interactions with the further carbon atoms, indicating the compound as Benzoyl.
Fig. 17. 3D Wavelet scalogram. (Benzoyl Chloride). Carbonyl peak in
Benzoyl chloride as seen in FT IR spectrum
Wavelet spectrum extract for the same peak
OH Peaks as observed on the CWT IR Spectra – Comparative observation with FTIR
Many organic compounds, alcohols, phenols, acids etc., provide a broad looking OH Region at the high frequency end of the spectrum between 2400 to 3600 cm-1 and even more occasionally. A mere look of peaks in this region might not be a decisive clue of the presence of OH
group however. This region is supposed to be the frequency of O-H stretching vibrations, modified in the presence of other groups present in the chemical.
A typical illustration for one such chemical with the OH group is given as an introduction to this comparative analysis, as below.
Fig. 18: A typical wavelet peak for a compound with an OH group. The minor dents in the Fourier spectral peak (shown below) appear magnified in the CWT extracted spectral region.
Benzyl alcohol example using wavelets Let us start the comparative study with some typical IR spectra and compare the wavelet spectral plots with the same.
To begin with, as already stated earlier, the Wavelet spectrum is not a single spectrum but a three dimensional matrix, giving the information at various instants of the interferogram time scale. For eg., if the interferogram has a 1000 points of sampled data in time, we will get, for each one of the 1000 points, a spectrum ! At every instant, the
peak positions in the spectrum will vary very much. In this chemical, for instance, the benzene group, the CH2.
Group and the OH group will all have vibrational modes of frequencies, but during the entire period of the 1000 time points, we may not have all these in full swing. Some might not stay long enough for the 1000 points; in fact most do not stay more than a hundred time points, particularly the OH ones.
Therefore, one has to observe the 3D spectral plot and pick the region of time at which the informative peaks are decisive and separate and then plot the spectrum at that time point. That will vary from one time point to the next.
Here, with wavelet spectra, we thus have a fund of information; it is our problem to choose the regions judiciously for making the interpretation in a better way, combined the plain FT spectrum.
The OH peak of this Benzyl alcohol shows the broad peak over the entire region of 3600- 2600 cm-1. Note that the annotated version of this FT spectrum ( Fig.19) marks the region with legends A,B and C.
A is marked at the peak point of the OH peak at 3330 cm-1. On the side slope, the two small peaks are shown as B and C. B is marked as a C-H stretch occurring at 3100cm-1 due to the aromatic (sic) CH groups. C is noted as the CH2 group’s C-H stretch at 2900cm-1 or near about values.
In the selected CWT spectral plot, shown below, these two are eliminated. Our observation is as follows. The B peak region is actually a higher overtone of the peak shown in region G, between 1000 and 1100 cm-1. A comparative look of the two peaks shown in the original FT IR annotated plot is able to reveal the identity of the two peaks G and B. The two frequencies are just third harmonics. Similarly, the peak C and the peak E at 1450 are harmonics. Here they are second harmonics in Fig. 20. Giving the 3D spectral plot of the entire
wavelet data of this chemical, for e.g.
C.(2900). The E peak is the C=C ring stretch; the G peak is the C-O stretch; thus, the G has a higher frequency component appearing exactly in the same streaky pattern as shown at C. In this case, it is the third harmonic. The C=C ring is rich is second and C-O is third harmonics.
In the wavelet spectrum, the harmonics are brought into the wavelet all at once; they do not separate as in Fourier Spectrum. So, the plot shows no such satellite peaky wriggles on the side slope of the OH broad peak.
Fig. 21. Biorthonal wavelet plot of the OH peak region of Benzyl Alcohol. Comparing with the annotated FT plot, the harmonic peaks B,C are
absent.
The figure below (Fig.2.5.4) shows the biorthogonal wavelet plot which does it this way.
The other wavelets examined for this chemical are also noteworthy.
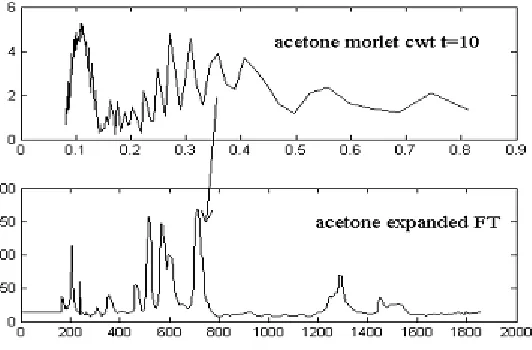
Here the top one shows the FTIR spectrum. The mid one is the wavelet (morlet) scale plot. The OH peak come first left. This time the other peaks do not show well. For them, another time slot should be chosen.
Fig. 23:
Fig. 25: Coiflet wavelet-Benzyl Alcohol-OH peak. Fig. 24: Morlet Wavelet OH Peak Benzyl
The bottom cur ve is the expanded frequency versus amplitude OH peak alone
This is the coiflet wavelet OH Peak region, picked at a certain time point when the variations were noted. These variations get smoothed out at the subsequent time points. Coiflets are short support wavelets and hence they could show variations better. The peaks are likely indicators of the O-H with couplings to the eight hydrogen atoms other than in OH.
Methanol and ethanol-oh peaks
The figure below shows the spectra in F.T. of Ethanol and even in Methonol we have two peaks, CH3CH2OH and CH3OH.
The OH region is over 2800 to 4000, in both there are two peaks noted, with some minor changes.
Let us see if there is any additional
information available from Wavelet spectrum taken for the entire data of the interferograms of these chemicals and pick out the wavelength region for the OH to show them separately.
It is noted that the wavelet smoothes out the oscillations which are seen in the F.T. spectrum due to overtones of lower frequency oscillations.
Thus, the morlet wavelet, which is the best smoother, shows just a broad peak.
The bi-orthogonal wavelet shows three peaks. The Coiflet has reduced amplitude and shows two peaks the first one smaller and second one larger.
Let us compare these with those of Ethanol.
Ethanol
The biorthogonal wavelet clearly shows the first peak as of higher amplitude than the second,
(a)
(b)
Fig. 28: Showing three wavelet peaks in the OH region for Ethanol.
Fig. 29:
OH
Fig.32: 2,4,4, Trimethyl -1-Pentalnol. A. The O-H stretch, intermolecular hydrogen bonding 3335cm-1 , B. C B. C-H stretch . C. The C-H bond. The C-O stretch 1040cm-1.
Fig. 33: (a) to (d) Show the Wavelet spectral regional plot of the OH region For 2,4,4 trimethyl-1 pentanol a) Biorthogonal wavelet b) Coiflet wavelet c) Meyer Wavelet d) Morlet wavelet. which is otherwise for methanol. The F.T. spectra
also showed the ethanol as having a greater first peak than methanol. Thus, the biorthogonal wavelet includes this information in it.
However, the Morlet and Meyer wavelets smooth out the two peaks into one.
The position of the peak is altered however between Morlet and Meyer. The Meyer shows a lesser value.
The information about the CH2 group present in ethanol could not be brought out by the mere OH peak spectral region.
Phenol
The Coiflet and biorth wavelet clearly indicate 2 peaks in the region which is just shown as a broad peak in the F.T.
The Meyer and Morlet which are smoothing wavelets show but one broad peak very much as in the F.T. spectrum.
What are these two peaks indicative? Even when we look sharply into the figure of the F.T. spectrum, we notice a small dent around 3400 in it, indicating a second peak slightly showing itself. Thus, the wavelets bring out this detail as relevantly belonging to this wavelength group. If it was but a harmonic image of a lower frequency vibration, it would not certainly appear in the Biorth. Wavelet.
So, there must be two peaks for Phenol in its OH, which must be due to the nearby carbon atoms of the ring.
Trimethyl –1 pentanol
From the above plots, the two peaks noticed in the FT IR spectrum as annotated as the OH stretch and the C-H stretch peaks (centered in the FT spectrum at 3330 & 2900 cm-1) are separately noticed in the first two wavelet plots, but certainly not in the second two.
nature. The second one should relate to O-H; the first one to C-H.
On the other hand, the Coiflet plot, which is supposed to be more compact in its frequency bandwidth, shows the earlier C-H stretch peak as more peaky (much as in the FT spectrum) and the second O-H peak as a broader one. (The wavelet plots are just given with limited resolution calculations and hence curvy peaks are rather shown as trapezium like).
Both these plots were taken at a time span point of around t=15; at points beyond 15, the peak patterns really alter.
The Biorth shows the first one as broader, which means that the OH peak is short lived, as per our observations noted earlier in this chapter. The second one is peaky and hence lasts longer. The Biorth is thus similar in its indication of any peak, much as the F.T.
On the other hand, the Coiflets are not that time conscious, they are more frequency conscious. That fact is clear from the short bandwidth support which Coiflets offer. (If you have a sharp frequency bandwidth, you cannot have a sharp time width).
Thus, Coiflets do not follow the F.T. in indicating the time course of a signal’s frequency content. So, they are true to the frequency amplitude. Thus, we can notice the same ratio of
peak heights between the C-H and O-H as in the F.T. in it.
Thus, the principle is now understood. If you look at the Coiflet, it is able to give whatever peaks are there true to their amplitudes in their respective positions, and of course harmonic component peaks are eliminated (unlike in F.T.).
If you look at the biorth wavelet, they indicate the time course of the vibrations through a broad peak indicating a shorter time constant than a peaky one. Thus, all we learn from the biorth is that the two peaks are indicative of two different molecular group vibrations surely, and that the O-H is short time constant and the C-H a longer one.
How about the standard Meyer wavelet?
Fig.34
And how about the crude Morlet wavelet?
These show only a single peak. The Meyer shows the peak point shifted towards right compared to the Morlet.
A clue is available by a look at the F.T spectrum, the annotated version for this chemical 2,2,4 Trimethyl –1 pentanol.
(a)
(b)
(c) CH3( CH2)5 C=O OH Morlet Wavelet at a time initially noted (t=5).
(d) OH Peak
has two streaks at 1380 and 1480. Now compare these with the streaks of the peak at “B” , 2800 and 2900.
They look similar in their structure. (The Fourier spectrum is a high resolution one !)
The amplitudes are different but shapes are alike.
That could be just second har monic component of the first group. Thus if B and C are said to be harmonically related, as per our Wavelet policy, they would appear at one place only (the lower frequency region nominally marked for the C-H bend and not the C-C-H stretch). C-Hence, perhaps they are not noticed in the smoothing wavelet spectra of Meyer and Morlet. This is the possible explanation for the absence of the C-H peak’s part in these plots. To summarise the above inference on this TMP chemical, it is noted that the Coiflet gives the
peaks separately and so there are two different vibrating groups; the biorth gives the first broader and hence the O-H has a short lived vibration. The Smooth wavelets tell that after the C-H is one vibrating group and you need not have it shown in the harmonic region and so they suppress the same. A carboxylic Acid – The Hepatonic Acid with many CH groups , a carbonyl and an OH.
The annotated version of the F.T. spectrum shows the broader peak around 2500-3300 cm-1 comprising also the C-H stetch at one or more frequencies superimposed on the O-H. That this chemical possesses a CH group (one or more) is what all one can infer from this F.T. Is it enough? One has to use the NMR spectrum to show up the several peaks for the combination of CH groups which this chemical possesses.
If wavelet spectra are really useful, they should throw more light on this fact
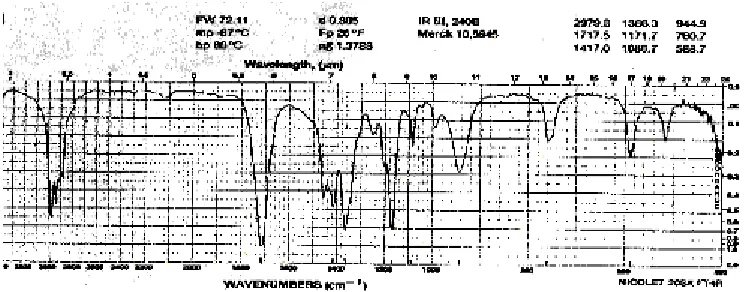
Fig. 35: (top) Benzyl Alcohol infra red spectrum. The same was reconverted into an interferogram and analysed by the author. Van der Pol wavelet
Carboxylic acid dimmers display very broad band intense O-H stretching absorption in the region 2500 –3300 cm-1. The band centers around 3000 cm-1. The C-H stretching vibrations noted normally in this region are supposedly superposed here. On the lower edge of the broad peak, fine structure represents only overtones of fundamental oscillators are lower frequencies.
We note as much as six or seven peaks in the broad peak in the Biorth. Wavelet plot.
The Coiflet plot shows three peaks somewhat broader than in the biorth. plot.
Though the Morlet plot shows only a single broad peak, we tried out the oscillations present at very small time slots and noted that there are peaks in the plot. The extract plot of such a Morlet wavelet is shown in (d) above.
The Meyer plot fig 34.e also shows more peaks than two.
If the chemical had just single CH group (as in Methanol), the plots of wavelets would have shown only one such peak in the normal time course (5<t<25).
Because there are more peaks noted even in the smoothing wavelets, it is clear that the OH is associated with many other groups, which are not bound very much as in an aromatic. So, it suggests a carboxylic acid.
The Fourier spectrum merely indicated a broad peak and some middle peaks which are due to C_H stretching, they say. Three such peaks are noted at 2950,2932 and 2855.
The Wavelet plot of Meyer and Coiflet indicate them, though not at the same frequency locations. (Frequency locations get shifted in Wavelet spectra, as noted earlier. We have to compare side by side with the Fourier spectrum. Further, the Biorth. wavelet is superior in that it displays the peaks of the available CH components clearly, thereby indicating how many CH groups are present in the chemical.
If the wavelet plots, as noted earlier, did not include har monic components of lower frequency vibrations, then we should not get any such component in the broad peak. Hence, the peaks shown are relevant to that frequency region only. They are actually interactions of the free O-H hydrogen with the C-H groups.
They may be the C-H stretch oscillations at all. Still finer data points on the interferogram data which we used for our analysis is required to resolve this point.
Using new wavelets for identification of fine peak origins in FTIR
FT IR spectra in some chemical or other shows peaks which are fine, broad and more broad. We have seen that the O-H peaks are really broad among them. But certain intervening frequencies such as between 1200 –2000 sometimes show peaks which are narrow or mildly broad. To distinguish if they are not arising out of any harmonics, the wavelet transform based spectrum could be useful.
In this connection, the Van der Pol wavelet was used. The illustration below shows the FT IR spectrum of Benzyl alcohol for example. It has a fine stretch located at 1500 as per the F.T. spectrum, usually thought to be a C=C ring of the aromatic. This oscillation will show as broad in the Van der Pol spectrum if it were a sinusoidal vibration and not a coupled non-linear vibration.
That it is so is shown in the figure below.
The C-O shows the peaks as better separated. This means the oscillations of the single oxygen atom can occur with any nearest C and hence there is coupling which is brought out better Comparison of frequency peaks of interest
Substance 3050cm-1 1642cm-1 991cm-1
A 0.8573 0.5724 0.2899
B ,, ,, ,,
DWT gives several coefficients
APP.Coefficients L-1 Detailed Coefficients -1 Det.coef.2 Det.coef.3 Det.coef.4
3.1042 1.3202 2.1038 -17.0618 612.3067
-27.9162 -7.2669 -10.9082 423.4261 890.3726
404.8739 199.1420 289.4823 694.3633 -95.9220
-61.3340 360.2152 505.4596 -69.0244 -4.2689
17.4553 -34.6300 -49.0638 -3.5170 0.0000
0.7817 -1.8380 -2.5752 0.0000 8.4049
0.0000 0.0000 0.0000 5.6363 -48.3567
3.4559 -28.1546 833.1934
in the nonlinear wavelet picture.
The C-H and C-C bends which are shown too sharp in the Fourier Spectrum are brought out similarly but show less amplitude and the peaks are not sharp, but clearly indicative.
That means the bending oscillations are nonlinear. In this figure, the O-H peaks in the 3000-region are not brought out well. This wavelet is not suitable for the O-H group, though the oscillations are shown at the respective positions. There are two peaks only. That might be due to the H2=O combination and the -H combined with O. In this frequency region, more scales have to be chosen to give fine resolution. This picture was taken over a scale of 1 to 64 with 128 points. Thus, the rightmost spectral frequencies are not finely resolved. That is not our in purview presently.
Discrete wavelet decomposition for Interferograms
If the CWT gives spectral plots, the DWT is useful in computer based automatic comparisons of a large number of production samples. The DWT is a set of coefficients evaluated from the interferogram.
In the normal F.T. I.R., we would just compare the peaks of substances, say, A,B and C at several pin-pointed frequencies
Here we have just 3 values only for the comparison, which is not very reliable.
On the other hand, Wavelet decomposition provides quite many levels for a more precise comparison. Hence it is possible to develop software for automatic comparison of production line substances In all these, wavelet spectra show greater details.
Compound O-H
Alcohols 3200-3600 cm-1
Phenols 3200-3600
Carboxylic acids 2500-3000
Conclusion
With the choice of wavelets, it has been possible to perform the analysis to yield better identifiable values for the several chemical groups. The summarised advantages of the Wavelet spectrum method for infra red spectrometry are:
The peaks of –O-H stretching vibrations is separate for the different alcohols for easy identification.
The plane deformation bands are having unique positions.
Multiple carbonyls in a chemical are uniquely shown with better separation.
Thus automatic computer based group detection is possible, useful in the study of a reaction in progress
ACKNOWLEDGMENTS
The author acknowledges Dr. K. Padmanabhan, Emeritus Professor, Chemical Engineering Department for his valuable comments and editing as well as to Mrs.V.Vidya Devi for her interaction in preparing the graphic data. The author thanks Dr.Raghunathan, Professor of Organic Chemistry for providing necessary information.
REFERENCES
1. Francisco Jurado, Jose R. Saenz, “Comparison between discrete STFT and wavelets for the analysis of power quality events”, Elsevier publications, Electric power systems research, 183-190, (2002). 2. Padmanabhan, K., Ananthi, S., Vidya Devi,
V. and Hariprakash, R., “Wavelet transform infra-red spectrometry for more decisive group identification and automatic analysis”, Padmanabhan, K., et al, Proc. of the at the International conference on Chemical Engg and Biotechnology (Achema-2006) organized by DECHEMA Institute during 15th to 20th May
2006 at Frankfurt, Germany (2006)
3. Silverstein, Bassler and Morrill,” Spectrometric Identification of Organic Componds, 5th Edition, John Wiley & Sons Inc. Publications, Canada,(1998).
4. Douglas A. Skoog and James J. Leary” Principles of Instrumental Analysis”, IV Edition, Saunders College Publishing, (1992).