Published online February 11, 2015 (http://www.sciencepublishinggroup.com/j/ijrse) doi: 10.11648/j.ijrse.s.2014030601.12
Generalized deposition model of tiny solid particle
immersed in turbulent flow
Esam I. Jassim
Department of Mechanical Engineering, Prince Mohammad Bin Fahd University, Al-Khobar, Saudi Arabia, 31952
Email address:
To cite this article:
Esam I. Jassim. Generalized Deposition Model of Tiny Solid Particle Immersed in Turbulent Flow. International Journal of Sustainable and Green Energy. Special Issue: Renewable Energy and Its Environmental Impaction. Vol. 3, No. 6-1, 2014, pp. 7-14.
doi: 10.11648/j.ijrse.s.2014030601.12
Abstract:
Progress to the correlation of particle deposition velocity in turbulent pipe flow is presented. The developed modelaccounts for the Brownian diffusivity and inertia effects and is extended to cover the influence of the flow velocity by including Reynolds number in the correlation. The experimental data and previous proposed models are used in comparison of predicting particle deposition rate. It is shown that the new model of deposition velocity is in good agreement with the experimental data and numerical simulations. Further the aerodynamics has significant influence on the deposition rate and should be concerned when the process of particle migration and deposition is addressed. The deposition efficiency, the measurement tool of particle deposition rate in this work, increases with the increase of diameter for large particles, and with the decrease of diameter for submicron particles. Other factors addressed in this work are effects of particle to fluid density ratio, pipe diameter and the surface roughness. The results showed that increase in density ratio makes the deposition rate of submicron particles to increase too whereas no significant effects is noticed for large particles. Carrier pipe size is studied and the deposition rate curve shifts right with decreasing in pipe size. Finally, the deposition rate of particles is found to increase with increase in surface roughness.
Keywords:
Particle Deposition, Turbulent Flow, Brownian-Inertia Motion, Surface Roughness1. Introduction
Particle migration and deposition have taken a considerable attention due to its significance in numerous engineering applications ranging from aerosol air pollution to the microelectronics industry. Other applications including heat exchangers, health effects and chemical industries are of interest in such phenomena as well.
During past few decades, intensive researches have been conducted to describe the deposition phenomena of the particles in turbulent flow. Schwendiman and Postma (1961), Wells and Chamberlain (1969), Liu and Agarwal (1974), Friedlander and Johnston (1957), Sehmel (1968), and Ilori (1971) reported extensive experimental data for particle deposition rate in turbulent duct flows. Wood (1981), and Papavergos and Hedley (1984) have provided a reviews of the experimental results. In summary, the studied concluded that deposition velocity has a V-shaped variation with a minimum at the particle relaxation time of about 0.1 to 0.5 wall units (Chen et al., 1997). The rate of particle deposition increases as the relaxation time decreases in the diffusion
regime whereas it increases when the relaxation time increases in the impaction regime.
Theories of particle deposition process were also addressed by many researchers; Fuchs (1964), Wood (1981), Hidy (1984), Papavergos and Hedley (1984), and Hinds (1999). Semi-empirical correlations for evaluating particle deposition rates in turbulent ducts have been proposed by Friedlander and Johnston (1957), Davies (1966), and Cleaver and Yates (1975); however, the expressions are valid for smooth walls. Further progress in developing the deposition model was reported by Fichman et al. (1988), Fan and Ahmadi (1993, 1994), Chen and Ahmadi (1997), Shams et al. (2000), and Tian and Ahmadi (2007).
compared different computational models for predicting particle deposition in the turbulent duct flows.
Most earlier and recent works are confirmed that the deposition velocity has a V-shaped variation; however further studies are still needed to tune the correlation in such a shape that can be more consistence with the available experimental data. In this work, a step towards such tuning is presented through performing modification to the model of Fan and Ahmadi (1993) in order to enhance the prediction of the deposition rate. Comparison with experimental data and other recent empirical expressions is also reported. The particle diameter ranging from 1nm to 200 µm are studied. The effects of particle to flow density ratio, pipe size and roughness are also addressed. The deposition rates of particles of different sizes are evaluated and compared with other models.
It is shown that the trend of the proposed model is reasonable and in good agreement with the available experimental data. Further the model improves the prediction of particle deposition rate particularly in the Brownian regime since it considers the particle convection diffusion process instead of diffusion alone.
2. Particle Motion in Turbulent Flow
In an accelerating flow field, particles are not able to follow perfectly the direction of fluid motion due to their own mass. For instance, in straight-line accelerating (decelerating) motion, particles lag behind (fall ahead) the Lagrangian “fluid particles”. For sub-micron particles, and in the absence of external force fields, the Brownian or turbulent diffusion is the basic mechanisms that drive deposition. For particles larger than about 1 µm, deposition is primarily due to inertial impaction and gravitational settling.
In this section, the mechanism of the motion of particles suspended in a moving fluid is briefly discussed. The effects associated with the particles’ own inertia becomes manifested particularly in accelerating fluid motion. The mechanisms driving particle motion are synonymously called deposition mechanisms as the result of such phenomena is to make particles migrate to the bounded surfaces and deposit there.
Since the diameter of the particle is much smaller than the carrier pipe radius and its density is much greater than that of the gas flow, the particle equation of motion in the fully turbulent region can be reduced to an equation consisting only of the drag and gravitational forces (Crowe, 2006).
The general expression for the drag force FD on a spherical
particle in a gas of constant velocity can be written as:
c D g p g p g p D C C u u u u r
F ( )
2
1 2 − −
= π ρ (1)
Where, Cc is the Cunningham non-continuum correction
factor, defined as:
− + +
= λ λp
p c
d d
C 1 2.34 1.05exp 0.39 (2)
The drag coefficient can be estimated from the following formulas depending on the particle Reynolds number for:
p D
C
Re 24
= Rep<0.1 (3a)
(
)
+ + = p p p p DC ln2Re
160 Re 9 16 Re 3 1 Re 24 2
0.1<Rep<2 (3b)
[
1 0.15Re0.687]
) Re 24 ( p p D
C = + 2<Rep<500 (3c)
44 . 0
= D
C 500<Rep<2.105 (3d)
The terminal velocity of a spherical particle due to gravitational settling can be obtained from the following expression (Hinds, 1999):
g c p p s gC d u µ ρ 18 2
= (4)
The above formula is valid for any particle size since the slip correction has been taken into account and can strictly be used for the Stokes flow. However, the formula is quite accurate over the extended range 0.1 < Rep<1 (Hinds, 1999).
Note that the buoyancy effects have been neglected in the formula since the particle density is much more than gas density.
Methods to calculate us at higher particle Reynolds
numbers are given by Hinds (1999):
− = 1 3 4 f p c p D
s d gC
C u
ρ ρ
(5)
Where, CD is the drag coefficient estimated from the
piecewise expressions mentioned earlier (Eqs.3a-d).
3. The Deposition Velocity
Analogous to the settling velocity fro deposition by settling, the deposition velocity is the effective velocity with which particles migrate to a surface. The non-dimensional deposition velocity for particles released with undisturbed concentration is given by:
* u C G V av p d = + (6)
Where, Gp is the particle mass flux to the wall and Cav the particle average concentration above the surface. The latter is usually taken equal to the average concentration over the cross-section of the conduit (Crowe, 2006).
Numerous correlations for deposition velocity were presented based on experimental data. A simple expression for nondimensional deposition velocity proposed by Wells and Chamberlain (1967) is given as:
8 / 1 3 / 2
* 0.2 Re
However this correlation is valid only within submicron. For other regimes, the correction proposed by Friedlander and Johnstone (1957) is frequently used. The deposition velocity is calculated as follows:
(
)
[
]
{
}
− − + − + + + 2 73 . 13 ) 959 . 0 5 / /( 04 . 5 ln 5 2 / 1 2 / 6 . 50 ) /( 1525 2 / 1 2 / 2 f S f f S f f U V L L g d 5 5 30 30 + + + < ≤ ≤ < L L L S S S (8)where, f is the friction factor; and
2 2 2 18 2 / g g p p g L f U d S µ ρ ρ = + (9)
The nondimensional deposition velocity has plotted by combining the above piecewise expressions for different friction factor as shown in Fig (1). It could be concluded that the deposition velocity increases as the friction factor increases.
0 10 20 30
S+ L 0 0.004 0.008 0.012 0.016 Vd /U g
f = 0.02
f = 0.04
f = 0.06
Fig. (1). Deposition velocity vs. stop distance for various friction factors (Eqs.7 & 8)
Other empirical models are that suggested by Wood (1981) and Fan and Ahmadi (1993). The latter is modified in this study to account for flow configuration. The Wood nondimensional deposition velocity is given by:
+ + + − −
+= Sc + × + g
Vd 0.057 2/3 4.5 10 4τ 2 τ (10)
where Sc is the Schmidt number.
The nondimensional particle relaxation time and the gravitational sedimentation in horizontal flow are respectively given by:
2 * 2 * 18 2 2
ν
ρ
ρ
ν
τ
τ
f p pd u Ccu
= =
+ (11-a)
g u g 3 * ν = + (11-b)
The first term in Eq. (10) is resulted from the Brownian motion and eddy diffusion, and the second term is the consequences of particle deposition by the eddy diffusion-impaction mechanism, while the last term stands for the gravitational sedimentation on the lower wall of horizontal pipes (Chen and Ahmadi, 1997).
Fan and Ahmadi proposed an empirical correlation for deposition of particles including the effects of surface roughness and gravity. For horizontal ducts, the expression takes the form:
(
)
[
]
− + × + + = + + − − + + + − + + + 14 . 0 1 037 . 0 8 1 42 . 3 5 . 0 64 . 0 2 1 084 . 0 1 32 / ) 10 ( ) 1 /( 1 2 3 / 2 2 2 1 2 L e d k Sc V L p d τ τ τif Vd+ < 0.14 (12)
where
+ + =
p Sd L1 3.08;
f p S ρ ρ = ; ν * u d
dp+ = p (13)
and k+ is the surface roughness ( which is zero for smooth surface)
Eq.(12) consists two terms the first term represents the effect of the particle diffusion and is dominated when the particle is in the range of submicron while the second term stands for inertia effect. Literatures have demonstrated that the local particle deposition relays both on particle size and the actual aerodynamic conditions (Browne, 1973; Miguel et al, 2004; Sosnowski et al., 2007). Experimental results of Miguel et al (2004) showed that deposition efficiency is more sensitive to the Reynolds number. Browne (1973) studied analytically the influence of Reynolds number on the deposition velocity of particles. The results of his analysis showed that significant variation occurs to the particle deposition rate when the flow Reynolds number changes particularly for tiny particles. He also concluded that the variation becomes less as the particle size increases.
The most recent research accomplished by Sosnowski et al (2006) ended up with identical conclusion from their study on the mechanisms of aerosol particle deposition. They concluded that the deposition of submicron particles, caused primarily by Brownian diffusion, is strongly influenced by local aerodynamic effects. In turn, large particles are less sensitive to such variation due to their high inertia. Consequently, it is essential to investigate the significance of flow Reynolds number that was dropped from the Fan and Ahmadi empirical expression of particle deposition.
region because it takes into account the convective term of diffusion which emerges in the Reynolds number. Hence, a new expression combining Fan and Ahmadi and Wells and Chamberlain correlations is formed and to be studied in this work. The new correlation takes the form:
(
)
[
]
− +
×
+
+
=
+ + −
−
+ + + −
−
+
+ +
14 . 0
1 037 . 0 8
1
42 . 3
5 . 0 64 . 0
2 1 Re 2 . 0
1 32 / ) 10 (
) 1 /( 1 2 8
/ 1 3 / 2
2 2
1 2
L e
d k Sc
V
L p
d
τ
τ
τ
if Vd+ < 0.14 (14)
Eq.(14) is the expression adopted in this work and will be studied to assess its validity in predicting the rate of particle deposition.
4. The Deposition Rate
A basic quantity characterizing convective transport of a particle is the penetration ratio, or penetration fraction, defined as the fraction of the inflowing particles that exit the flow system. It can be written as:
0
C C
fp= out (15)
Where, Cout and C0 are the particle concentrations (either
mass or number) at the outlet and inlet, respectively.
For fully developed turbulent flow in a circular pipe of length L, the deposition velocity Vd may be considered as constant along the tube, and the penetration fraction can be express as (Crowe, 2006):
− =
D U
L V f
g d p
4
exp (16)
Where, Ug is the carrier gas velocity; D is the pipe
diameter.
Alternatively, Collection efficiency can be defined as the fraction of the inflowing particles that is lost by deposition:
− − = − =
D U
L V f
g d p
g
4 exp 1 1
η (17)
The above expression enables the calculation of penetration through knowledge of the deposition velocity.
5. Comparison of the Proposed Model
with Experimental Data and Other
Models
To appreciate the process of particle deposition predicted by current model, we compared the theoretical predictions of the model against some experimental data and semi-empirical correlations. Although experimental data for particle deposition from turbulent flows is relatively scarce,
there is however more data for deposition from aerosols applications. Hence, we do comparison here for particle deposition from turbulent gas streams.
The simulation results for particles deposition for turbulent air flow in a 40 mm diameter pipe with 1m length and Reynolds number of 5000 based on the pipe diameter are presented in this section. Air at 270 K with µ = 2.0 x 10⁻⁵ kg m s-1, and ρ = 1.23 kg m-3 is used in the analysis with the particle to air density ratio about 750. The mean free path (λ) appeared in Eq. (2) is 62 nm as was calculated by Maxwell (1868).
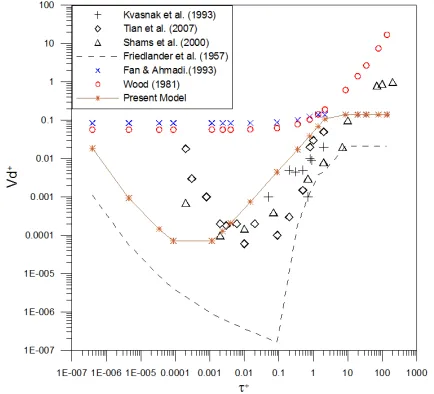
Figure (2) compares the suggested model with those of earlier studies for horizontal pipe. The experimental data of Kavasnak et al. (1993), the numerical simulation results of Tian et al. (2007) and Shams et al. (2000), and the empirical equations of Friedlander et al. (1957), Wood (1981) and Fan and Ahmadi (1993) are plotted in this figure. The experimental data and the simulation results show that the deposition velocities have a “V-shaped” variation. The empirical equation of Friedlander predicts similar trend however the discrepancy with the experimental and numerical results is significant. As well, the models of Wood (1981) and Fan and Ahmadi (1993) are almost constant for tiny particles. In turn, the suggested model gives better trend than Fan and Ahmadi curve and agrees well with the experimental and numerical results.
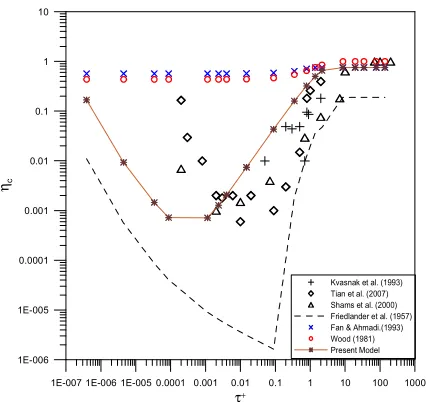
The modified model divides the process of deposition into three regions, the Brownian dominated region, the inertia dominated region, and the interface region. In the Brownian region, the deposition rate increases with decrease in particle size as illustrated in Fig. (3). For large particles, turbulence eddy impaction becomes significant and dominates the deposition process (Chen and Ahmadi, 1997). Hence, the deposition efficiency increases with particle size. Both motions are significant in the transition regions.
For very large particles, the particle inertia becomes very large and essentially not influenced by other forces since the particle deposition rate approaches constant. The tendency of such particles occurs at relaxation time τ+ >10 as shown in Fig. (3).
1E-007 1E-006 1E-005 0.0001 0.001 0.01 0.1 1 10 100 1000
τ+ 1E-006
1E-005 0.0001 0.001 0.01 0.1 1 10
ηc
Kvasnak et al. (1993) Tian et al. (2007) Shams et al. (2000) Friedlander et al. (1957) Fan & Ahmadi.(1993) Wood (1981) Present Model
Fig. (3). Comparison of deposition efficiency evaluated from current model with the earlier results in horizontal pipe.
6. Results and Discussion
In this section, influences of particle density, pipe size, and pipe roughness using the modified model are discussed. Comparison with previous literatures to assess the prediction of particle deposition in a turbulent pipe flow is provided as well.
6.1. Particle Density
The effect of particle to fluid density ratio is presented here. Density ratios of 1000 and 2000 are compared to figure out the behaviour of deposition rate responding to particle density.
Fig. (4). Particle deposition efficiency versus nondimensional particle relaxation time for different density ratio
Figure 4 shows the deposition efficiency as a function of
relaxation time for two density ratios. The deposition rate shifts slightly to left with the decrease of density ratio. This trend is in agreement with that predicted by Chen and Ahmadi (1997) and Fan and Ahmadi (1993).
6.2. Pipe Size
As stated earlier, pipe with 40 mm diameter has been used as the base case in the study. To demonstrate the influence of the pipe size on the rate of particle deposition, another pipe with diameter of 20 mm is selected. The flow Reynolds number is kept constant in this particular analysis while the air velocity is varied.
Figure (5) shows the deposition efficiency as a function of the nondimensional relaxation time for the two pipes. The deposition curve shifts to the right when the pipe size decreases. It implies that by reducing the size of the carrier pipe, the particle deposition rate increases in the diffusion region as a result of Brownian motion experienced by the particles. In contrast, the particle deposition process becomes less efficient for large particles due to high drag force; however, the drag force no longer affects the very large particles since the high inertia of such particles dominates the process of deposition.
1E-0071E-0061E-005 0.0001 0.001 0.01 0.1 1 10 100 1000 10000
τ+ 0.01
0.1 1 10 100
ηc
Dpipe 20 mm 40 mm
Fig. (5). Influence of pipe diameter on the particle deposition efficiency
earlier which assumed no change in Reynolds number has occurred.
1E-0071E-0061E-005 0.0001 0.001 0.01 0.1 1 10 100 1000 10000
τ+ 0.01
0.1 1 10 100
ηc
20mm (Fan&Ahmadi) 20mm (Present) 40mm (Fan&Ahmadi) 40mm (Present)
Fig. (6). Comparison of deposition efficiency predicted by current model and Fan and Ahmadi model for different pipe diameters
Consequently, the influence of the carrier gas velocity should be taken into account if we want to describe the process of deposition precisely. The modified model considered such effect by involving the velocity of the carrier fluid in the formula as listed in Eq. (14). The influence of the air velocity appears in the continuum region through the variation occurs in the drag force while its effectiveness descends in the diffusion region since in this region particles migration is controlled by diffusion.
6.3. Surface Roughness
1E-007 1E-006 1E-005 0.0001 0.001 0.01 0.1 1 10 100 1000
τ+ 1E-005
0.0001 0.001 0.01 0.1 1
Vd
+
k/D=0 k/D=0.001 k/D=0.01
Fig. (7). Deposition velocity as a function of relaxation time at various surface roughnesses
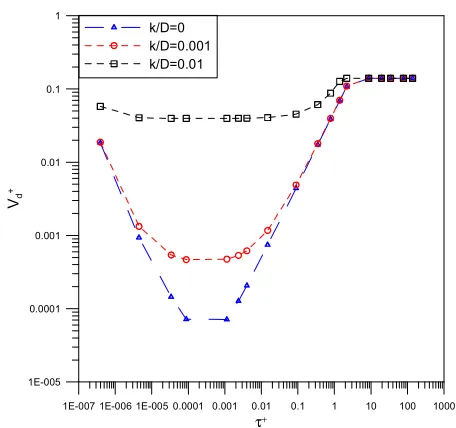
The purpose of this section is to present the influence of the surface roughness on particle deposition process.
Different average surface roughness heights are studied ranging from smooth surface (k=0) to relatively coarse surface (k~1% of pipe diameter). It is noticed that surface roughness significantly alters the deposition velocity curve particularly in the range of interface region. However, the range becomes vast for coarse roughness, as shown in Fig. (7).
Browne (1973) came up with almost congruent conclusion. He studied the deposition velocity for particles ranging from 0.01 to 10 µm flows in a 1.5 cm diameter pipe having relative surface roughness (k/D) of 0.002 and the carrier fluid was air. His conclusion on the effect of surface roughness showed that very large effect occurred as a result of roughness except on particles of size larger than ~ 10 microns. Identical conditions were applied to our model to compare the prediction of the velocity deposition using the present expression. Figure (8) illustrates the influence of surface roughness when the modified model is used and one can conclude that the effect of surface roughness fades after ~ 10 µm which is in very good agreement with the Browne’s conclusion.
0.001 0.01 0.1 1 10 100 1000
dp(µm)
1E-005 0.0001 0.001 0.01 0.1 1
Vd
+
Smooth (k=0) Rough (k=0.002)
Fig. (8). Deposition velocity predicted by current model as a function of particle size
1E-007 1E-006 1E-005 0.0001 0.001 0.01 0.1 1 10 100 1000
τ+ 0.01
0.1 1 10 100
ηc
k/D 0 0.001 0.01
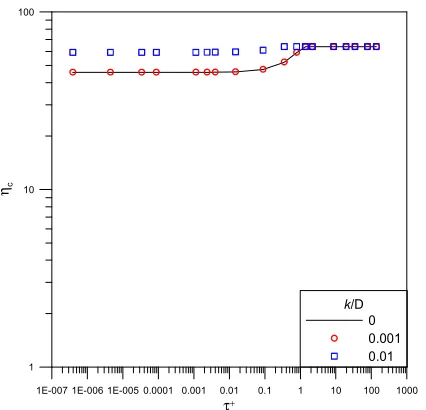
Fig. (9). Deposition efficiency as a function of relaxation time predicted by current model at different pipe roughness
1E-007 1E-006 1E-005 0.0001 0.001 0.01 0.1 1 10 100 1000
τ+ 1
10 100
ηc
k/D 0 0.001 0.01
Fig. (10). Deposition efficiency as a function of relaxation time predicted by Fan and Ahmadi model at different pipe roughness
7. Conclusion
In this work, deposition of particles in a turbulent pipe flow is studied using modified correlation of particle deposition velocity. The influence of the gas carrier velocity has been taken into account in the new model and the analysis showed that it is in good agreement with the experimental data and numerical results. The deposition efficiency of particles of different sizes, which may be inferred as a measurement of deposition rate, are evaluated from the proposed model and compared with other models available in literatures. The effect of density ratio, carrier size and surface roughness are also studied. Based on the presented results, the following conclusions may be derived:
Deposition of particles is strongly influenced by local aerodynamics effects.
The deposition velocity and deposition efficiency in turbulent pipe flow follows a V-shaped curve. The
deposition efficiency increases both with the increase of diameter for large particles, and with the decrease of diameter for submicron particles.
Increase in density ratio results in increase in the deposition rate for submicron sizes.
Reducing the size of the carrier pipe shifts the particle deposition rate curve to the right. This implies that for particles controlled by diffusion motion, the rate of particles deposit on the pipe wall increases as pipe size decreases. In turn, the deposition rate decreases when the size of pipe decreases.
Unlike other semi-empirical models, the current correlation predicts the influence of surface roughness in excellent agreement with the previous studies. The deposition rate of particles increases in remarkable manner as a results of roughness.
Nomenclature
C0 InitialParticle Concentration
Cdep Number of Deposited Particle
Cc Cunningham correction factor
CD Drag Coefficient
dp Particle diameter (m)
D Pipe diameter (m)
f Friction Coefficient
fp Penetration Coefficient
g Gravity (m/s2)
J flux vector (particles/m2/sec)
kB Boltizmann Constant
L Pipe length (m)
m Mass (kg)
np particle concentration
rp Radius of Particle (m)
Re Reynolds Number
SL Stop Distance (m)
St Stoke Number
Sc Schmidt Number
t time (s)
T Temperature (K)
u Velocity in the (x) direction (m/s)
u* Friction Velocity (m/s)
us Settling Velocity (m/s)
Ug Mean gas velocity (m/s)
Vd Deposition Velocity (m/s)
V0 Initial Velocity (m/s)
Greek Symbols
ρ Density (kg/m3)
µg Gas dynamic viscosity (N.s/m2)
λg Mean Free Path (m)
νg Gas Kinematics Viscosity (m2/s)
τV Relaxation time (s)
ηg Collection efficiency
Г Diffusivity (m2/s)
Subscripts
g Gas
References
[1] Browne, L. W. B. (1973). Deposition of particles on rough surfaces during turbulent gas-flow in a pipe. Atmospheric Environment, 8, 801-816.
[2] Chen, Q. and Ahmadi, G. (1997). Deposition of particles in a turbulent pipe flow. Journal ofAerosol Science, 28, 789-796. [3] Cleaver, J. W. and Yates, B. (1975). A sublayer model for the
deposition of particles from a turbulent flow. Chem.Engng Sci.
30, 983-992.
[4] Crowe, C.T. (2006). Multiphase Flow Handbook. Taylor & Francis Group, FL.
[5] Davies, C. N. (1966). Aerosol Science. Academic Press, London.
[6] Fan, F-G. and Ahmadi, G. (1993). A sublayer model for turbulent deposition of particles in vertical ducts with smooth and rough surfaces. Journal ofAerosol Science, 24, 45-64. [7] Fan, F.-G. and Ahmadi, G. (1994). On the sublayer model for
turbulent deposition of aerosol particles in the presence of gravity and electric fields. Aerosol Science Technology, 21,
49-71.
[8] Fichman, M., Gutfinger, C. and Pnueli, D. (1988). A model for turbulent deposition of aerosols. Journal ofAerosol Science, 19, 123-136.
[9] Friedlander, S. K. and Johnstone, H. H. (1957). Deposition of suspended particles from turbulent gas stream. Industrial and Engineering Chemistry, 49, 1151-1156.
[10] Fuchs, N. A. (1964). The Mechanics of Aerosol. Pergamon, Oxford.
[11] Hidy, G. M. (1984). Aerosols, an Industrial and Environmental Science. Academic Press, New York.
[12] Hinds, W.C., (1999). Aerosol Technology: Properties, Behaviour, and Measurement of Airborne Particles. 2nd Edition, Wiley, New York.
[13] Ilori, T. A. (1971). Turbulent deposition of aerosol particles inside pipes. PhD. thesis, University of Minnesota.
[14] Kvasnak, W., Ahmadi, G., Bayer, R., & Gaynes, M. (1993). Experimental investigation of dust particle deposition in a turbulent channel flow. Journal ofAerosol Science, 25, 795-815.
[15] Li, A. and Ahmadi, G. (1991). Dispersion and deposition of spherical particles from point sources in a turbulent channel flow. Journal ofAerosol Science Technology, 16, 209-226.
[16] Li, A. and Ahmadi, G. (1993). Deposition of aerosols on surfaces in a turbulent channel flow. International Journal of Engineering Science, 31, 435 451.
[17] Li, A., Ahmadi, G., Bayer, R. G. and Gaynes, M. A. (1994). Aerosol particle deposition in an obstructed turbulent duct flow. Journal ofAerosol Science, 25, 91-112.
[18] Liu, B. Y. H. and Agarwal, J. K. (1974). Experimental observation of aerosol deposition in turbulent flows. Journal ofAerosol Science, 5, 145-155.
[19] Maxwell J. C., (1868). On the dynamical theory of gases.
Philos. Mag., vol. II, 26–78.
[20] Miguel, A. F., A. F., Reis, A., & Aydin, M. (2004). Aerosol particle deposition and distribution in bifurcating ventilation ducts. Journal of Hazardous Materials, B116, 249-255. [21] Papavergos, P. G. and Hedley, A. B. (1984). Particle
deposition behavior from turbulent flow. Cheical Engineering Research and Design, 62, 275-295.
[22] Schwendiman, L. C. and Postma, A. K. (1961). Hanford Laboratory Report HW-SA-2236, Richland, Washington, U.S.A., also (1962) Tech. Inf. Div. Report TID-7628, Book 1 (USAEC) 1.
[23] Sehmel, G. A. (1968). Aerosol deposition from turbulent airstreams in vertical conduits, Batelle Northwest Laboratory Report BNWL-578, Richland, Washington, U.S.A.
[24] Shams, M., Ahmadi, G., & Rahimzadah, H. (2000). A sublayer model for deposition of nano- and micro-particles in turbulent flows. Chemical Engineering Science, 55, 6097-6107.
[25] Sosnowski, T. R., Moskal, A., & Gradon, L. (2007). Mechanism of aerosol particle deposition in the Oro-Pharynx under non-steady airflow. Annals of Occupational Hygiene, 51, 19-25.
[26] Tian, L. and Ahmadi, G. (2007). Particle deposition in turbulent duct flow-comparisons of different model predictions. Journal ofAerosol Science, 38, 377-397.
[27] Wells, A.C. and Chamberlain, A.C. (1967). Transport of Small Particles to Vertical Surfaces. British Journal of Applied Physics, 18, 1793.
[28] Wells, A. C. and Chamberlain, A. C. (1969). Deposition of dust from turbulent gas streams. Atmospheric Environment, 3,
494-496.