Published online November 10, 2013 (http://www.sciencepublishinggroup.com/j/jeee) doi: 10.11648/j.jeee.20130104.15
Power quality analysis in a distribution network of a
quarry processing plant
Joseph Cudjoe Attachie
*, Christian Kwaku Amuzuvi
Department of Electrical and Electronic Engineering, University of Mines and Technology, Tarkwa, Ghana
Email address:
[email protected](J. C. Attachie), [email protected](J. C. Attachie)
To cite this article:
Joseph Cudjoe Attachie, Christian Kwaku Amuzuvi. Power Quality Analysis in a Distribution Network of a Quarry Processing Plant. Journal of Electrical and Electronic Engineering. Vol. 1, No. 4, 2013, pp. 90-94. doi: 10.11648/j.jeee.20130104.15
Abstract:
Power quality problems encompass a wide range of different phenomena. Each of these phenomena may have a variety of different causes and different solutions that can be used to improve upon the power quality and equipment per-formance. This paper analyses the malfunctioning of a capacitor bank at a quarry processing company (QPC) in the Western Region of Ghana. The QPC had held the Electricity Company of Ghana (ECG) responsible for the damage. According to QPC, the damage was due to frequent power fluctuations and outages experienced from the ECG distribution network. The paper presents and discusses techniques used to investigate the cause of the problem. The result of the analysis of the damage was conducted using the electromagnetic transient programme (EMTP) and relates the damage to harmonic resonance pro-duced from the QPC power distribution network. It is recommended that, for reliable, safe and economic operation of ca-pacitor banks, the harmonic content of an electrical installation is measured and analyzed before installation.Keywords:
Power Quality, Capacitor Bank, Harmonic Resonance, Resonant Frequency, Distribution Network1. Introduction
Power quality encompasses voltage, frequency and waveform distortions that result in failure of customer equipment. From a theoretical point of view, good power quality can be taken to mean that: the voltage supplied by the utility at the customer’s service entrance is steady and within the prescribed range; that the ac frequency is steady and very close to its nominal value (within a fraction of a percent); and that the waveform or shape of the voltage curve versus time very much resembles the smooth sine wave (a condition also described as the absence of har-monic distortion). In practice, however, it makes more sense to consider power quality as the compatibility be-tween what comes out of an electric outlet and the load that is plugged into it.
Over recent years, there has been a significant increase in the installation and use of power electronic equipment in electrical power distribution systems. The operation of this equipment has in many cases significantly affected the electrical power quality to such an extent that measures have to be implemented in order to minimise the resultant adverse effects on the electrical plant and equipment [1].
Distortion of sinusoidal voltage and current waveforms caused by harmonics is one of the major power quality
concerns in the electric power industry. Considerable ef-forts have been made in recent years to improve the man-agement of harmonic distortions in power systems. Stan-dards for harmonic control have been established. Instru-ments for harmonic measureInstru-ments are widely available. The area of power system harmonic analysis has also expe-rienced significant advancement [2-3].
During the process of power quality measurement, the electric utility providers use class A (Medium Voltage (MV) bus) and class B (Low Voltage (LV) bus) equipment. Power quality parameters include: voltage frequency, RMS vol-tage values, volvol-tage flicker, imbalance in the volvol-tage three phase system and voltage harmonic distortion.
Furthermore, the electric utility suppliers measure the magnitude of all voltage dips or sags that occur in the net-works, as well as swells and interruptions both in number and duration. Power quality is ultimately a consum-er-driven issue, and the end user’s point of reference takes precedence.
distribution network. The QPC are therefore asking the ECG to pay for the replacement of the capacitor bank and also restrain ECG from surcharging them for operating at a low power factor.
2. Materials and Methods
2.1. Resonant Harmonic
The resonant frequency for a particular induc-tance/capacitance combination can be computed from a variety of different formulae depending on what data are available. The basic resonant frequency equation is:
LC
2π
1
f
r=
(1)Power systems analysts typically do not have L and C readily available, so it is commonly computed through the resonant harmonic, hr, based on fundamental frequency impedances and ratings [4]:
cap SC r
Mvar
MVA
h
=
(2)where, hr = resonance harmonic, MVASC = system short-circuit in MVA and Mvarcap = Mvar rating of
capaci-tor bank.
However, at a secondary side of a transformer, resonant frequency of a network can be determined using the rela-tion [5]:
kvar Z
kVA h
r transforme
r transforme
×
= (3)
where, h is harmonic frequency in per unit, Z is the imped-ance of the transformer in percent, kVA is the power rating and kvar is the reactive power rating of the capacitor bank.
2.2. Network Configuration
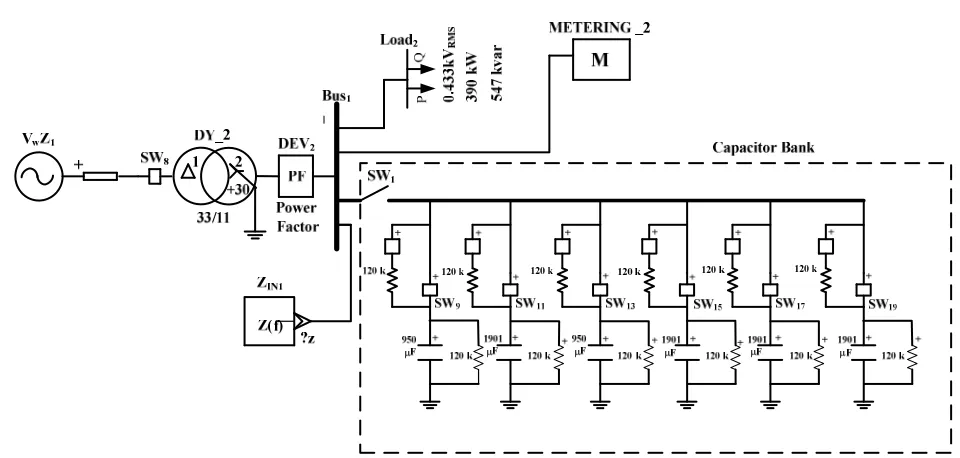
The equivalent representation of the power distribution network of the company is depicted in Fig. 1. The source is represented as a Thevenin equivalent with an X/R value of 5.3. The short circuit power is 1800 MVA at a voltage of 33 kV as base. The 2 MVA, 33/0.433 kV transformer at the station is represented by a 6% impedance. The active power (P) and reactive power (Q) load of the station are 390 kW and 547 kvar respectively.
Figure 1. A single line diagram of the QPC distribution network.
The PQ loads are primarily ac motors with variable speed drives. These drives are occasionally brought into operation as and when the system demands it. On the aver-age, the 2 MVA transformer is about 30% load with a maximum load of 630 kVA. The only significant harmonic sources on the bus are the drives.
The capacitor bank contains six steps of varying kvars. Step1 and 3 are each 56 kvar. The rest of the steps are each 112 kvar. The combined kvars of the six steps is 560 kvar. All of the kvar ratings are at a maximum voltage of 750 V.
None of the steps are configured as harmonic filters. Each of the steps is protected by a 160 A current limiting fuse. The steps switch in and out of service automatically based on the power factor correction control algorithm in the bank.
2.3. Power Quality Measurements
pe-riod of five days. The main electrical parameters tracked included power frequency, harmonics, transients and vol-tage fluctuations. From the power quality measurements, transient overvoltages were not found. Accordingly, our discussions on the electrical parameters were limited to power frequency, harmonics and voltage fluctuations.
2.4. Effect of Power Interruptions
Frequent power interruption was one of the factors the company cited as being responsible for the capacitor failure. As a result, effect of power interruption on the capacitor bank was examined. This was done by simulation using EMTP engineering software.
2.5. Outage Statistics
On the day the capacitor bank failed, six successive out-ages were recorded within a minute, followed by a loud explosion at their substation. To investigate this claim, sta-tistical record of outages on the feeder serving the company was obtained and studied.
3. Results and Discussion
3.1. Voltage Fluctuation
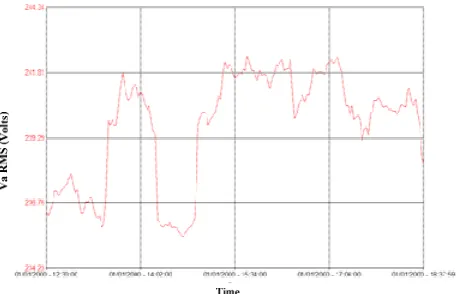
Voltage limits are based on overall permissible voltage range allowable under standards. ECG operating voltage (in low voltage network) ranges from a maximum of 253 V to a minimum of 207 V. This is based on a nominal voltage of 230 V representing ±10%. Fig. 2 shows voltage envelope as measured by the power analyzer. Operating voltage range of 235 to 242 V was recorded. This represents a voltage variation of 2-5% in comparison to ECG nominal voltage. The variation was therefore within the acceptable operating voltage limits.
Figure 2. Voltage envelope as measured by the power analyzer.
3.2. Frequency
The term power frequency disturbance describes events that are slower and long lasting compared to electrical
tran-sients. Power frequency disturbance can be harmful to electrical equipment [6]. The extent of damage varies from one piece of equipment to another and depends on the ex-tent of the disturbance. One of the most common power frequency disturbances is voltage sag. From Fig. 3, fre-quency variation of about 0.5% was noted. Effect of this variation reflected as 2% voltage sag in Fig. 2. The 2% voltage variation was within the tolerable and acceptable ECG operating voltage limit.
F
re
que
nc
y M
ini
m
um
(
H
z) Fre
que
nc
y A
ve
ra
ge
(
H
z)
Figure 3. Frequency graph as measured.
3.3. Harmonic Measurement
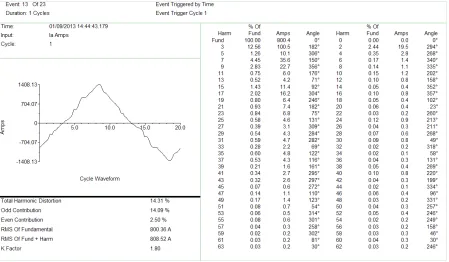
Harmonics is one of the possible causes of capacitor bank failures and fuse operations [7]. Measurements were performed to quantify the harmonic voltages and currents in the capacitors in order to study whether harmonics were the cause of the failures. Result of the harmonic measure-ment at full load of the QPC is shown in Fig. 4
The natural (resonant) frequencies of the QPC network computed at the respective steps of the capacitor bank are shown in Table 1. It is obvious that, the natural frequency of the network changes with the steps of the capacitor bank.
Table 1. Natural frequencies of the QPC network at respective steps of the capacitor bank
Step1 Step2 Step3 Step4 Step5 Step6
kvar 56 168 224 336 448 560
Resonant
Frequency(Hz) 26 15 13 10 9 8
Measured harmonic current (A), refer to Fig. 3
0 11.4 4.2 0 22.7 0
Figure 4. Harmonic measurement.
Harmonic currents of 11.4, 4.2 and 22.7 A associated with the 15, 13 and 9th harmonic orders were in turn in-jected into the network. Voltage at the LV bus and current drawn by the respective steps were observed. The worst resonance occurred at engagement of step-5. However, the effect of the resonance was more pronounced in step-3 ca-pacitor bank. In Fig. 5, current amplification of about 170% of the normal current was observed in step-3 capacitorbank. This was about 160 A drawn by step 3 capacitor bank: just equal to the size of the associated protecting fuse. The IEEE standard 18-2002 allows 135% of capacitor nominal load but this is intended for contingencies and not intended for normal continuous load. This means that, the magnitude of the current amplification is destructive.
0 50 100 150 200 250 300 350 400 450 500
-2 -1 0 1 2
t (ms)
V
o
lt
a
g
e
(
P
e
r
u
n
it
)
Voltage at the bus
0 50 100 150 200 250 300 350 400 450 500 -200
-100 0 100 200
t (ms)
C
u
rr
e
n
t
(A
)
Current in step-3 capacitor bank
Figure 5. Voltage at bus-1 and current in step-3 capacitor bank.
Generally, a fuse will start fusing from 125 to 165% of its rated current [8]. Therefore, it was expected that, the 160 A current limiting fuse of the capacitor bank should operate from 200 to 264 A. This means that, the 160 A fuse would
not blow under the resonance condition. The capacitor bank will therefore be expected to get damaged before the fuse blows.
Furthermore, capacitor fuses are deliberately oversized to take care of capacitor switching transient and prevent excessive nuisance blow-outs [5]. Although the fuse may blow at certain resonance condition, capacitor fuses are not primarily sized to take care of resonance conditions. It is therefore important to measure and analyse harmonic con-tents of an electrical installation and take preventive deci-sion before installing a capacitor bank.
3.4. Power Interruptions
The effect of power interruptions on the capacitor bank was examined. Overvoltage and inrush currents in the ca-pacitor bank during restoration of power were studied. Fig. 6 depicts that, overvoltage induced from the power restora-tion was 1.5 per unit and this lasted for 1.8 ms. The IEEE standard 18-1992 and IEEE standard 1036-1992 allow overvoltage of 1.7 per unit for 1 second. It is obvious that the overvoltage induced by the power restoration was well within the standard safety limits and therefore, should have no effect on the capacitor bank.
are 19600 A and 9100 A respectively. Consequently, it can be seen that the current drawn by the capacitors during the power restoration were far less compared with their maxi-mum inrush current limits.
0 50 100 150 200 250 300 350 400 450 500 -1.5
-1 -0.5 0 0.5 1 1.5
t (ms)
V
o
lt
a
g
e
(
P
e
r
u
n
it
)
Voltage at bus ( 1.5 p.u at reclosing, duration 1.8ms)
Figure 6. Overvoltage resulting from power restoration.
0 50 100 150 200 250 300 350 400 450 500
-2000 -1000 0 1000 2000
t (ms)
C
u
rr
e
n
t
(A
)
Current in step 2 capacitor bank
0 50 100 150 200 250 300 350 400 450 500 -1000
-500 0 500 1000
t (ms)
C
u
rr
e
n
t
(A
)
Current in step 3 capacitor bank
Figure 7. Inrush currents in the capacitor bank as a result of power res-toration
4. Conclusion
The voltage operating envelope measured at the QPC substation ranged between 2 to 5% of the nominal voltage. After the power had been restored, transient overvoltage of 1.5 per unit occurred and lasted for 1.8 ms. This overvol-tage was within the standard safety regulation. The capaci-tor bank was not affected by power fluctuation. It was noted that, harmonic study was not conducted before the capacitor bank installation. The total harmonic distortion being produced by the company is 15% which exceeds ECG standard limit of 5% required from customers. The analysis revealed that, the problem relating the capacitor
damage was actually caused by high harmonic current produced by a 9th harmonic order which emanated from the capacitor bank on the LV busbar.
Acknowledgements
The authors wish to express their profound gratitude to George Eduful and Kivlyn N. Asante both of the Electricity Company of Ghana for their immense contribution to this research.
References
[1] ABS (2006), Guidance Notes on Control of Harmonics in Electrical Power Systems Houston, USA, 2006.
[2] Task Force on Harmonics Modeling and Simulation, “The Modeling and Simulation of the Propagation of Harmonics in Electric Power Networks Part I: Concepts, Models and Si-mulation Techniques”, IEEE Transactions on Power Delivery, Vol.11, No.1, January 1996, pp. 452-465.
[3] Task Force on Harmonics Modeling and Simulation, “The Modeling and Simulation of the Propagation of Harmonics in Electric Power Networks Part II: Sample Systems and Ex-amples”, IEEE Transactions on Power Delivery, Vol.11, No.1, January 1996, pp. 466-474.
[4] R. Dugan, Electric Power Systems Quality, Mc Graw-Will, EUA, 2003, pp. 167-224.
[5] T. Blooming, “Capacitor Application Issues”, IEEE Transaction on Industry Applications, vol. 44, no. 4, 2008, pp. 1013 – 1026.
[6] C. Sankaran, Power Frequency Disturbance, Online source.
Available at
www.crcnetbase.com/doi/pdf/10.1201/9781420041026.ch2: CRC Press LLC, 2002.
[7] M. B. P. Thomas, “Capacitor Failure Analysis: A Troubleshooting Case Study”, Online source, date accessed
5th January, 2013. Available at
www.asocem.org.pe/bivi/sa/dit/icem/05_04-2005.pdf, 2005.
[8] S. A. Ali, “Capacitor Banks Switching Transients in Power Systems”, Energy Science and Technology, Vol. 2 , No.2, 2011, pp. 62-73.