A HYBRID GENETIC ALGORITHM FOR PARTITIONING OF DATA
MODEL IN DISTRIBUTION MANAGEMENT SYSTEMS
Darko Capko, Aleksandar Erdeljan, Srdjan Vukmirovic, Imre Lendak
Faculty of Technical Sciences , Trg Dositeja Obradovica 6, Novi Sad, Serbia email: [email protected], [email protected], [email protected], [email protected]
Abstract. In this paper, we propose a Hybrid Genetic Algorithm for data model partitioning of power distribution network. Analytical functions are the core of Distribution Management Systems (DMSs). Efficient calculation of the functions is of the utmost importance for the DMS users; the necessary preconditions for the efficient calculation are optimal load balancing of processors and data model partitioning among processors. The proposed algorithm is applied to different real models of power distribution systems. It obtains better results than classical evolutionary algorithms (Genetic Algorithm and Particle Swarm Optimization). The Hybrid Genetic Algorithm also achieves better results than multilevel algorithm (METIS) in cases of small graphs.
Keywords: graph partitioning, genetic algorithm, Distributed Management System, Common Information Model.
1. Introduction
In order to effectively manage modern adaptive applications within the multiprocessor system, large amounts of data need to be optimally processed in pa-rallel. For optimal calculations to be carried out on certain groups of data, the following conditions must be satisfied: the data are necessarily partitioned across the processors and load balancing of the processors must be achieved. It is necessary to make an optimal distribution of data across the processors in accor-dance with pre-defined criteria that determine the calculation functions so that the calculations and the overall system functioning is efficient.
The Integrated Smart Grid power system largely increases the amount of data in each of its subsystems. It integrates systems such as [1]: Geographic Informa-tion System, Energy Management System, Distribu-tion Management System (DMS), Outage Manage-ment System, etc. We treat parallel calculations in the DMS as one subsystem of Smart Grid system. DMSs have the supervision, management, planning and visualization of the distribution network in two modes: on-line (real-time) and simulation. Analytical DMS functions are the central component of the DMS. They allow monitoring and manage the power distribution network.
The most important DMS functons are: Load Flow (LF), State Estimation (SE), Fault Calculation, Perfor-mance Indices, Volt/Var Control, etc.
This paper describes the optimal partitioning of power distribution network data model by using the most common DMS functions – Load Flow and State
Estimation. Also, the real power distribution networks and the corresponding functions are analyzed. The LF [2] and SE function algorithms are based on the weak-ly meshed radial data network. SE requires multiple LF execution and will thus not be discussed further. The network architecture makes the data models suit-able for partitioning and parallel calculations [3, 4].
Depending on an application context of the DMS, dynamic data can be monitored either on-line by the SCADA system (real-time context), or off-line – de-fined and analyzed by the user (within the planning, simulation or testing contexts). Calculation time of the functions above becomes critical with increasing amounts of data involved in calculations (the present network contains tens of millions of data). For DMS functions optimization, only real-time (RT) context is critical for time calculation.
This paper reports the results of experiments which show that hybrid Genetic Algorithm (HGA) can be successfully applied for initial partitioning and that it always provides better results than simple Genetic Algorithm (GA)[5] and Particle Swarm Optimization (PSO)[6] algorithm.
The paper is organized in the following way: next section describes related work on algorithms for parti-tioning graphs. Section 3 describes the problem and defines terms used in the paper. It also includes the details of data model and definitions of the optimiza-tion problem. The HGA for initial partioptimiza-tioning is pre-sented in Section 4. Section 5 describes experimental setup, presents and discusses the results. Section 6 is a conclusion.
2. Related Works
Graph partitioning is classified as an NP hard opti-mization problem [7]. Many suboptimal graph parti-tioning solutions have been proposed. Two commonly used classes of algorithms are multilevel and evolutio-nary algorithms.
Multilevel algorithms [8, 9] consist of three pha-ses: coarsening – the matching of vertices per levels, partitioning – the partition graph consisting of mat-ched vertices at a certain level and refinement – im-provement of the partitioning at various levels. Most of these algorithms use KL [10] or its variant FM [11] algorithms, which are specialized for local improve-ment of solutions by exchanging vertices between the individual partitions. In addition, the FM algorithm moves a vertex from one partition to another in each iteration, and the KL algorithm exchanges vertices between partitions. Most commonly used multilevel algorithm is METIS algorithm [9].
In our studies [5, 6, 12], evolutionary algorithms are used for the initial partitioning. This allows the use of somewhat slower algorithms since it is done prior to startup. However, before the algorithms are applied, the coarsening of data is required in order to reduce the problem dimensionality and make a smaller num-ber of data groups. The aim of the study reported in this paper is to improve previously obtained results and determine the applicability of evolutionary algo-rithms to large data model partitioning in power distri-bution systems.
Evolutionary algorithms have been successfully used for graph partitioning. The most commonly used algorithms are PSO[6] and GA[5, 13-15].
GA is used for graph partitioning: various size graphs or unweighted ones [13]. Furthermore, parallel GA [14, 15] was developed to speed up the algorithm. If the accuracy of a simple GA is not satisfied, then variants of hybrid GA are recommended [16-19]. GA finds a solution close to the optimum and some other algorithm (often KL/FM) is used for local refinement [13].
This paper compares hybrid GA with previously used GA[5, 12] and PSO[6, 12] algorithms for initial graph partitioning.
3. DMS Data Model Partitioning
3.1. DMS data model
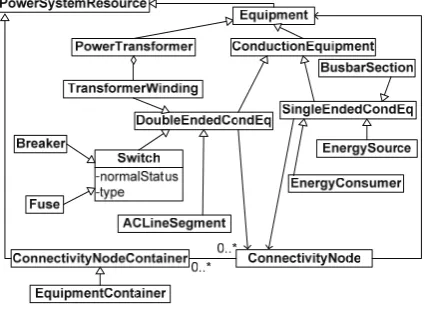
Data models in power distribution utilities, based on Common Information Model (CIM) connectivi-ty/topology model (Figure 1) are studied. CIM [20] is a well-known standard established by the International Electrotechnical Commission (IEC). It defines an ob-ject-oriented model of electric power systems, repre-sents resources as classes and associations between them.
The distribution network is a weakly meshed radial network. It begins in high-voltage substations ( Substa-tion) of the power sources (EnergySource), represen-ting the point of supply from energy transmission networks. The connectivity model is composed of transformer substations (represented by PowerSystem-Resource) connected with power lines ( ACLineSeg-ment), which are used to supply groups of consumers with energy (EnergyConsumer). Substations contain various equipment (ConductingEquipment and Power-Transformer) that is connected by various nodes ( Con-nectivityNode). ConductingEquipment objects are m-odelled with single- or double-ended ( SingleEn-dedCondEq and DoubleEndedCondEq) conductors, and these are always connected with Connectivity-Node(s). Some of the typical single-ended conductors are EnergyConsumer, EnergySource, and BusbarSec-tion, and double-ended ones are Switchgear (Breaker, Fuse) and ACLineSegment. In essence, the connec-tivity model is an edge-vertex model suitable for a graph presentation, where edges and vertex are instances of ConductingEquipment and Connectivity-Node, respectively.
Figure 1. Connectivity CIM based DMS data model
DMS data model (Q) contains all elements i that
are included in a calculation. Conducting equipment and transformers are elements usually used for the DMS functions.
If two elements i and j are in a relation N(i, j)
then it is assumed that the calculation function uses them together. The elements are connected and they are called neighbors.
The relation between neighbors that depends on the state of an element (uij) could be temporarily
inactive. We refer to it as potential connectionPot(i, j, uij). When a potential connection is activated, two elements become neighbors
(D Di, jQ Pot) ( ,D Di j,uij active)N( ,D Di j) (1)
For example, state of a switch between pieces of equipment could be active (closed) or inactive (open).
The set of mutually connected elements is called
calculation regionR (or just region)
( ) ( , ) ,
{1, 2,..., }
i Rk N i j j Rk
k n
D D D D
(2)
and it is the smallest data unit that can be processed by calculation function.
All regions create a calculation domain D (D R1R2...Rn ) and function Yi = (Ri) is
applied to each region Ri to produce output result set
. ...
2
1 Y Yn
Y
Y
3.2. Model Partitioning
The process of partitioning large datasets consists of the following phases: 1) formation of the initial graph, 2) topological analysis and creation of the graph for calculations (coarsened graph), and 3) par-titioning of the coarsened graph.
1. Formation of the initial graph
The initial graph is derived from the conduction elements and other equipment involved in the cal-culations. The edges of the initial graph are: (i) double ended equipment, (ii) single ended equipment with one fictive vertex. The transformers with two win-dings are presented with two edges (primary + de-rived), and transformers with three windings are presented with three edges (primary + two derived). The vertices are connectivity nodes.
2. Topological analysis and creating of the graph for calculations
Topological analysis is one of the DMS functions. It depends on the status of conducting equipment; for instance, the state of the switches (open / closed). The analysis determines the basic group of elements (cal-culation regions) necessary for the cal(cal-culations. The result of the analysis is a calculation domain D that
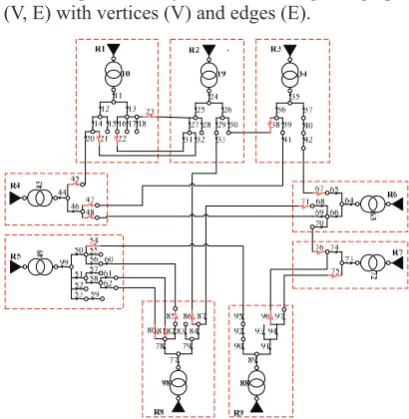
could be represented by undirected weighted graph G = (V, E) with vertices (V) and edges (E).
Figure 2. An example of initial data model in power distribution system
The weight of vertex vi (w(vi)) depends on the
complexity of the calculation for the appropriate region Ri. The example of determining the complexity
of the calculation for different types of electrical com-ponents in power distribution systems is given in [21]. If Load Flow (LF) function is considered, it can be inferred that the complexity of the LF calculation is linearly proportional to the total number of elements in the region. Therefore the weight of vertex vi is equal
to the number of elements in the region Ri. The weight
of edge ei,j = (vi, vj) (w(ei,j)) is equal to the number of
the potential connections between elements of two regions (for example there are 3 open switches bet-ween regions R1 and R2, therefore w(e1,2)=3). Thus, for
example, for LF calculations, the initial graph model from Figure 2 would be transformed into the coarse-ned graph shown in Figure 3.
Figure 3. Coarsened graph for Load Flow calculation
3. Partitioning of the coarsened graph - definition of optimization criteria
where partition Si contains an optimal set of regions
(vertices).
3.3. Optimization criterion
In order to define optimization criterion for a partition Sk, we need to define the partition weight
WSk:
k j
j k
R R
WS w
S
¦
(3)as the sum of all contained regions’ weights. We also need to define a function Ik as:
¦
k
q p Rq
Rp
R R
k Pot
S
I
,
, (4)
This function is an indicator of “good connectivi-ty” between the regions in the partition.
First, it is necessary to group regions into a defined number of partitions (p), so that the weights of these partitions are approximately the same. They can never be greater than the maximal partition weight M de-fined as:
1
1 (1 )
k
p
k
M W
p S
H
¦
(5)where WSkis weight of partition Sk, p is the number of
partitions, and H [0, (p–1)/p] is the tolerance.
The optimization criterion should obtain the maximum connection inside a partition:
,
1
¦
<p
k k
I (6)
, ) max(<
F (7)
where function Ik is given in (4), and all partition
weights are constrained by:
, {1, 2,..., }.
k
WS dM k p (8)
It should be noted that the maximal number of connections inside each of the partitions means a minimal number of connections among partitions.
4. Algorithms
We apply the HGA to find the best approximate solutions for the optimization problem (7) with respect to the constraints given in (8). HGA consists of the simple genetic algorithm. Its solutions are improved by using FM algorithm.
It is assumed that a graph with the n regions (vertices) should be divided into the p partitions. The solution is represented by the vector of the n elements whose values are indices of the given partitions (integers between 0 and p-1).
4.1. Genetic Algorithm (GA)
GA starts from randomly constructed initial solutions, which are considered individuals in a population. The initial partition weight can affect the quality of the solution. After coarsening the graph, the DMS data model partitioning problem becomes the weighted graph partitioning problem. The weighted graph has less than 1000 vertices (realistic estimations are around 500 vertices). Experimental results show that good solutions for this kind of graph partitioning can be obtained when the number of individuals is si-milar to the number of vertices (regions). The GA exe-cution time is not considered since the algorithm execution time is not critical. The algorithm is exe-cuted prior to the start of the system.
GA is an iterative algorithm that consists of selec-tion, crossover and mutation.
Different types of selection (random, tournament and roulette-wheel) are studied. Experimental results show that the best selection type is roulette-wheel.
In addition, different types of crossovers can be used: in one point, in the k-points, etc. For the purpo-ses of our research, we chose the one point crossover. It randomly selects a cut point which is the same on both parent individuals. The cut point divides the individuals into two disjoint parts. Two offsprings are created from opposite parts of parents. If the constraint for partition weights (given by (8)) is not satisfied then a high penalty factor is used to decrease function F. Besides the one point crossover (without prepro-cessing), we investigate the following crossovers: (i) a crossover with unique partition representation (nor-malization) in all individuals [22], and (ii) a crossover with the favorite best partition [5]. Our experiments show that the best results are obtained with the crossover without preprocessing ([22], [5]). The prob-ability that a certain individual is involved in a cross-over is called crosscross-over rate. Mutation is performed with a probability that is called mutation rate. The choice of mutation rate significantly influences the solution quality.
Also, the results gained from our experiments show good convergence of GA (i.e. good global search). However, inadequately fine solutions indicate the need to combine GA with algorithms for local provements. FM algorithm is chosen for local im-provement.
4.2. Fiduccia-Mattheyses (FM) algorithm
FM algorithm [11] is a group migration heuristic which starts with a partitioned graph and iteratively moves vertices to improve solution. It selects the vertex that should be moved from one partition to another. The criterion for moving vertex vi from
partition SS to partition SJ is the maximum value of
gain parameter (g). The parameter is calculated as:
where FS(i, J) is the number of edges connecting the vertex vi with vertices in the partition SJ, and TE(i) is
the number of edges incident to vertex vi and another
vertex in the same partition (SS) as vertex vi.
In the case of weighted graphs, it is the sum of weights of the corresponging edges that is calculated instead of the number of edges. Fiduccia and Matthey-ses [11] propose a method of FM algorithm realiza-tion. The method speeds up the execution time of the algorithm by using data structure (bucket list) that re-duces computation time (an iteration can be done in O(|E|) time). For multiple-way partitioning, all pos-sible transfers of border vertices (neighbors with verti-ces from other partitions) are checked.
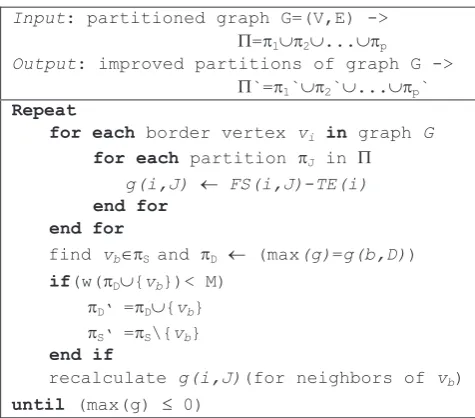
Pseudo code of a simplified FM algorithm is given below:
Input: partitioned graph G=(V,E) ->
3=S1S2...Sp
Output: improved partitions of graph G ->
3`=S1`S2`...Sp`
Repeat
for each border vertex vi in graph G
for each partition SJ in 3
g(i,J) m FS(i,J)-TE(i) end for
end for
find vbSS and SD m (max(g)=g(b,D))
if(w(SD{vb})< M) SD‘ =SD{vb} SS‘ =SS\{vb}
end if
recalculate g(i,J)(for neighbors of vb)
until (max(g) d 0)
In the HGA, we first use the GA to partition a graph; then, we use the FM algorithm to improve this graph.
4.3. Hybrid Genetic Algorithm
The HGA utilizes the results of FM algorithm to improve the local optimum. The initial population is generated randomly (for each gene in each individual the partition number is randomly set). Since the FM algorithm moves a vertex from one partition to ano-ther (in the GA, this movement presents a value change of a particular gene), hybridization of the ge-netic algorithm is carried out in a mutation phase. HGA uses mutations from the classical genetic algo-rithm; but it also introduces FM mutations periodi-cally (every freq iterations).
Pseudo code of the HGA is given below:
Input: unpartitioned graph G=(V,E)
Output: partitioned graph 3=S1S2...Sp
create initial population X={x1,x2,...,xm}
it m 0
repeat
select pairs (xi,xj) for crossover
it m it+1
for each pair (xi,xj)
offspringi,j m Crossover(xi,xj)
X = X {offspringi,j}
end for
Xmut m select individuals for mutation
for each individual xkXmut
xnk m Mutation(xk)
X = X {xnk}
end for
if it%freq = 0
XFM m select individuals for FM
for each individual xqPFM
xnq m FM_mutation(xq)
X = X {xnq}
end for end if
Xmchoose the best m individuals from X
until (no progress) or it > maxit
The algorithm is finished either if there is no improvement or, after a predefined number of iterations (maxit) are executed.
5. Experimental Results
We tested the models of the real electric power distribution network. The network characteristics are shown in Table 1.
Table 1. Test data models
Size of initial graph (uncoarsened)
Size of coarsened graph Graph
name
Total number
of
elementsNumber of vertices Number of edges of regionsNumber of edges Number
bg54 1126254 295225 299131 54 44
it206 1787939 431102 434486 206 286
pec106 2284322 762411 766755 106 52
bg63 1196078 300503 304637 63 52
bg5x 5980390 1502505 1523180 315 260
Models bg54 and bg63 are different versions of Belgrade (Serbia) power distribution network. Pec is a part of North Carolina (United States) power distribution network model; it206 is a network model of Milano (Italy); and bg5x is Belgrade network model multiplied five times.
We ran initial partitioning tests using HGA on datasets from Table 1.
bg54, bg63 100 individuals
pec106 120 individuals
it206 220 individuals
Population size
bg5x 330 individuals
Crossover rate 0.5 (50%)
Mutation rate 0.5 (50%)
FM mutation frequency 100 iterations
Balancing coeficient 0.1 (10%)
Maximal number of iterations 5000
Our experiments show that the best results are achieved with a mutation rate of 0.5 (50%) and crossover rate of 0.5 (50%).
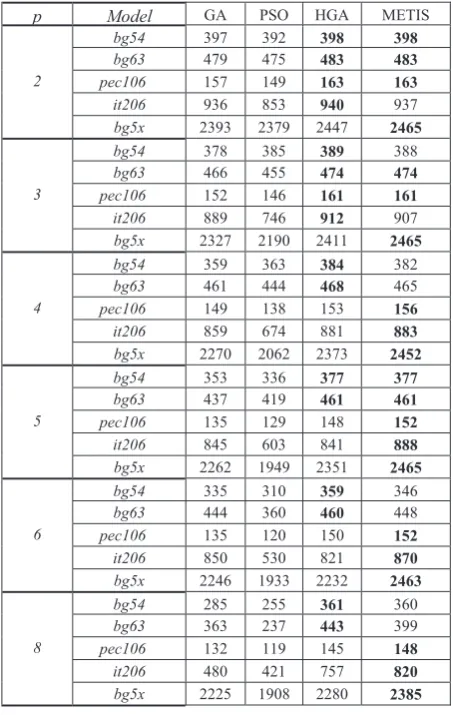
The obtained results (for function F given by (7)) are shown in Table 2.
Table 2. Partitioning results (the best results are in bold)
p Model GA PSO HGA METIS
bg54 397 392 398 398 bg63 479 475 483 483 pec106 157 149 163 163
it206 936 853 940 937
2
bg5x 2393 2379 2447 2465 bg54 378 385 389 388
bg63 466 455 474 474 pec106 152 146 161 161
it206 889 746 912 907
3
bg5x 2327 2190 2411 2465 bg54 359 363 384 382
bg63 461 444 468 465
pec106 149 138 153 156 it206 859 674 881 883 4
bg5x 2270 2062 2373 2452 bg54 353 336 377 377 bg63 437 419 461 461 pec106 135 129 148 152
it206 845 603 841 888 5
bg5x 2262 1949 2351 2465 bg54 335 310 359 346
bg63 444 360 460 448
pec106 135 120 150 152 it206 850 530 821 870 6
bg5x 2246 1933 2232 2463 bg54 285 255 361 360
bg63 363 237 443 399
pec106 132 119 145 148 it206 480 421 757 820 8
bg5x 2225 1908 2280 2385 The table includes the results obtained from pre-viously developed GA and PSO algorithms [5, 6, 12].
Based on these results, we can conclude that the HGA always achieves significantly better results than simple GA and PSO algorithms. This is particularly evident when partitioning graphs which have over 100 vertices, and when there is a large number of par-titions.
The applicability of the HGA is determined by giving a comparison of the results gained from the HGA and the ones gained from the METIS algorithm.
The METIS algorithm is much faster but this charac-teristic is insignificant for the practical applications of the model initial partitioning. Thus we conclude that the HGA yields better results for graphs of up to 200 vertices. We recommend specialized multilevel algo-rithms for partitioning graphs that are over 200 vertices and if there is a large number of partitions required.
6. Conclusions
In this paper, we developed a new HGA for initial partitioning of large data models. The amount of data that need to be processed in the DMSs is increased. The increase calls for parallel calculations of ana-lytical DMS functions. The calculations are executed in different processors; consequently different data are sent to different processors. The DMS network is such that the problem of data partitioning boils down to the problem of graph partitioning.
The algorithm is successfully applied to large scale electricity power distribution data model. Experiments reported in the paper show that HGA always obtains better results than simple GA and PSO algorithms do. Further, HGA is compared with METIS algorithm. The results show that HGA is good for partitioning graphs with up to 200 vertices.
Acknowledgements
We would like to thank our associates at Telvent DMS Llc, Novi Sad, Serbia for their help during our work on this research. They were the sole source of all real-life electric power system data. This work has been partly supported by the Serbian Ministry of Edu-cation&Science, through grant No. 32018, 2011.
References
[1] E. Santacana, G. Rackliffe, L. Tang, X. Feng. Get-ting Smart. IEEE Power and Energy Magazine, 2010,
Vol.8, No.2, 41–48.
[2] D. Shirmohammadi, H.W. Hong, A. Semlyen, G.X. Luo. A Compensation-Based Power Flow Method For Weakly Meshed Distribution And Transmission Net-works. IEEE Transactions on Power Systems, 1988,
Vol.3, No.2, 753–762.
[3] M. Popovic, I. Basicevic, V. Vrtunski. A Task Tree Executor: New Runtime for Parallelized Legacy Soft-ware. 16th Annual IEEE International Conference and Workshop on the Engineering of Computer Based
Sys-tems, ECBS 2009, San Francisco, USA, 2009.
[4] A. Igumenov, T. Petkus. Analysis of Parallel Calcu-lations in Computer Network, Information Technology and Control, 2008, Vol.37, No.1, 57–62.
[5] D. Capko, A. Erdeljan, S. Vukmirovic, I. Lendak. Using Genetic Algorithm for Power Distribution Net-work Partitioning. 2nd Regional Conference, Indust-rial Energy and Environmental Protection in South
[6] D. Capko, A. Erdeljan, I. Lendak. PSO algorithm for Graph Partitioning (in Serbian). 17th
Telecommu-nication Forum 2009, Belgrade, Serbia, 2009.
[7] M.R. Garey, D.S. Johnson. Computers and Intract-ability: A Guide to the Theory of NP-Completeness.
W.H. Freeman, San Francisco, 1979.
[8] B. Henderson, R. Leland. A Multilevel Algorithm for Partitioning Graphs. Proceedings of ACM/IEEE
confe-rence on Supercomputing, San Diego, 1995.
[9] G. Karypis, V. Kumar. A fast and high quality multi-level scheme for partitioning irregular graphs. SIAM
Journal on Scientific Computing, 1998, Vol.20, No.1,
359–392.
[10] B.W. Kernighan, S. Lin. An efficient heuristic pro-cedure for partitioning graphs, The Bell System Tech-nical Journal, 1970, Vol.49, No.2, 291–307.
[11] C.M. Fiduccia, R.M. Mattheyses. A linear time heu-ristic for improving network partitions. In:Proc. 19th
IEEE Design Automation Conference, 1982, 175–181
[12] D. Capko, A. Erdeljan, M. Popovic, G. Svenda. An Optimal Relationship-Based Partitioning of Large Datasets. 14th East-European Conference on
Advan-ces in Databases and Information Systems, Novi Sad,
Serbia, 2010.
[13] T.N. Bui, B.R. Moon. Genetic Algorithm and Graph Partitioning. IEEE Transactions on Computers, 1996,
Vol.45, No.7, 841–855.
[14] E.G. Talbi, P. Bessiere. A Parallel Genetic Algorithm for the Graph Partitioning Problem. In: Proc. of the
In-ternational Conference on Supercomputing, Cologne,
1991.
[15] E. Cantu-Paz. A Survey of Parallel Genetic Algo-rithms, Technical Report. Illinois Genetic Algorithms
Laboratory, Department of General Engineering,
Illinois, 1997.
[16] T.A. El-Mihoub, A.A. Hopgood, L. Nolle, A. Bat-tersby. Hybrid Genetic Algorithm: A Review. Engi-neering Letters, 2006, Vol.13, No.2, 124–137. [17] S. Kang, B. Moon. A Hybrid Genetic Algorithm for
Multiway Graph Partitioning. In Proceedings of the
Genetic and Evolutionary Computation Conference,
2000.
[18] A. Miseviius. An Extension of Hybrid Genetic Algo-rithm for the Quadratic Assignment Problem,
Infor-mation Technology and Control, 2004, Vol.4, No.33,
53–60.
[19] A. Miseviius, D. Rubliauskas. Performance of Hyb-rid Genetic Algorithm for The Grey Pattern Problem,
Information Technology and Control, 2005, Vol.34,
No.1, 15–24.
[20] IEC 61970 Energy management system application program interface (EMS-API) – Part 301: Common Information Model (CIM) Base. IEC, Edition 2.0, 2007.
[21] S.S. Choi, B.R. Moon. Normalization in genetic algo-rithms. In Proceedings of the Genetic and
Evolutio-nary Computation Conference, 2003, 862–873.
[22] P. Zhang, J.R. Marti, H.W. Dommel. Network Partitioning for Real-Time Power System Simulation.
International Conference on Power System Transients,
Montreal, Canada, 2005.