Open Access
Research
Feasibility and reference values of left atrial longitudinal strain
imaging by two-dimensional speckle tracking
Matteo Cameli
†1, Maria Caputo
†1, Sergio Mondillo
1, Piercarlo Ballo*
2,
Elisabetta Palmerini
1, Matteo Lisi
1, Enzo Marino
3and Maurizio Galderisi
4Address: 1Department of Cardiovascular Diseases, University of Siena, Siena, Italy, 2Cardiology Operative Unit, S Andrea Hospital, La Spezia, Italy, 3GE Healthcare, Milan, Italy and 4Cardioangiology Unit with CCU, Department of Clinical and Experimental Medicine, Federico II University Hospital, Naples, Italy
Email: Matteo Cameli - [email protected]; Maria Caputo - [email protected]; Sergio Mondillo - [email protected]; Piercarlo Ballo* - [email protected]; Elisabetta Palmerini - [email protected]; Matteo Lisi - [email protected]; Enzo Marino - [email protected]; Maurizio Galderisi - [email protected]
* Corresponding author †Equal contributors
Abstract
Background: The role of speckle tracking in the assessment of left atrial (LA) deformation dynamics is not established. We sought to determine the feasibility and reference ranges of LA longitudinal strain indices measured by speckle tracking in a population of normal subjects.
Methods: In 60 healthy individuals, peak atrial longitudinal strain (PALS) and time to peak longitudinal strain (TPLS) were measured using a 12-segment model for the left atrium. Values were obtained by averaging all segments (global PALS and TPLS) and by separately averaging segments measured in the two apical views (4- and 2-chamber average PALS and TPLS).
Results: Adequate tracking quality was achieved in 97% of segments analyzed. Inter and intra-observer variability coefficients of measurements ranged between 2.9% and 5.4%. Global PALS was 42.2 ± 6.1% (5–95° percentile range 32.2–53.2%), and global TPLS was 368 ± 30 ms (5–95° percentile range 323–430 ms). The 2-chamber average PALS was slightly higher than the 4-chamber average PALS (44.3 ± 6.0% vs 40.1 ± 7.9%, p < 0.0001), whereas no differences in TPLS were found (p = 0.93).
Conclusion: Speckle tracking is a feasible technique for the assessment of longitudinal myocardial LA deformation. Reference ranges of strain indices were reported.
Background
The left atrium plays as a booster pomp during late ven-tricular diastole, as a reservoir for the inflow volume received from pulmonary veins during ventricular systole and isovolumic relaxation, and as a passive conduit dur-ing early ventricular diastole and diastasis [1,2]. Although estimates of left atrial (LA) function can be obtained by
two-dimensional echocardiography, Doppler analysis of transmitral and pulmonary vein flow, and Tissue Doppler (TD) assessment of LA myocardial velocities [3-5], quan-tification of effective LA function still remains a challeng-ing issue. Assessment of atrial deformation profiles obtained using Doppler-derived strain imaging has been recently proposed as an alternative method of exploring
Published: 8 February 2009
Cardiovascular Ultrasound 2009, 7:6 doi:10.1186/1476-7120-7-6
Received: 22 December 2008 Accepted: 8 February 2009
This article is available from: http://www.cardiovascularultrasound.com/content/7/1/6
© 2009 Cameli et al; licensee BioMed Central Ltd.
LA function[6]. However, this approach is limited by a number of potential drawbacks, including suboptimal reproducibility, angle dependence, and the confounding effect of noise artifacts[7].
Two-dimensional strain imaging is an echocardiographic technique that uses standard B-mode images for speckle tracking analysis. The speckle pattern (acoustic backscatter generated by the reflected ultrasound beam) is followed frame-by-frame, using a statistical approach based on the detection of the best matching area. The displacement of this speckled pattern is considered to follow myocardial movement, and a change between speckles is assumed to represent myocardial deformation[8,9].
Quantification of LA myocardial function by speckle tracking has been recently proposed[10,11], but data on reference values of LA speckle tracking indices are still lacking.
The aims of this study were to define the feasibility of speckle tracking-based strain imaging for the evaluation of LA wall deformation in a population of healthy subjects, and to identify normality ranges for corresponding strain values.
Methods
Study population
Sixty consecutive adult healthy subjects, referring to our Echo Laboratory for a diagnostic examination, were included in the study group. All had unremarkable clini-cal history and normal findings at physiclini-cal examination, ECG, and baseline echocardiography, and none of them was taking cardiac medications. All subjects gave their written informed consent for participation in the study.
Standard echocardiography
Echocardiographic studies were performed using a high-quality echocardiograph (Vivid 7, GE, USA). Subjects were studied in the left lateral recumbent position. Measure-ments of left ventricular (LV) and LA dimensions were made in accordance with current American Society of Echocardiography recommendations[12]. LV ejection fraction was measured using the modified biplane Simp-son's rule. The ratio between peak early (E) and late (A) diastolic LV filling velocities and E wave deceleration time were determined by standard Doppler imaging. The tim-ings of mitral and aortic valve opening and closure were defined by pulsed wave Doppler tracings of mitral inflow and LV outflow.
Speckle tracking
For speckle tracking analysis, apical four- and cham-ber views images were obtained using conventional two-dimensional gray scale echocardiography, during breath
hold with a stable ECG recording. Particular attention was given to obtain an adequate gray scale image, allowing reliable delineation of myocardial tissue and extracardiac structures. Three consecutive heart cycles were recorded and averaged. The frame rate was set between 60 and 80 frames per second. These settings are recommended to combine temporal resolution with adequate spatial defi-nition, and to enhance the feasibility of the frame-to-frame tracking technique[13].
Recordings were processed using an acoustic-tracking soft-ware (Echo Pac, GE, USA), allowing off-line semi-auto-mated analysis of speckle-based strain[14,15] (Figure 1). Briefly, LA endocardial surface is manually traced in both four- and two-chamber views by a point-and-click approach. An epicardial surface tracing is then automati-cally generated by the system, thus creating a region of interest (ROI). After manual adjustment of ROI width and shape, the software divides the ROI into 6 segments, and the resulting tracking quality for each segment is automat-ically scored as either acceptable or non-acceptable, with the possibility of further manual correction. Segments in which no adequate image quality can be obtained are rejected by the software and excluded from the analysis.
Measurement of left atrial longitudinal strain by speckle tracking
Figure 1
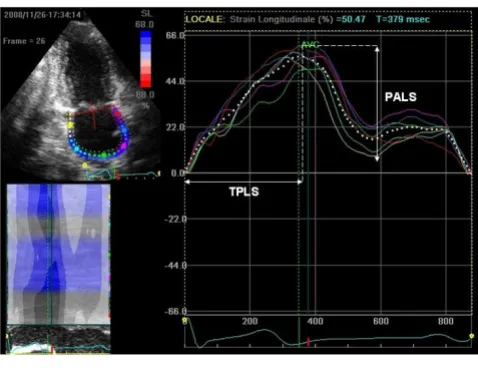
Lastly, the software generates strain curves for each atrial segment. In subjects with adequate image quality, a total of 12 segments were then analyzed. To trace the ROI in the discontinuity of LA wall corresponding to pulmonary veins and LA appendage, the direction of LA endocardial and epicardial surfaces at the junction with these struc-tures was extrapolated. Peak atrial longitudinal strain (PALS) was calculated by averaging values observed in all LA segments (global PALS), and by separately averaging values observed in 4- and chamber views (4- and 2-chamber average PALS) (Figure 2). The time to peak lon-gitudinal strain (TPLS) was also measured as the average of all 12 segments (global TPLS) and by separately averag-ing values observed in the two apical views (4- and 2-chamber average TPLS). In patients in whom some seg-ments were excluded because of the impossibility of achieving adequate tracking, PALS and TPLS were calcu-lated by averaging values measured in the remaining seg-ments.
Reproducibility of PALS and TPLS measurements was assessed in 20 randomly selected subjects. Intra and inter-observer variability coefficients were calculated using images independently recorded in two different occasions by the same investigator or by two different observers.
Statistical analysis
Data are shown as mean ± SD. Inter- and intra-observer reproducibility was assessed by calculating variability coefficients. Reference values were expressed as mean ± SD and 5–95° percentile ranges. Comparisons were per-formed using the Student's t test for paired data. A P value < 0.05 was considered statistically significant. Analyses
were performed using the SPSS (Statistical Package for the Social Sciences, Chicago, Illinois) software Release 11.5.
Results
Feasibility
Table 1 shows the clinical and echocardiographic charac-teristics of the study population. Among a total of 720 seg-ments, the software was able to track 697 (96.9%) segments. Adequate tracking of all 12 LV segments was achieved in 50 (83.3%) subjects, and in no cases the number of segments adequately explored was < 8. Average post-processing time per patient was 2 ± 1 min. Inter-observer variability coefficients of global PALS and TPLS were 3.4%, and 4.8%, respectively. For intra-observer var-iability, the corresponding variability coefficients were 2.9% and 3.8%.
When the reproducibility was separately considered in the two apical views, inter-observer variability coefficients were 4.3% and 4.6% for 4- and 2-chamber average PALS, and 5.4% and 5.3% for TPLS, respectively. Corresponding intra-observer variability coefficients were 3.6%, 4.0%, 4.5%, and 4.8%.
Reference ranges
Mean ± SD and 5–95° percentile ranges of global, 4-chamber, and 2-chamber PALS and TPLS observed in the study population are reported in Table 2. Notably, 2-chamber average PALS was significantly higher than 4-chamber average PALS (p < 0.0001), whereas there was no difference between 2- and 4-chamber average TPLS (p = 0.93).
Measurement of peak atrial longitudinal strain (PALS) and time to peak longitudinal strain (TPLS)
Figure 2
Measurement of peak atrial longitudinal strain (PALS) and time to peak longitudinal strain (TPLS).
Table 1: General characteristics of the study population
Variable
Age (years) 32.8 ± 13.6
Female gender (n) 29 (48.3%)
Height (cm) 171.3 ± 8.1
Weight (kg) 66.7 ± 9.8
Body surface area (m2) 1.73 ± 0.4
Body mass index (kg/m2) 22.6 ± 2.2
Systolic blood pressure (mmHg) 120 ± 10.7
Diastolic blood pressure (mmHg) 77.3 ± 5.2
Heart rate (bpm) 73.3 ± 10.0
End-diastolic LV diameter (mm) 44.9 ± 4.8
End-systolic LV diameter (mm) 28.3 ± 4.2
LV ejection fraction (%) 60.0 ± 4.3
Left atrial diameter (mm) 28.6 ± 4.8
Left atrial area (cm2) 13.5 ± 2.5
Mitral E/A ratio 1.54 ± 0.4
Discussion
In this study, speckle tracking imaging was found to be a feasible and reproducible method to assess LA longitudi-nal strain in healthy subjects. The reproducibility of meas-urements was good, with lower variability in comparison with that obtained by Doppler-derived LA strain imag-ing[16]. These data suggest that speckle tracking may be considered a promising tool to explore LA myocardial deformation dynamics. Data observed in our population were also used to provide reference ranges for speckle-based LA strain indices.
The strain curve evaluated by either Doppler method or speckle tracking imaging closely follows LA physiology (Figure 3, Additional file 1). During the period of LA res-ervoir (corresponding to the phases of LV isovolumic con-traction, ejection, and isovolumic relaxation), LA strain increases, achieving a peak at the end of LA filling from the venous district, just before mitral valve opening. Dur-ing the conduit phase, LA strain decreases, showDur-ing a
pla-teau during diastasis, and achieving a negative peak at the end of LA contraction. Considering the limitations of clas-sical indices of LA function[17], assessment of LA strain by speckle tracking may represent a relatively rapid and easy-to-perform technique to explore LA function. This approach may be of potential clinical importance in a number of pathophysiologic conditions typically associ-ated to abnormal LA function, e.g. mitral valve diseases, supraventricular arrhythmias, systemic hypertension, ischemic heart disease, heart failure, atrial stunning, and cardiomyopathies.
In our population, average peak longitudinal strain was higher in apical 2-chamber view than in apical 4-chamber view. It can be hypothesized that the confounding effect of atrial septum and pulmonary veins ostia in the 4-cham-ber view – two zones where strain profile is abnormal – may have played a role in determining this discrepancy. In contrast, the average time to peak longitudinal strain was similar in the two apical views. Interestingly, these find-ings are in contrast with a recent report on LA strain meas-ured by the Doppler-derived technique, which found similar peak strain values among different LA walls, but different timing measures[16]. These discrepancies should be evaluated in further studies. It should be noted that in contrast to Doppler-derived strain imaging, speckle tracking has the advantage of being angle-independent, and to be less affected by reverberations, side lobes and drop out artifacts[8]. Nonetheless, intrinsic limitations of speckle tracking include strict frame rate dependency, potential errors in epicardial/endocardial border tracing in subjects with suboptimal image quality, and need for an appropriate learning curve to achieve adequate experi-ence in using analysis softwares.
Some limitations should be considered. The potential dif-ficulty of accurately obtaining a region of interest close enough to the effective shape of the left atrium, and the risk of contamination by signal components arising from structures surrounding the left atrium should also be con-sidered. Although the post-processing time in this study was relatively short, it closely depends on the
sonogra-Table 2: Reference ranges of left atrial strain indices
Variable Mean ± SD 5–95° Percentile range PALS (%)
Global 42.2 ± 6.1 32.2–53.2
Four-chamber average 40.1 ± 7.9 29.0–53.6
Two-chamber average 44.3 ± 6.0 35.2–52.7
TPLS (ms)
Global 368.0 ± 29.9 322.9–430.4
Four-chamber average 364.2 ± 42.6 300.8–436.9
Two-chamber average 367.4 ± 34.1 326.4–435.2
Reference values of global, 4-chamber, and 2-chamber peak atrial longitudinal strain (PALS) and time to peak strain (TPLS) in the study population.
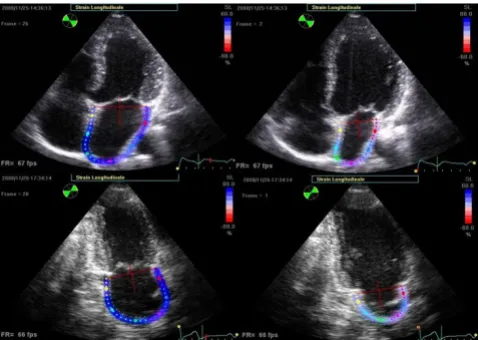
End-systolic (left panels) and end-diastolic (right panels) frames showing colour-coded left atrial longitudinal strain in a representative subject from both apical views
Figure 3
pher's experience. Lastly, because a dedicated software for LA strain analysis has not yet been released, we used the current software for LV analysis to study the LA pattern strain. Future evolutions in this regard may be useful to improve tracking quality of LA myocardial deformation, and to provide a better instrument for the study of LA function. Lastly, it should be emphasized that as for other echocardiographic new technologies, speckle tracking is progressively entering the clinical practice despite no def-inite data regarding reference ranges and no clear demon-stration of clear additive value in particular clinical conditions. The results of this study may contribute to partially fill this gap giving insight on the potential appli-cation of speckle tracking to the study of LA function, but further larger analyses are needed.
Conclusion
In summary, speckle tracking can be considered a feasible and reproducible technique for the assessment of LA lon-gitudinal deformation dynamics. Normal values of longi-tudinal strain indices were reported.
Competing interests
The authors declare that they have no competing interests.
Authors' contributions
MC, MC, ML, and EP were responsible for the collection of data and drafted the manuscript. PB performed the sta-tistical analysis and revised the manuscript for important intellectual content. SM was responsible for the design of the study and revised the manuscript for important intel-lectual content. EM provided precious support for the acquisition of data in applying the speckle tracking soft-ware to the study of left atrial myocardium. MG also revised the manuscript for important intellectual content. All authors read and approved the final manuscript.
Additional material
Acknowledgements
The authors wish to thank Vittorio Rastelli and Fabio Cattaneo, GE Health-care, Milano, Italy, for their important technical support.
References
1. Pagel PS, Kehl F, Gare M, Hettrick DA, Kersten JR, Warltier DC: Mechanical function of the left atrium. New insights based on analysis of pressure-volume relations and Doppler echocar-diography. Anestesiology 2003, 98:975-994.
2. Di Salvo G, Galderisi M, Rea A, Ansalone G, Dini FL, Gallina S, Mele D, Montisci R, Sciomer S, Mondillo S, Di Bello V, Marino PN, Gruppo di Lavoro di Ecocardiografia; Società Italiana di Cardiologia: Evalua-tion of atrial funcEvalua-tion by echocardiography. G Ital Cardiol 2007, 8:225-235.
3. Nakao F, Wasaki Y, Kimura M, Iwami T, Iida H, Wakeyama T, Miura T, Ogawa H, Matsuzaki M: Evaluation of left atrial function by the functional volume change curve derived from Doppler flow spectra. Jpn Circ J 2001, 65:953-7.
4. Marino P, Faggian G, Bertolini P, Mazzucco A, Little W: Early mitral deceleration and left atrial stiffness. Am J Physiol Heart Circ Physiol
2004, 287:H1172-1178.
5. Pérez-Paredes M, Gonzálvez M, Ruiz Ros JA, Giménez DM, Carnero A, Carrillo A, Cubero T, Martínez-Corbalán FR, García Almagro F: Assessment of Left Atrial Wall Velocities by Pulsed Wave Tissue Doppler Imaging. A New Approach to the Study of Atrial Function. Rev Esp Cardiol 2004, 57:1059-1066.
6. Di Salvo G, Caso P, Lo Piccolo R, Fusco A, Martiniello AR, Russo MG, D'Onofrio A, Severino S, Calabró P, Pacileo G, Mininni N, Calabró R: Atrial myocardial deformation properties predict mainte-nance of sinus rhythm after external cardioversion of recent-onset lone atrial fibrillation: a color Doppler myocardial imaging and transthoracic and transesophageal echocardio-graphic study. Circulation 2005, 112:387-395.
7. D'hooge J, Heimdal A, Jamal F, Kukulski T, Bijnens B, Rademakers F, Hatle L, Suetens P, Sutherland GR: Regional strain and SR meas-urements by cardiac ultrasound: principles, implementation and limitations. Eur J Echocardiogr 2000, 1:154-170.
8. Teske AJ, De Boeck BW, Melman PG, Sieswerda GT, Doevendans PA, Cramer MJ: Echocardiographic quantification of myocar-dial function using tissue deformation imaging, a guide to image acquisition and analysis using tissue Doppler and speckle tracking. Cardiovascular Ultrasound 2007, 5:27.
9. Notomi Y, Lysyansky P, Setser RM, Shiota T, Popović ZB, Martin-Miklovic MG, Weaver JA, Oryszak SJ, Greenberg NL, White RD, Thomas JD: Measurement of Ventricular Torsion by Two-Dimensional Ultrasound Speckle Tracking Imaging. J Am Coll Cardiol 2005, 45:2034-2041.
10. Di Salvo G, Drago M, Pacileo G, Rea A, Carrozza M, Santoro G, Bigazzi MC, Caso P, Russo MG, Carminati M, Calabro' R: Atrial function after surgical and percutaneous closure of atrial septal defect: a strain rate imaging study. J Am Soc Echocardiogr
2005, 18:930-933.
11. D'Andrea A, Caso P, Romano S, Scarafile R, Cuomo S, Salerno G, Rie-gler L, Limongelli G, Di Salvo G, Romano M, Liccardo B, Iengo R, Ascione L, Del Viscovo L, Calabrò P, Calabrò R: Association between left atrial myocardial function and exercise capacity in patients with either idiopathic or ischemic dilated cardio-myopathy: A two-dimensional speckle strain study. Int J Car-diol in press.
12. Lang RM, Bierig M, Devereux RB, Flachskampf FA, Foster E, Pellikka PA, Picard MH, Roman MJ, Seward J, Shanewise JS, Solomon SD, Spen-cer KT, Sutton MS, Stewart WJ, Chamber Quantification Writing Group; American Society of Echocardiography's Guidelines and Standards Committee; European Association of Echocardiography: Recommendations for Chamber Quantification: A Report from the American Society of Echocardiography's Guide-lines and Standards Committee and the Chamber Quantifi-cation Writing Group, Developed in Conjunction with the European Association of Echocardiography, a Branch of the European Society of Cardiology. J Am Soc Echocardiogr 2005, 18:1440-1463.
13. Serri K, Reant P, Lafitte M, Berhouet M, Le Bouffos V, Roudaut R, Lafitte S: Global and regional myocardial function quantifica-tion by two dimensional strain. J Am Coll Cardiol 2006, 47:1175-1181.
14. Langeland S, D'hooge J, Wouters PF, Leather HA, Claus P, Bijnens B, Sutherland GR: Experimental validation of a new ultrasound method for the simultaneous assessment of radial and longi-tudinal myocardial deformation independent of insonation angle. Circulation 2005, 112:2157-2162.
15. Kaluzynski K, Chen X, Emelianov SY, Skovoroda AR, O'Donnell M: Strain rate imaging using two-dimensional speckle tracking.
IEEE Trans Ultrason Ferroelectr Freq Control 2001, 48:1111-1123. 16. Sirbu C, Herbots L, D'hooge J, Claus P, Marciniak A, Langeland T,
Bijn-ens B, Rademakers FE, Sutherland GR: Feasibility of strain and
Additional file 1
Movie 1. Colour-coded left atrial strain assessed by speckle tracking dur-ing a representative cardiac cycle.
Click here for file
Publish with BioMed Central and every scientist can read your work free of charge
"BioMed Central will be the most significant development for disseminating the results of biomedical researc h in our lifetime."
Sir Paul Nurse, Cancer Research UK
Your research papers will be:
available free of charge to the entire biomedical community
peer reviewed and published immediately upon acceptance
cited in PubMed and archived on PubMed Central
yours — you keep the copyright
Submit your manuscript here:
http://www.biomedcentral.com/info/publishing_adv.asp
BioMedcentral strain rate imaging for the assessment of regional left atrial
deformation: a study in normal subjects. Eur J Echocardiogr
2006, 7:199-208.